Consumer Goods and FMCG Data Statistics PowerPoint Templates, PowerPoint Statistics Slides
- Sub Categories
-
- Agriculture
- Chemicals and Resources
- Construction
- Consumer Goods and FMCG
- E-Commerce
- Energy and Environmental Services
- Finance Insurance and Real Estate
- Health and Pharmaceuticals
- Internet
- Life
- Media and Advertising
- Metals and Electronics
- Retail and Trade
- Services
- Society
- Sports and Recreation
- Survey
- Technology and Telecommunications
- Transportation and Logistics
- Travel Tourism and Hospitality
- USA
-
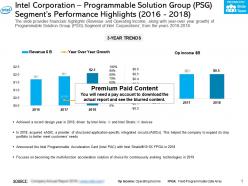 Intel corporation programmable solution group psg segments performance highlights 2016-2018
This is a professionally designed visual chart for Intel Corporation Programmable Solution Group PSG Segments Performance Highlights 2016 to 2018. This is part of our Data and Statistics products selection, and you will need a Paid account to download the actual report with accurate data and sources. Downloaded report will contain the editable graph with accurate data, an excel table with the actual data, the exact source of the data and the release date. The slide provides financials highlights Revenue and Operating Income along with year over year growth of Programmable Solution Group PSG Segment of Intel Corporations from the years 2016 to 2018. Download it immediately and use it for your business.
-
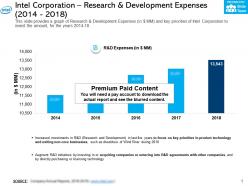 Intel corporation research and development expenses 2014-2018
This is a professionally designed visual chart for Intel Corporation Research And Development Expenses 2014 to 2018. This is part of our Data and Statistics products selection, and you will need a Paid account to download the actual report with accurate data and sources. Downloaded report will contain the editable graph with accurate data, an excel table with the actual data, the exact source of the data and the release date. This slide provides a graph of Research and Development Expenses in JPY MM and key priorities of Intel Corporation to invest the amount for the years 2014 to 18. Download it immediately and use it for your business.
-
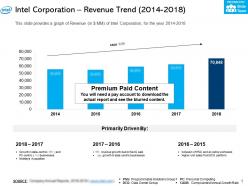 Intel corporation revenue trend 2014-2018
This is a professionally designed visual chart for Intel Corporation Revenue Trend 2014 to 2018. This is part of our Data and Statistics products selection, and you will need a Paid account to download the actual report with accurate data and sources. Downloaded report will contain the editable graph with accurate data, an excel table with the actual data, the exact source of the data and the release date. This slide provides a graph of Revenue in JPY MM of Intel Corporation for the year 2014 to 2018. Download it immediately and use it for your business.
-
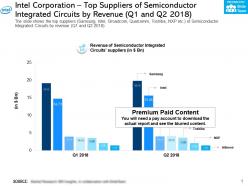 Intel corporation top suppliers of semiconductor integrated circuits by revenue q1 and q2 2018
This is a professionally designed visual chart for Intel Corporation Top Suppliers Of Semiconductor Integrated Circuits By Revenue Q1 And Q2 2018. This is part of our Data and Statistics products selection, and you will need a Paid account to download the actual report with accurate data and sources. Downloaded report will contain the editable graph with accurate data, an excel table with the actual data, the exact source of the data and the release date. The slide shows the top suppliers Samsung Intel Broadcom Qualcomm Toshiba NXP etc of Semiconductor Integrated Circuits by revenue Q1 and Q2 2018. Download it immediately and use it for your business.
-
 Intel 2016 restructuring program financials till 2018
The information presented in this slide has been researched by our team of professional business analysts. This is part of our Company Profiles products selection, and you will need a Paid account to download the actual report with accurate data and sources. Downloaded report will be in Powerpoint and will contain the actual editable slides with the actual data and sources for each data. The slide provides the key details Cost objective actions etc about the 2016 Restructuring plan of Intel Corporation for the years 2016 to 2018. Download it immediately and use it for your business.
-
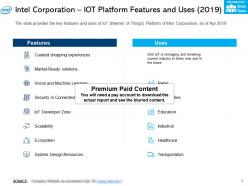 Intel corporation iot platform features and uses 2019
The information presented in this slide has been researched by our team of professional business analysts. This is part of our Company Profiles products selection, and you will need a Paid account to download the actual report with accurate data and sources. Downloaded report will be in Powerpoint and will contain the actual editable slides with the actual data and sources for each data. The slide provides the key features and uses of IoT Internet of Things Platform of Intel Corporation as of Apr 2019. Download it immediately and use it for your business.
-
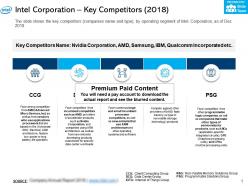 Intel corporation key competitors 2018
The information presented in this slide has been researched by our team of professional business analysts. This is part of our Company Profiles products selection, and you will need a Paid account to download the actual report with accurate data and sources. Downloaded report will be in Powerpoint and will contain the actual editable slides with the actual data and sources for each data. The slide shows the key competitors companies name and type by operating segment of Intel Corporation as of Dec 2018. Download it immediately and use it for your business.
-
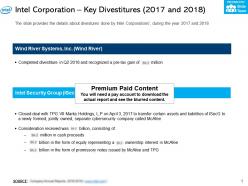 Intel corporation key divestitures 2017-2018
The information presented in this slide has been researched by our team of professional business analysts. This is part of our Company Profiles products selection, and you will need a Paid account to download the actual report with accurate data and sources. Downloaded report will be in Powerpoint and will contain the actual editable slides with the actual data and sources for each data. The slide provides the details about divestures done by Intel Corporations during the year 2017 and 2018. Download it immediately and use it for your business.
-
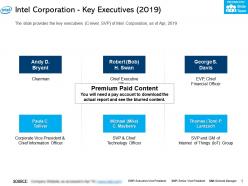 Intel corporation key executives 2019
The information presented in this slide has been researched by our team of professional business analysts. This is part of our Company Profiles products selection, and you will need a Paid account to download the actual report with accurate data and sources. Downloaded report will be in Powerpoint and will contain the actual editable slides with the actual data and sources for each data. The slide provides the key executives C level SVP of Intel Corporation as of Apr 2019. Download it immediately and use it for your business.
-
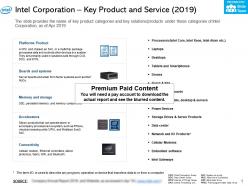 Intel corporation key product and service 2019
The information presented in this slide has been researched by our team of professional business analysts. This is part of our Company Profiles products selection, and you will need a Paid account to download the actual report with accurate data and sources. Downloaded report will be in Powerpoint and will contain the actual editable slides with the actual data and sources for each data. The slide provides the name of key product categories and key solutions products under those categories of Intel Corporation as of Apr 2019. Download it immediately and use it for your business.
-
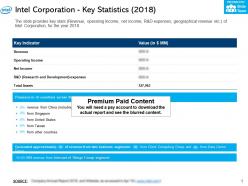 Intel corporation key statistics 2018
The information presented in this slide has been researched by our team of professional business analysts. This is part of our Company Profiles products selection, and you will need a Paid account to download the actual report with accurate data and sources. Downloaded report will be in Powerpoint and will contain the actual editable slides with the actual data and sources for each data. The slide provides key stats Revenue operating Income net income R and D expenses geographical revenue etc of Intel Corporation for the year 2018. Download it immediately and use it for your business.
-
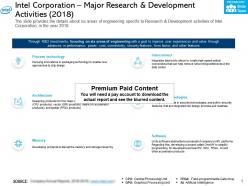 Intel corporation major research and development activities 2018
The information presented in this slide has been researched by our team of professional business analysts. This is part of our Company Profiles products selection, and you will need a Paid account to download the actual report with accurate data and sources. Downloaded report will be in Powerpoint and will contain the actual editable slides with the actual data and sources for each data. The slide provides the details about six areas of engineering specific to Research and Development activities of Intel Corporation in the year 2018. Download it immediately and use it for your business.
-
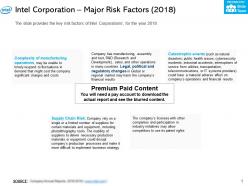 Intel corporation major risk factors 2018
The information presented in this slide has been researched by our team of professional business analysts. This is part of our Company Profiles products selection, and you will need a Paid account to download the actual report with accurate data and sources. Downloaded report will be in Powerpoint and will contain the actual editable slides with the actual data and sources for each data. The slide provides the key risk factors of Intel Corporations for the year 2018. Download it immediately and use it for your business.
-
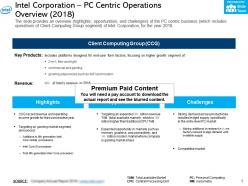 Intel corporation pc centric operations overview 2018
The information presented in this slide has been researched by our team of professional business analysts. This is part of our Company Profiles products selection, and you will need a Paid account to download the actual report with accurate data and sources. Downloaded report will be in Powerpoint and will contain the actual editable slides with the actual data and sources for each data. The slide provides an overview highlights opportunities and challenges of the PC centric business which includes operations of Client Computing Group segment of Intel Corporation for the year 2018. Download it immediately and use it for your business.
-
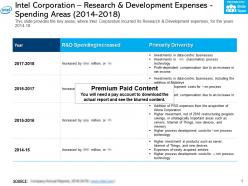 Intel corporation research and development expenses spending areas 2014-2018
The information presented in this slide has been researched by our team of professional business analysts. This is part of our Company Profiles products selection, and you will need a Paid account to download the actual report with accurate data and sources. Downloaded report will be in Powerpoint and will contain the actual editable slides with the actual data and sources for each data. This slide provides the key areas where Intel Corporation incurred its Research and Development expenses for the years 2014 to 18. Download it immediately and use it for your business.
-
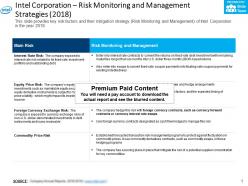 Intel corporation risk monitoring and management strategies 2018
The information presented in this slide has been researched by our team of professional business analysts. This is part of our Company Profiles products selection, and you will need a Paid account to download the actual report with accurate data and sources. Downloaded report will be in Powerpoint and will contain the actual editable slides with the actual data and sources for each data. This slide provides key risk factors and their mitigation strategy Risk Monitoring and Management of Intel Corporation in the year 2018. Download it immediately and use it for your business.
-
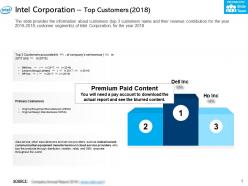 Intel corporation top customers 2018
The information presented in this slide has been researched by our team of professional business analysts. This is part of our Company Profiles products selection, and you will need a Paid account to download the actual report with accurate data and sources. Downloaded report will be in Powerpoint and will contain the actual editable slides with the actual data and sources for each data. The slide provides the information about customers top 3 customers name and their revenue contribution for the year 2016 to 2018 customer segments of Intel Corporation for the year 2018. Download it immediately and use it for your business.
-
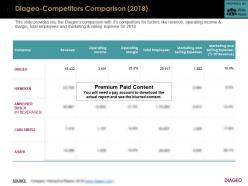 Diageo competitors comparison 2018
This is a professionally designed visual chart for Diageo Competitors Comparison 2018. This is part of our Data and Statistics products selection, and you will need a Paid account to download the actual report with accurate data and sources. Downloaded report will contain the editable graph with accurate data, an excel table with the actual data, the exact source of the data and the release date. This slide provides you the Diageos comparison with its competitors for factors like revenue, operating income and margin, total employees and marketing and selling expense for 2018. Download it immediately and use it for your business.
-
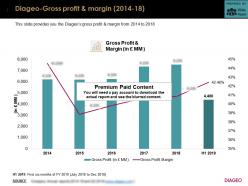 Diageo gross profit and margin 2014-18
This is a professionally designed visual chart for Diageo Gross Profit And Margin 2014 to 18. This is part of our Data and Statistics products selection, and you will need a Paid account to download the actual report with accurate data and sources. Downloaded report will contain the editable graph with accurate data, an excel table with the actual data, the exact source of the data and the release date. This slide provides you the Diageos gross profit and margin from 2014 to 2018. Download it immediately and use it for your business.
-
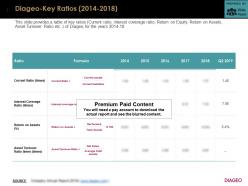 Diageo key ratios 2014-2018
This is a professionally designed visual chart for Diageo Key Ratios 2014 to 2018. This is part of our Data and Statistics products selection, and you will need a Paid account to download the actual report with accurate data and sources. Downloaded report will contain the editable graph with accurate data, an excel table with the actual data, the exact source of the data and the release date. This slide provides a table of key ratios Current ratio, interest coverage ratio, Return on Equity, Return on Assets, Asset Turnover Ratio etc. of Diageo for the years 2014 to 18. Download it immediately and use it for your business.
-
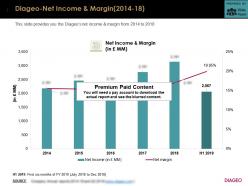 Diageo net income and margin2014-18
This is a professionally designed visual chart for Diageo Net Income And Margin2014 to 18. This is part of our Data and Statistics products selection, and you will need a Paid account to download the actual report with accurate data and sources. Downloaded report will contain the editable graph with accurate data, an excel table with the actual data, the exact source of the data and the release date. This slide provides you the Diageos net income and margin from 2014 to 2018. Download it immediately and use it for your business.
-
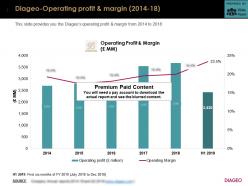 Diageo operating profit and margin 2014-18
This is a professionally designed visual chart for Diageo Operating Profit And Margin 2014 to 18. This is part of our Data and Statistics products selection, and you will need a Paid account to download the actual report with accurate data and sources. Downloaded report will contain the editable graph with accurate data, an excel table with the actual data, the exact source of the data and the release date. This slide provides you the Diageos operating profit and margin from 2014 to 2018. Download it immediately and use it for your business.
-
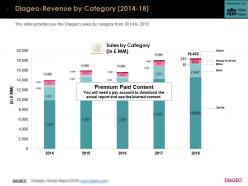 Diageo revenue by category 2014-18
This is a professionally designed visual chart for Diageo Revenue By Category 2014 to 18. This is part of our Data and Statistics products selection, and you will need a Paid account to download the actual report with accurate data and sources. Downloaded report will contain the editable graph with accurate data, an excel table with the actual data, the exact source of the data and the release date. This slide provides you the Diageos sales by category from 2014 to 2018. Download it immediately and use it for your business.
-
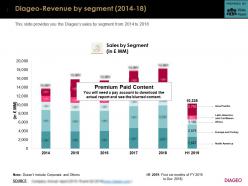 Diageo revenue by segment 2014-18
This is a professionally designed visual chart for Diageo Revenue By Segment 2014 to 18. This is part of our Data and Statistics products selection, and you will need a Paid account to download the actual report with accurate data and sources. Downloaded report will contain the editable graph with accurate data, an excel table with the actual data, the exact source of the data and the release date. This slide provides you the Diageos sales by segment from 2014 to 2018. Download it immediately and use it for your business.
-
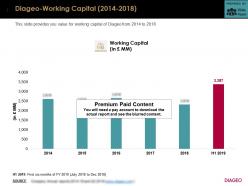 Diageo working capital 2014-2018
This is a professionally designed visual chart for Diageo Working Capital 2014 to 2018. This is part of our Data and Statistics products selection, and you will need a Paid account to download the actual report with accurate data and sources. Downloaded report will contain the editable graph with accurate data, an excel table with the actual data, the exact source of the data and the release date. This slide provides you value for working capital of Diageo from 2014 to 2018. Download it immediately and use it for your business.
-
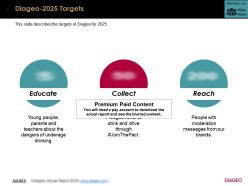 Diageo 2025 targets
The information presented in this slide has been researched by our team of professional business analysts. This is part of our Company Profiles products selection, and you will need a Paid account to download the actual report with accurate data and sources. Downloaded report will be in Powerpoint and will contain the actual editable slides with the actual data and sources for each data. This slide describes the targets of Diageo for 2025. Download it immediately and use it for your business.
-
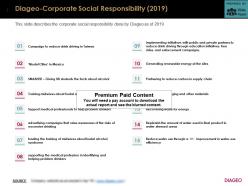 Diageo corporate social responsibility 2019
The information presented in this slide has been researched by our team of professional business analysts. This is part of our Company Profiles products selection, and you will need a Paid account to download the actual report with accurate data and sources. Downloaded report will be in Powerpoint and will contain the actual editable slides with the actual data and sources for each data. This slide describes the corporate social responsibility done by Diageo as of 2019. Download it immediately and use it for your business.
-
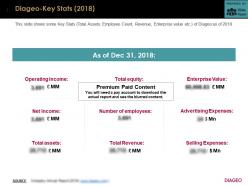 Diageo key stats 2018
The information presented in this slide has been researched by our team of professional business analysts. This is part of our Company Profiles products selection, and you will need a Paid account to download the actual report with accurate data and sources. Downloaded report will be in Powerpoint and will contain the actual editable slides with the actual data and sources for each data. This slide shows some Key Stats Total Assets, Employee Count, Revenue, Enterprise value etc. of Diageo as of 2018. Download it immediately and use it for your business.
-
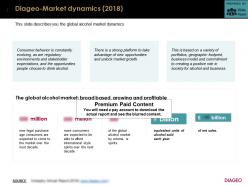 Diageo market dynamics 2018
The information presented in this slide has been researched by our team of professional business analysts. This is part of our Company Profiles products selection, and you will need a Paid account to download the actual report with accurate data and sources. Downloaded report will be in Powerpoint and will contain the actual editable slides with the actual data and sources for each data. This slide describes you the global alcohol market dynamics. Download it immediately and use it for your business.
-
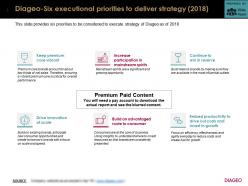 Diageo six executional priorities to deliver strategy 2018
The information presented in this slide has been researched by our team of professional business analysts. This is part of our Company Profiles products selection, and you will need a Paid account to download the actual report with accurate data and sources. Downloaded report will be in Powerpoint and will contain the actual editable slides with the actual data and sources for each data. This slide provides six priorities to be considered to execute strategy of Diageo as of 2018. Download it immediately and use it for your business.
-
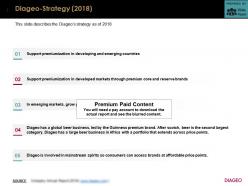 Diageo strategy 2018
The information presented in this slide has been researched by our team of professional business analysts. This is part of our Company Profiles products selection, and you will need a Paid account to download the actual report with accurate data and sources. Downloaded report will be in Powerpoint and will contain the actual editable slides with the actual data and sources for each data. This slide describes the Diageos strategy as of 2018. Download it immediately and use it for your business.
-
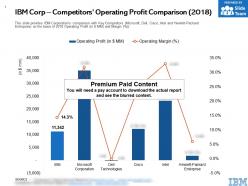 Ibm corp competitors operating profit comparison 2018
This is a professionally designed visual chart for IBM Corp Competitors Operating Profit Comparison 2018. This is part of our Data and Statistics products selection, and you will need a Paid account to download the actual report with accurate data and sources. Downloaded report will contain the editable graph with accurate data, an excel table with the actual data, the exact source of the data and the release date. This slide provides IBM Corporations comparison with Key Competitors Microsoft, Dell, Cisco, Intel and Hewlett Packard Enterprise on the basis of 2018 Operating Profit in JPY MM and Margin percent. Download it immediately and use it for your business.
-
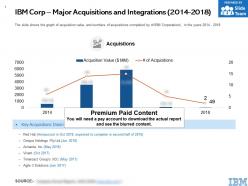 Ibm corp major acquisitions and integrations 2014-2018
This is a professionally designed visual chart for IBM Corp Major Acquisitions And Integrations 2014 to 2018. This is part of our Data and Statistics products selection, and you will need a Paid account to download the actual report with accurate data and sources. Downloaded report will contain the editable graph with accurate data, an excel table with the actual data, the exact source of the data and the release date. The slide shows the graph of acquisition value and numbers of acquisitions completed by of IBM Corporations in the years 2014 to 2018. Download it immediately and use it for your business.
-
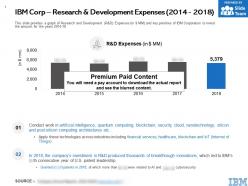 Ibm corp research and development expenses 2014-2018
This is a professionally designed visual chart for IBM Corp Research And Development Expenses 2014 to 2018. This is part of our Data and Statistics products selection, and you will need a Paid account to download the actual report with accurate data and sources. Downloaded report will contain the editable graph with accurate data, an excel table with the actual data, the exact source of the data and the release date. This slide provides a graph of Research and Development R and D Expenses in JPY MM and key priorities of IBM Corporation to invest the amount for the years 2014 to 18. Download it immediately and use it for your business.
-
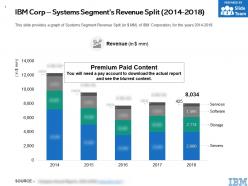 Ibm corp systems segments revenue split 2014-2018
This is a professionally designed visual chart for IBM Corp Systems Segments Revenue Split 2014 to 2018. This is part of our Data and Statistics products selection, and you will need a Paid account to download the actual report with accurate data and sources. Downloaded report will contain the editable graph with accurate data, an excel table with the actual data, the exact source of the data and the release date. This slide provides a graph of Systems Segment Revenue Split in JPY MM of IBM Corporation for the years 2014 to 2018. Download it immediately and use it for your business.
-
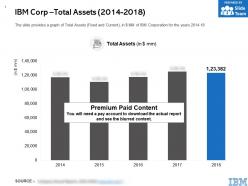 Ibm corp total assets 2014-2018
This is a professionally designed visual chart for IBM Corp Total Assets 2014 to 2018. This is part of our Data and Statistics products selection, and you will need a Paid account to download the actual report with accurate data and sources. Downloaded report will contain the editable graph with accurate data, an excel table with the actual data, the exact source of the data and the release date. The slide provides a graph of Total Assets Fixed and Current in JPY MM of IBM Corporation for the years 2014 to 18. Download it immediately and use it for your business.
-
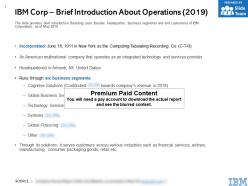 Ibm corp brief introduction about operations 2019
The information presented in this slide has been researched by our team of professional business analysts. This is part of our Company Profiles products selection, and you will need a Paid account to download the actual report with accurate data and sources. Downloaded report will be in Powerpoint and will contain the actual editable slides with the actual data and sources for each data. The slide provides brief introduction founding year, founder, headquarter, business segments and end customers of IBM Corporation, as of May 2019. Download it immediately and use it for your business.
-
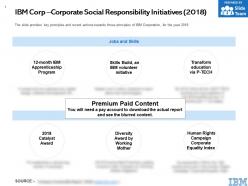 Ibm corp corporate social responsibility initiatives 2018
The information presented in this slide has been researched by our team of professional business analysts. This is part of our Company Profiles products selection, and you will need a Paid account to download the actual report with accurate data and sources. Downloaded report will be in Powerpoint and will contain the actual editable slides with the actual data and sources for each data. The slide provides key principles and recent actions towards those principles of IBM Corporation for the year 2018. Download it immediately and use it for your business.
-
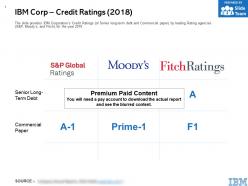 Ibm corp credit ratings 2018
The information presented in this slide has been researched by our team of professional business analysts. This is part of our Company Profiles products selection, and you will need a Paid account to download the actual report with accurate data and sources. Downloaded report will be in Powerpoint and will contain the actual editable slides with the actual data and sources for each data. The slide provides IBM Corporations Credit Ratings of Senior long term debt and Commercial paper by leading Rating agencies S and P, Moodys, and Fitch for the year 2018. Download it immediately and use it for your business.
-
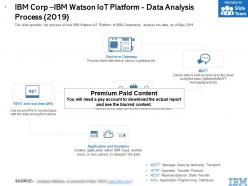 Ibm corp ibm watson iot platform data analysis process 2019
The information presented in this slide has been researched by our team of professional business analysts. This is part of our Company Profiles products selection, and you will need a Paid account to download the actual report with accurate data and sources. Downloaded report will be in Powerpoint and will contain the actual editable slides with the actual data and sources for each data. The slide provides the process of how IBM Watson IoT Platform of IBM Corporation, analyse the data, as of May 2019. Download it immediately and use it for your business.
-
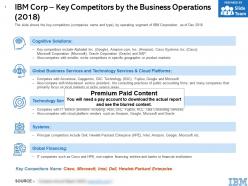 Ibm corp key competitors by the business operations 2018
The information presented in this slide has been researched by our team of professional business analysts. This is part of our Company Profiles products selection, and you will need a Paid account to download the actual report with accurate data and sources. Downloaded report will be in Powerpoint and will contain the actual editable slides with the actual data and sources for each data. The slide shows the key competitors companies name and type by operating segment of IBM Corporation, as of Dec 2018. Download it immediately and use it for your business.
-
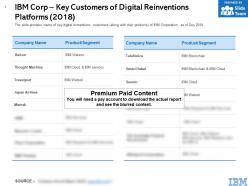 Ibm corp key customers of digital reinventions platforms 2018
The information presented in this slide has been researched by our team of professional business analysts. This is part of our Company Profiles products selection, and you will need a Paid account to download the actual report with accurate data and sources. Downloaded report will be in Powerpoint and will contain the actual editable slides with the actual data and sources for each data. The slide provides name of key digital reinventions customers along with their products of IBM Corporation, as of Dec 2018. Download it immediately and use it for your business.
-
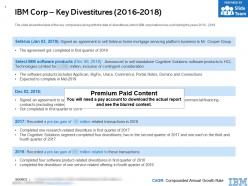 Ibm corp key divestitures 2016-2018
The information presented in this slide has been researched by our team of professional business analysts. This is part of our Company Profiles products selection, and you will need a Paid account to download the actual report with accurate data and sources. Downloaded report will be in Powerpoint and will contain the actual editable slides with the actual data and sources for each data. The slide shows the table of the key companies along with the date of divestitures which IBM corporations has sold during the years 2016 to 2018. Download it immediately and use it for your business.
-
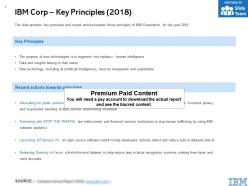 Ibm corp key principles 2018
The information presented in this slide has been researched by our team of professional business analysts. This is part of our Company Profiles products selection, and you will need a Paid account to download the actual report with accurate data and sources. Downloaded report will be in Powerpoint and will contain the actual editable slides with the actual data and sources for each data. The slide provides key principles and recent actions towards those principles of IBM Corporation for the year 2018. Download it immediately and use it for your business.
-
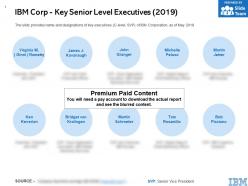 Ibm corp key senior level executives 2019
The information presented in this slide has been researched by our team of professional business analysts. This is part of our Company Profiles products selection, and you will need a Paid account to download the actual report with accurate data and sources. Downloaded report will be in Powerpoint and will contain the actual editable slides with the actual data and sources for each data. The slide provides name and designations of key executives C level, SVP of IBM Corporation, as of May 2019. Download it immediately and use it for your business.
-
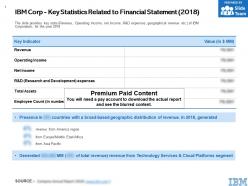 Ibm corp key statistics related to financial statement 2018
The information presented in this slide has been researched by our team of professional business analysts. This is part of our Company Profiles products selection, and you will need a Paid account to download the actual report with accurate data and sources. Downloaded report will be in Powerpoint and will contain the actual editable slides with the actual data and sources for each data. The slide provides key stats Revenue, Operating Income, net income, R and D expenses, geographical revenue etc. of IBM Corporation for the year 2018. Download it immediately and use it for your business.
-
 Ibm corp list of acquired companies 2014-2018
The information presented in this slide has been researched by our team of professional business analysts. This is part of our Company Profiles products selection, and you will need a Paid account to download the actual report with accurate data and sources. Downloaded report will be in Powerpoint and will contain the actual editable slides with the actual data and sources for each data. The slide shows the table of the key companies along with the date of acquisitions which IBM corporations has acquired during the years 2014 to 2018. Download it immediately and use it for your business.
-
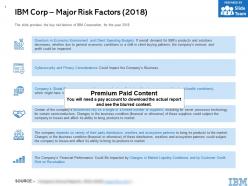 Ibm corp major risk factors 2018
The information presented in this slide has been researched by our team of professional business analysts. This is part of our Company Profiles products selection, and you will need a Paid account to download the actual report with accurate data and sources. Downloaded report will be in Powerpoint and will contain the actual editable slides with the actual data and sources for each data. The slide provides the key risk factors of IBM Corporation for the year 2018. Download it immediately and use it for your business.
-
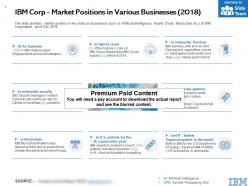 Ibm corp market positions in various businesses 2018
The information presented in this slide has been researched by our team of professional business analysts. This is part of our Company Profiles products selection, and you will need a Paid account to download the actual report with accurate data and sources. Downloaded report will be in Powerpoint and will contain the actual editable slides with the actual data and sources for each data. The slide provides market position in key stats in businesses such as Artificial Intelligence, Hybrid Cloud, Blockchain etc. of IBM Corporation, as of Dec 2018. Download it immediately and use it for your business.
-
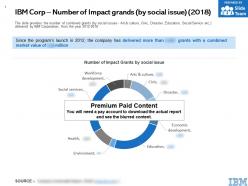 Ibm corp number of impact grands by social issue 2018
The information presented in this slide has been researched by our team of professional business analysts. This is part of our Company Profiles products selection, and you will need a Paid account to download the actual report with accurate data and sources. Downloaded report will be in Powerpoint and will contain the actual editable slides with the actual data and sources for each data. The slide provides the number of combined grants by social issues Art and culture, Civic, Disaster, Education, Social Service etc. delivered by IBM Corporation from the year 2012 to 2018. Download it immediately and use it for your business.
-
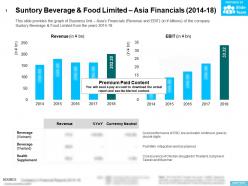 Suntory beverage and food limited asia financials 2014-18
This is a professionally designed visual chart for Suntory Beverage And Food Limited Asia Financials 2014 to 18. This is part of our Data and Statistics products selection, and you will need a Paid account to download the actual report with accurate data and sources. Downloaded report will contain the editable graph with accurate data, an excel table with the actual data, the exact source of the data and the release date. This slide provides the graph of Business Unit Asias Financials Revenue and EBIT in JPY billions of the company Suntory Beverage and Food Limited from the years 2014 to 18. Download it immediately and use it for your business.
-
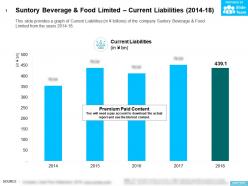 Suntory beverage and food limited current liabilities 2014-18
This is a professionally designed visual chart for Suntory Beverage And Food Limited Current Liabilities 2014 to 18. This is part of our Data and Statistics products selection, and you will need a Paid account to download the actual report with accurate data and sources. Downloaded report will contain the editable graph with accurate data, an excel table with the actual data, the exact source of the data and the release date. This slide provides a graph of Current Liabilities in JPY billions of the company Suntory Beverage and Food Limited from the years 2014 to 18. Download it immediately and use it for your business.
-
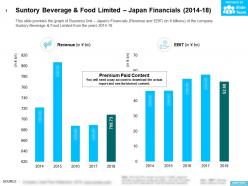 Suntory beverage and food limited japan financials 2014-18
This is a professionally designed visual chart for Suntory Beverage And Food Limited Japan Financials 2014 to 18. This is part of our Data and Statistics products selection, and you will need a Paid account to download the actual report with accurate data and sources. Downloaded report will contain the editable graph with accurate data, an excel table with the actual data, the exact source of the data and the release date. This slide provides the graph of Business Unit Japans Financials Revenue and EBIT in JPY billions of the company Suntory Beverage and Food Limited from the years 2014 to 18. Download it immediately and use it for your business.
-
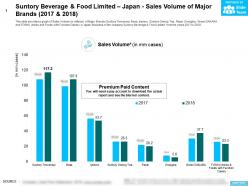 Suntory beverage and food limited japan sales volume of major brands 2017-2018
This is a professionally designed visual chart for Suntory Beverage And Food Limited Japan Sales Volume Of Major Brands 2017 to 2018. This is part of our Data and Statistics products selection, and you will need a Paid account to download the actual report with accurate data and sources. Downloaded report will contain the editable graph with accurate data, an excel table with the actual data, the exact source of the data and the release date. This slide provides a graph of Sales Volume in millions of Major Brands Suntory Tennensui Boss Iyemon Suntory Oolong Tea Pepsi Orangina Green DAKARA and FOSHU drinks and Foods with Function Claims in Japan Business of the company Suntory Beverage and Food Limited from the years 2017 to 2018. Download it immediately and use it for your business.
-
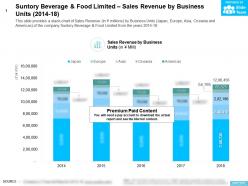 Suntory beverage and food limited sales revenue by business units 2014-18
This is a professionally designed visual chart for Suntory Beverage And Food Limited Sales Revenue By Business Units 2014 to 18. This is part of our Data and Statistics products selection, and you will need a Paid account to download the actual report with accurate data and sources. Downloaded report will contain the editable graph with accurate data, an excel table with the actual data, the exact source of the data and the release date. This slide provides a stack-chart of Sales Revenue in JPY millions by Business Units Japan Europe Asia Oceania and Americas of the company Suntory Beverage and Food Limited from the years 2014 to 18. Download it immediately and use it for your business.
-
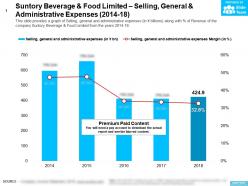 Suntory beverage and food limited selling general and administrative expenses 2014-18
This is a professionally designed visual chart for Suntory Beverage And Food Limited Selling General And Administrative Expenses 2014 to 18. This is part of our Data and Statistics products selection, and you will need a Paid account to download the actual report with accurate data and sources. Downloaded report will contain the editable graph with accurate data, an excel table with the actual data, the exact source of the data and the release date. This slide provides a graph of Selling general and administrative expenses in JPY billions along with Percentage of Revenue of the company Suntory Beverage and Food Limited from the years 2014 to 18. Download it immediately and use it for your business.
-
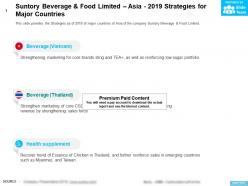 Suntory beverage and food limited asia 2019 strategies for major countries
The information presented in this slide has been researched by our team of professional business analysts. This is part of our Company Profiles products selection, and you will need a Paid account to download the actual report with accurate data and sources. Downloaded report will be in Powerpoint and will contain the actual editable slides with the actual data and sources for each data.This slide provides the Strategies as of 2019 of major countries of Asia of the company Suntory Beverage and Food Limited. Download it immediately and use it for your business.
-
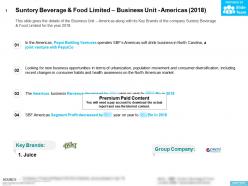 Suntory beverage and food limited business unit americas 2018
The information presented in this slide has been researched by our team of professional business analysts. This is part of our Company Profiles products selection, and you will need a Paid account to download the actual report with accurate data and sources. Downloaded report will be in Powerpoint and will contain the actual editable slides with the actual data and sources for each data. This slide gives the details of the Business Unit Americas along with its Key Brands of the company Suntory Beverage and Food Limited for the year 2018. Download it immediately and use it for your business.
-
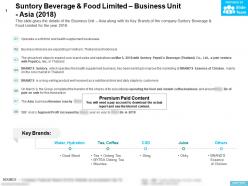 Suntory beverage and food limited business unit asia 2018
The information presented in this slide has been researched by our team of professional business analysts. This is part of our Company Profiles products selection, and you will need a Paid account to download the actual report with accurate data and sources. Downloaded report will be in Powerpoint and will contain the actual editable slides with the actual data and sources for each data. This slide gives the details of the Business Unit Asia along with its Key Brands of the company Suntory Beverage and Food Limited for the year 2018. Download it immediately and use it for your business.
-
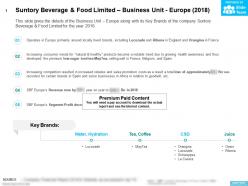 Suntory beverage and food limited business unit europe 2018
The information presented in this slide has been researched by our team of professional business analysts. This is part of our Company Profiles products selection, and you will need a Paid account to download the actual report with accurate data and sources. Downloaded report will be in Powerpoint and will contain the actual editable slides with the actual data and sources for each data. This slide gives the details of the Business Unit Europe along with its Key Brands of the company Suntory Beverage and Food Limited for the year 2018. Download it immediately and use it for your business.


