Retail and Trade Data Statistics PowerPoint Templates, PowerPoint Statistics Slides
- Sub Categories
-
- Agriculture
- Chemicals and Resources
- Construction
- Consumer Goods and FMCG
- E-Commerce
- Energy and Environmental Services
- Finance Insurance and Real Estate
- Health and Pharmaceuticals
- Internet
- Life
- Media and Advertising
- Metals and Electronics
- Retail and Trade
- Services
- Society
- Sports and Recreation
- Survey
- Technology and Telecommunications
- Transportation and Logistics
- Travel Tourism and Hospitality
- USA
-
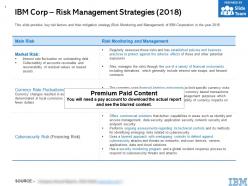 Ibm corp risk management strategies 2018
The information presented in this slide has been researched by our team of professional business analysts. This is part of our Company Profiles products selection, and you will need a Paid account to download the actual report with accurate data and sources. Downloaded report will be in Powerpoint and will contain the actual editable slides with the actual data and sources for each data. This slide provides key risk factors and their mitigation strategy Risk Monitoring and Management of IBM Corporation in the year 2018. Download it immediately and use it for your business.
-
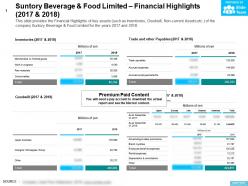 Suntory beverage and food limited financial highlights 2017-2018
This is a professionally designed visual chart for Suntory Beverage And Food Limited Financial Highlights 2017 to 2018. This is part of our Data and Statistics products selection, and you will need a Paid account to download the actual report with accurate data and sources. Downloaded report will contain the editable graph with accurate data, an excel table with the actual data, the exact source of the data and the release date. This slide provides the Financial Highlights of key assets such as Inventories Goodwill Non current Assets etc of the company Suntory Beverage and Food Limited for the years 2017 to 2018. Download it immediately and use it for your business.
-
 Suntory beverage and food limited market risks 2018
The information presented in this slide has been researched by our team of professional business analysts. This is part of our Company Profiles products selection, and you will need a Paid account to download the actual report with accurate data and sources. Downloaded report will be in Powerpoint and will contain the actual editable slides with the actual data and sources for each data. This slide provides key market risks and their mitigation strategy Risk Monitoring and Management of the company Suntory Beverage and Food Limited for the year 2018. Download it immediately and use it for your business.
-
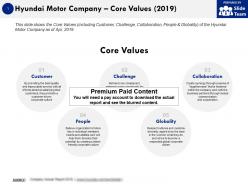 Hyundai motor company core values 2019
The information presented in this slide has been researched by our team of professional business analysts. This is part of our Company Profiles products selection, and you will need a Paid account to download the actual report with accurate data and sources. Downloaded report will be in Powerpoint and will contain the actual editable slides with the actual data and sources for each data. This slide shows the Core Values including Customer, Challenge, Collaboration, People and Globality of the Hyundai Motor Company as of Apr 2019. Download it immediately and use it for your business.
-
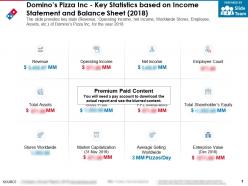 Dominos pizza inc key statistics based on income statement and balance sheet 2018
The information presented in this slide has been researched by our team of professional business analysts. This is part of our Company Profiles products selection, and you will need a Paid account to download the actual report with accurate data and sources. Downloaded report will be in Powerpoint and will contain the actual editable slides with the actual data and sources for each data. The slide provides key stats Revenue, Operating Income, net income, Worldwide Stores, Employee, Assets, etc. of Dominos Pizza Inc for the year 2018. Download it immediately and use it for your business.
-
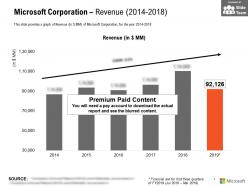 Microsoft corporation revenue 2014-2018
This is a professionally designed visual chart for Microsoft Corporation Revenue 2014 to 2018. This is part of our Data and Statistics products selection, and you will need a Paid account to download the actual report with accurate data and sources. Downloaded report will contain the editable graph with accurate data, an excel table with the actual data, the exact source of the data and the release date. This slide provides a graph of Revenue in JPY MM of Microsoft Corporation for the year 2014 to 2018. Download it immediately and use it for your business.
-
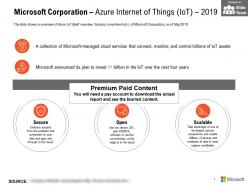 Microsoft corporation azure internet of things iot 2019
The information presented in this slide has been researched by our team of professional business analysts. This is part of our Company Profiles products selection, and you will need a Paid account to download the actual report with accurate data and sources. Downloaded report will be in Powerpoint and will contain the actual editable slides with the actual data and sources for each data. The slide shows an overview of Azure IoT brief overview features investment etc of Microsoft Corporation as of May 2019. Download it immediately and use it for your business.
-
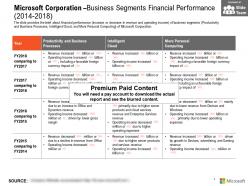 Microsoft corporation business segments financial performance 2014-2018
The information presented in this slide has been researched by our team of professional business analysts. This is part of our Company Profiles products selection, and you will need a Paid account to download the actual report with accurate data and sources. Downloaded report will be in Powerpoint and will contain the actual editable slides with the actual data and sources for each data. The slide provides the brief about financial performance increase or decrease in revenue and operating income of business segments Productivity and Business Processes Intelligent Cloud and More Personal Computing of Microsoft Corporation. Download it immediately and use it for your business.
-
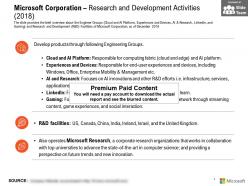 Microsoft corporation research and development activities 2018
The information presented in this slide has been researched by our team of professional business analysts. This is part of our Company Profiles products selection, and you will need a Paid account to download the actual report with accurate data and sources. Downloaded report will be in Powerpoint and will contain the actual editable slides with the actual data and sources for each data. The slide provides the brief overview about the Engineer Groups Cloud and AI Platform Experiences and Devices AI and Research LinkedIn and Gaming and Research and Development R and D Facilities of Microsoft Corporation as of December 2018. Download it immediately and use it for your business.
-
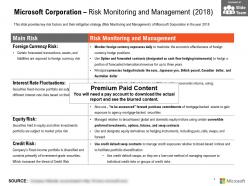 Microsoft corporation risk monitoring and management 2018
The information presented in this slide has been researched by our team of professional business analysts. This is part of our Company Profiles products selection, and you will need a Paid account to download the actual report with accurate data and sources. Downloaded report will be in Powerpoint and will contain the actual editable slides with the actual data and sources for each data. This slide provides key risk factors and their mitigation strategy Risk Monitoring and Management of Microsoft Corporation in the year 2018. Download it immediately and use it for your business.
-
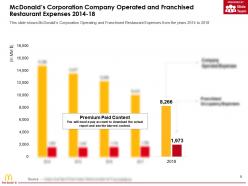 Mcdonalds corporation company operated and franchised restaurant expenses 2014-18
This is a professionally designed visual chart for Mcdonalds Corporation Company Operated And Franchised Restaurant Expenses 2014-18. This is part of our Data and Statistics products selection, and you will need a Paid account to download the actual report with accurate data and sources. Downloaded report will contain the editable graph with accurate data, an excel table with the actual data, the exact source of the data and the release date. This slide shows McDonalds Corporation Operating and Franchised Restaurant Expenses from the years 2014 to 2018. Download it immediately and use it for your business.
-
 Asahi group holdings ltd statistic 1 soft drinks business segment
This is a professionally designed visual chart for Asahi Group Holdings Ltd Statistic 1 Soft Drinks Business Segment. This is part of our Data and Statistics products selection, and you will need a Paid account to download the actual report with accurate data and sources. Downloaded report will contain the editable graph with accurate data, an excel table with the actual data, the exact source of the data and the release date. This slide provides a sales volume of Soft Drinks Business Segment by marketing channel vending machines, Convenience stores, supermarkets etc. of Asahi Group Holdings, Ltd for the years 2014 to 18. Download it immediately and use it for your business.
-
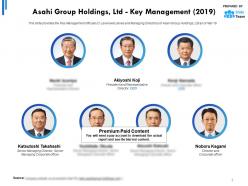 Asahi group holdings ltd key management 2019
The information presented in this slide has been researched by our team of professional business analysts. This is part of our Company Profiles products selection, and you will need a Paid account to download the actual report with accurate data and sources. Downloaded report will be in Powerpoint and will contain the actual editable slides with the actual data and sources for each data. This slide provides the Key Management officials C-Level executives and Managing Directors of Asahi Group Holdings, Ltd as of Mar19. Download it immediately and use it for your business.
-
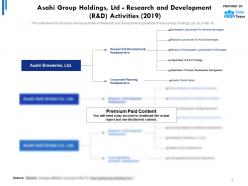 Asahi group holdings ltd research and development r and d activities 2019
The information presented in this slide has been researched by our team of professional business analysts. This is part of our Company Profiles products selection, and you will need a Paid account to download the actual report with accurate data and sources. Downloaded report will be in Powerpoint and will contain the actual editable slides with the actual data and sources for each data. This slide shows the structure and key activities of Research and Development operations of Asahi Group Holdings, Ltd as of Mar19. Download it immediately and use it for your business.
-
 Pepsico company challenges 2018
The information presented in this slide has been researched by our team of professional business analysts. This is part of our Company Profiles products selection, and you will need a Paid account to download the actual report with accurate data and sources. Downloaded report will be in Powerpoint and will contain the actual editable slides with the actual data and sources for each data. This slide depicts the challenges faced by PepsiCo company in 2018. Download it immediately and use it for your business.
-
 Pepsico company segmentation 2018
The information presented in this slide has been researched by our team of professional business analysts. This is part of our Company Profiles products selection, and you will need a Paid account to download the actual report with accurate data and sources. Downloaded report will be in Powerpoint and will contain the actual editable slides with the actual data and sources for each data. This slide depicts the segmentation of PepsiCo Company in 2018. Download it immediately and use it for your business.
-
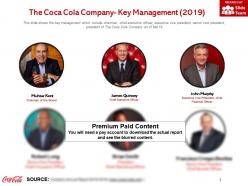 The coca cola company key management 2019
The information presented in this slide has been researched by our team of professional business analysts. This is part of our Company Profiles products selection, and you will need a Paid account to download the actual report with accurate data and sources. Downloaded report will be in Powerpoint and will contain the actual editable slides with the actual data and sources for each data. This slide shows the key management which include chairman, chief executive officer, executive vice president, senior vice president, president of The Coca Cola Company as of Mar19. Download it immediately and use it for your business.
-
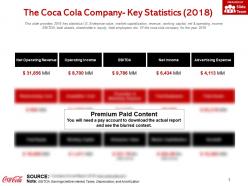 The coca cola company key statistics 2018
The information presented in this slide has been researched by our team of professional business analysts. This is part of our Company Profiles products selection, and you will need a Paid account to download the actual report with accurate data and sources. Downloaded report will be in Powerpoint and will contain the actual editable slides with the actual data and sources for each data. This slide provides 2018 key statistics I.E. Enterprise value, market capitalization, revenue, working capital, net and operating income, EBITDA, total assets, shareholders equity, total employees etc. Of the coca cola company for the year 2018. Download it immediately and use it for your business.
-
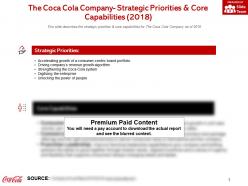 The coca cola company strategic priorities and core capabilities 2018
The information presented in this slide has been researched by our team of professional business analysts. This is part of our Company Profiles products selection, and you will need a Paid account to download the actual report with accurate data and sources. Downloaded report will be in Powerpoint and will contain the actual editable slides with the actual data and sources for each data. This slide describes the strategic priorities and core capabilities for The Coca Cola Company as of 2018. Download it immediately and use it for your business.
-
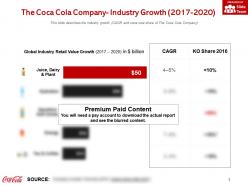 The coca cola company industry growth 2017-2020
This is a professionally designed visual chart for The Coca Cola Company Industry Growth 2017 to 2020. This is part of our Data and Statistics products selection, and you will need a Paid account to download the actual report with accurate data and sources. Downloaded report will contain the editable graph with accurate data, an excel table with the actual data, the exact source of the data and the release date. This slide describes the industry growth CAGR and coca cola share of The Coca Cola Company. Download it immediately and use it for your business.
-
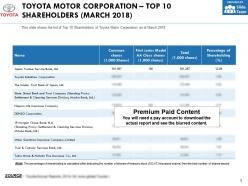 Toyota motor corporation top 10 shareholders march 2018
The information presented in this slide has been researched by our team of professional business analysts. This is part of our Company Profiles products selection, and you will need a Paid account to download the actual report with accurate data and sources. Downloaded report will be in Powerpoint and will contain the actual editable slides with the actual data and sources for each data. This slide shows the list of Top 10 Shareholders of Toyota Motor Corporation as of March 2018. Download it immediately and use it for your business.
-
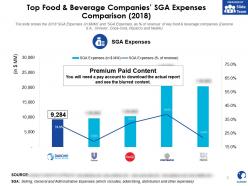 Danone top food and beverage companies sga expenses comparison 2018
This is a professionally designed visual chart for Danone Top Food And Beverage Companies SGA Expenses Comparison 2018. This is part of our Data and Statistics products selection, and you will need a Paid account to download the actual report with accurate data and sources. Downloaded report will contain the editable graph with accurate data, an excel table with the actual data, the exact source of the data and the release date. The slide shows the 2018 SGA Expenses in JPY MM and SGA Expenses as percent of revenue of key food and beverage companies Danone S.A, Unilever, Coca-Cola, PepsiCo and Nestle. Download it immediately and use it for your business.
-
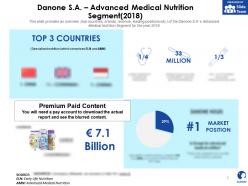 Danone sa advanced medical nutrition segment 2018
The information presented in this slide has been researched by our team of professional business analysts. This is part of our Company Profiles products selection, and you will need a Paid account to download the actual report with accurate data and sources. Downloaded report will be in Powerpoint and will contain the actual editable slides with the actual data and sources for each data. This slide provides an overview top countries, brands, revenue, leading positions etc. of the Danone S.As Advanced Medical Nutrition Segment for the year 2018. Download it immediately and use it for your business.
-
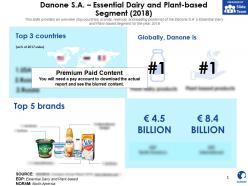 Danone sa essential dairy and plant based segment 2018
The information presented in this slide has been researched by our team of professional business analysts. This is part of our Company Profiles products selection, and you will need a Paid account to download the actual report with accurate data and sources. Downloaded report will be in Powerpoint and will contain the actual editable slides with the actual data and sources for each data. This slide provides an overview top countries, brands, revenue, and leading positions of the Danone S.As Essential Dairy and Plant based Segment for the year 2018. Download it immediately and use it for your business.
-
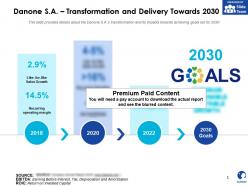 Danone sa transformation and delivery towards 2030
The information presented in this slide has been researched by our team of professional business analysts. This is part of our Company Profiles products selection, and you will need a Paid account to download the actual report with accurate data and sources. Downloaded report will be in Powerpoint and will contain the actual editable slides with the actual data and sources for each data. This slide provides details about the Danone S.As transformation and its impacts towards achieving goals set for 2030. Download it immediately and use it for your business.
-
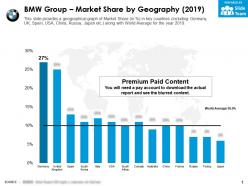 Bmw group market share by geography 2019
This is a professionally designed visual chart for BMW Group Market Share By Geography 2019. This is part of our Data and Statistics products selection, and you will need a Paid account to download the actual report with accurate data and sources. Downloaded report will contain the editable graph with accurate data, an excel table with the actual data, the exact source of the data and the release date. This slide provides a geographical graph of Market Share in Percentage in key countries including Germany, UK, Spain, USA, China, Russia, Japan etc. along with World Average for the year 2019. Download it immediately and use it for your business.
-
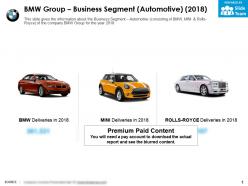 Bmw group business segment automotive 2018
The information presented in this slide has been researched by our team of professional business analysts. This is part of our Company Profiles products selection, and you will need a Paid account to download the actual report with accurate data and sources. Downloaded report will be in Powerpoint and will contain the actual editable slides with the actual data and sources for each data. This slide gives the information about the Business Segment Automotive consisting of BMW, MINI and Rolls Royce of the company BMW Group for the year 2018. Download it immediately and use it for your business.
-
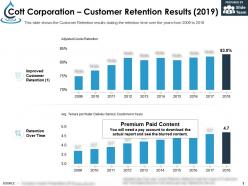 Cott corporation customer retention results 2019
This is a professionally designed visual chart for Cott Corporation Customer Retention Results 2019. This is part of our Data and Statistics products selection, and you will need a Paid account to download the actual report with accurate data. Downloaded report will contain the editable graph with accurate data, an excel table with the actual data, the exact source of the data and the release date. This slide shows the Customer Retention results stating the retention time over the years from 2009 to 2018. Download it immediately and use it for your business.
-
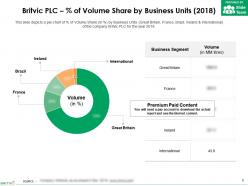 Britvic plc percent of volume share by business units 2018
This is a professionally designed visual chart for Britvic Plc Percent Of Volume Share By Business Units 2018. This is part of our Data and Statistics products selection, and you will need a Paid account to download the actual report with accurate data and sources. Downloaded report will contain the editable graph with accurate data, an excel table with the actual data, the exact source of the data and the release date. This slide depicts a pie chart of percent of Volume Share in percent by Business Units Great Britain, France, Brazil, Ireland and International of the company Britvic PLC for the year 2018. . Download it immediately and use it for your business.
-
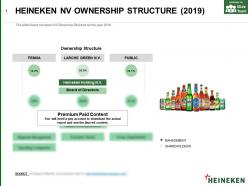 Heineken nv ownership structure 2019
The information presented in this slide has been researched by our team of professional business analysts. This is part of our Company Profiles products selection, and you will need a Paid account to download the actual report with accurate data and sources. Downloaded report will be in Powerpoint and will contain the actual editable slides with the actual data and sources for each data. This slide shows Heineken NV Ownership Structure for the year 2019. Download it immediately and use it for your business.
-
 Daimler group brands 2019
The information presented in this slide has been researched by our team of professional business analysts. This is part of our Company Profiles products selection, and you will need a Paid account to download the actual report with accurate data and sources. Downloaded report will be in Powerpoint and will contain the actual editable slides with the actual data and sources for each data. This slide shows Daimler Group Brands like Setra, Fuso, Western star, Maybach etc for the year 2019. Download it immediately and use it for your business.
-
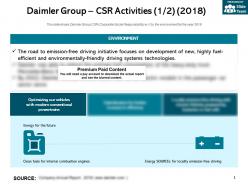 Daimler group csr activities 2018
The information presented in this slide has been researched by our team of professional business analysts. This is part of our Company Profiles products selection, and you will need a Paid account to download the actual report with accurate data and sources. Downloaded report will be in Powerpoint and will contain the actual editable slides with the actual data and sources for each data. This slide shows Daimler Group CSR Corporate Social Responsibility w.r.t to the environment for the year 2018. Download it immediately and use it for your business.
-
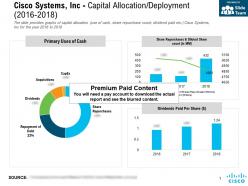 Cisco systems inc capital allocation deployment 2016-2018
This is a professionally designed visual chart for Cisco Systems Inc Capital Allocation Deployment 2016 to 2018. This is part of our Data and Statistics products selection, and you will need a Paid account to download the actual report with accurate data and sources. Downloaded report will contain the editable graph with accurate data, an excel table with the actual data, the exact source of the data and the release date. The slide provides graphs of capital allocation use of cash, share repurchase count, dividend paid etc. Cisco Systems, Inc for the year 2016 to 2018. Download it immediately and use it for your business.
-
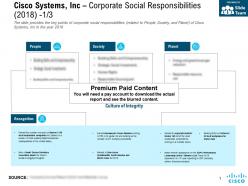 Cisco systems inc corporate social responsibilities 2018
The information presented in this slide has been researched by our team of professional business analysts. This is part of our Company Profiles products selection, and you will need a Paid account to download the actual report with accurate data and sources. Downloaded report will be in Powerpoint and will contain the actual editable slides with the actual data and sources for each data. The slide provides the key points of corporate social responsibilities related to People, Society, and Planet of Cisco Systems, Inc in the year 2018. Download it immediately and use it for your business.
-
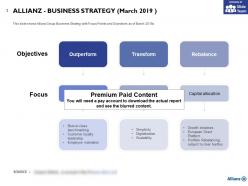 Allianz business strategy march 2019
The information presented in this slide has been researched by our team of professional business analysts. This is part of our Company Profiles products selection, and you will need a Paid account to download the actual report with accurate data and sources. Downloaded report will be in Powerpoint and will contain the actual editable slides with the actual data and sources for each data. This slide shows Allianz Group Business Strategy with Focus Points and Objectives as of March 2019z. Download it immediately and use it for your business.
-
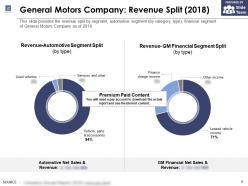 General motors company revenue split 2018
This is a professionally designed visual chart for General Motors Company Revenue Split 2018. This is part of our Data and Statistics products selection, and you will need a Paid account to download the actual report with accurate data and sources. Downloaded report will contain the editable graph with accurate data, an excel table with the actual data, the exact source of the data and the release date. This slide provides the revenue split by segment, automotive segment by category, type, financial segment of General Motors Company as of 2018. Download it immediately and use it for your business.
-
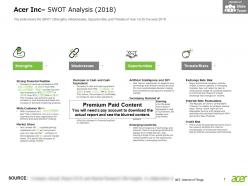 Acer inc swot analysis 2018
The information presented in this slide has been researched by our team of professional business analysts. This is part of our Company Profiles products selection, and you will need a Paid account to download the actual report with accurate data and sources. Downloaded report will be in Powerpoint and will contain the actual editable slides with the actual data and sources for each data. The slide shows the SWOT Strengths, Weaknesses, Opportunities and Threats of Acer Inc for the year 2018. Download it immediately and use it for your business.
-
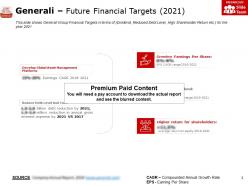 Generali future financial targets 2021
The information presented in this slide has been researched by our team of professional business analysts. This is part of our Company Profiles products selection, and you will need a Paid account to download the actual report with accurate data and sources. Downloaded report will be in Powerpoint and will contain the actual editable slides with the actual data and sources for each data. This slide shows Generali Group Financial Targets in terms of Dividend, Reduced Debt Level, High Shareholder Return etc. for the year 2021. Download it immediately and use it for your business.
-
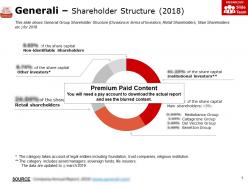 Generali shareholder structure 2018
The information presented in this slide has been researched by our team of professional business analysts. This is part of our Company Profiles products selection, and you will need a Paid account to download the actual report with accurate data and sources. Downloaded report will be in Powerpoint and will contain the actual editable slides with the actual data and sources for each data. This slide shows Generali Group Shareholder Structure Divisions in terms of Investors, Retail Shareholders, Main Shareholders etc. for 2018. Download it immediately and use it for your business.
-
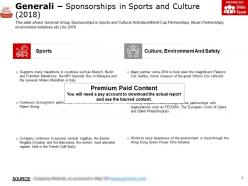 Generali sponsorships in sports and culture 2018
The information presented in this slide has been researched by our team of professional business analysts. This is part of our Company Profiles products selection, and you will need a Paid account to download the actual report with accurate data and sources. Downloaded report will be in Powerpoint and will contain the actual editable slides with the actual data and sources for each data. This slide shows Generali Group Sponsorships in Sports and Cultural Activities World Cup Partnerships, Music Partnerships, environment initiatives etc. for 2018. Download it immediately and use it for your business.
-
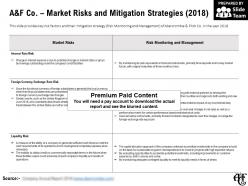 A and f co market risks and mitigation strategies 2018
The information presented in this slide has been researched by our team of professional business analysts. This is part of our Company Profiles products selection, and you will need a Paid account to download the actual report with accurate data and sources. Downloaded report will be in Powerpoint and will contain the actual editable slides with the actual data and sources for each data. This slide provides key risk factors and their mitigation strategy Risk Monitoring and Management of Abercrombie and Fitch Co. in the year 2018. Download it immediately and use it for your business.
-
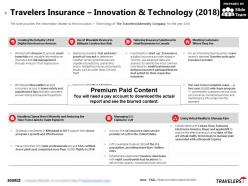 Travelers insurance innovation and technology 2018
The information presented in this slide has been researched by our team of professional business analysts. This is part of our Company Profiles products selection, and you will need a Paid account to download the actual report with accurate data and sources. Downloaded report will be in Powerpoint and will contain the actual editable slides with the actual data and sources for each data. The slide provides the information related to the Innovation Technology of The Travelers Indemnity Company for the year 2018. Download it immediately and use it for your business.
-
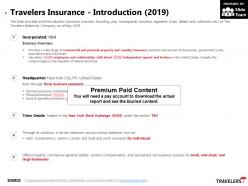 Travelers insurance introduction 2019
The information presented in this slide has been researched by our team of professional business analysts. This is part of our Company Profiles products selection, and you will need a Paid account to download the actual report with accurate data and sources. Downloaded report will be in Powerpoint and will contain the actual editable slides with the actual data and sources for each data. The slide provides brief introduction business overview, founding year, headquarter, business segments, ticker details end customers etc of The Travelers Indemnity Company as of May 2019. Download it immediately and use it for your business.
-
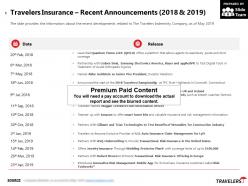 Travelers insurance recent announcements 2018-2019
The information presented in this slide has been researched by our team of professional business analysts. This is part of our Company Profiles products selection, and you will need a Paid account to download the actual report with accurate data and sources. Downloaded report will be in Powerpoint and will contain the actual editable slides with the actual data and sources for each data. The slide provides the information about the recent developments related to The Travelers Indemnity Company as of May 2019. Download it immediately and use it for your business.
-
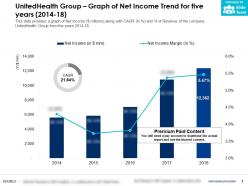 Unitedhealth group graph of net income trend for five years 2014-18
This is a professionally designed visual chart for UnitedHealth Group Graph Of Net Income Trend For Five Years 2014 to 18. This is part of our Data and Statistics products selection, and you will need a Paid account to download the actual report with accurate data and sources. Downloaded report will contain the editable graph with accurate data, an excel table with the actual data, the exact source of the data and the release date. This slide provides a graph of Net Income JPY millions along with CAGR in percent and percent of Revenue of the company UnitedHealth Group from the years 2014 to 18. Download it immediately and use it for your business.
-
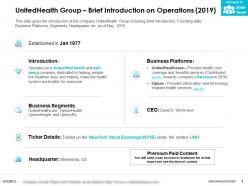 Unitedhealth group brief introduction on operations 2019
The information presented in this slide has been researched by our team of professional business analysts. This is part of our Company Profiles products selection, and you will need a Paid account to download the actual report with accurate data and sources. Downloaded report will be in Powerpoint and will contain the actual editable slides with the actual data and sources for each data. This slide gives the introduction of the company UnitedHealth Group including Brief Introduction, Founding date, Business Platforms, Segments, Headquarter etc. as of May 2019. Download it immediately and use it for your business.
-
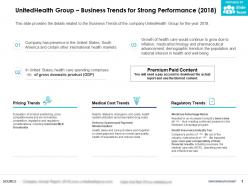 Unitedhealth group business trends for strong performance 2018
The information presented in this slide has been researched by our team of professional business analysts. This is part of our Company Profiles products selection, and you will need a Paid account to download the actual report with accurate data and sources. Downloaded report will be in Powerpoint and will contain the actual editable slides with the actual data and sources for each data. This slide provides the details related to the Business Trends of the company UnitedHealth Group for the year 2018. Download it immediately and use it for your business.
-
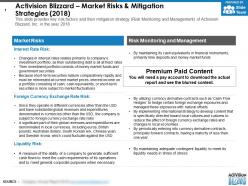 Activision blizzard market risks and mitigation strategies 2018
The information presented in this slide has been researched by our team of professional business analysts. This is part of our Company Profiles products selection, and you will need a Paid account to download the actual report with accurate data and sources. Downloaded report will be in Powerpoint and will contain the actual editable slides with the actual data and sources for each data. This slide provides key risk factors and their mitigation strategy Risk Monitoring and Management of Activision Blizzard Inc in the year 2018. Download it immediately and use it for your business.
-
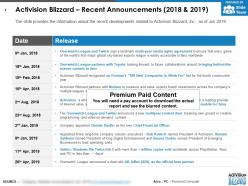 Activision blizzard recent announcements 2018-2019
The information presented in this slide has been researched by our team of professional business analysts. This is part of our Company Profiles products selection, and you will need a Paid account to download the actual report with accurate data and sources. Downloaded report will be in Powerpoint and will contain the actual editable slides with the actual data and sources for each data. The slide provides the information about the recent developments related to Activision Blizzard Inc as of Jun 2019. Download it immediately and use it for your business.
-
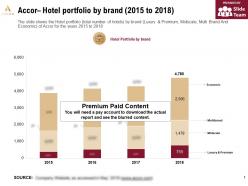 Accor hotel portfolio by brand 2015-2018
This is a professionally designed visual chart for Accor Hotel Portfolio By Brand 2015 to 2018. This is part of our Data and Statistics products selection, and you will need a Paid account to download the actual report with accurate data and sources. Downloaded report will contain the editable graph with accurate data, an excel table with the actual data, the exact source of the data and the release date. The slide shows the Hotel portfolio total number of hotels by brand Luxury and Premium, Midscale, Multi Brand And Economic of Accor for the years 2015 to 2018. Download it immediately and use it for your business.
-
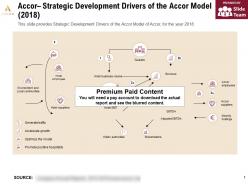 Accor strategic development drivers of the accor model 2018
The information presented in this slide has been researched by our team of professional business analysts. This is part of our Company Profiles products selection, and you will need a Paid account to download the actual report with accurate data and sources. Downloaded report will be in Powerpoint and will contain the actual editable slides with the actual data and sources for each data. This slide provides Strategic Development Drivers of the Accor Model of Accor for the year 2018.. Download it immediately and use it for your business.
-
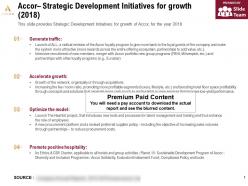 Accor strategic development initiatives for growth 2018
The information presented in this slide has been researched by our team of professional business analysts. This is part of our Company Profiles products selection, and you will need a Paid account to download the actual report with accurate data and sources. Downloaded report will be in Powerpoint and will contain the actual editable slides with the actual data and sources for each data. This slide provides Strategic Development Initiatives for growth of Accor for the year 2018. Download it immediately and use it for your business.
-
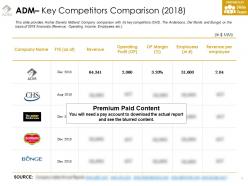 Adm key competitors comparison 2018
This is a professionally designed visual chart for Adm Key Competitors Comparison 2018. This is part of our Data and Statistics products selection, and you will need a Paid account to download the actual report with accurate data and sources. Downloaded report will contain the editable graph with accurate data, an excel table with the actual data, the exact source of the data and the release date. This slide provides Archer Daniels Midland Company comparison with its key competitors CHS, The Andersons, Del Monte and Bunge on the basis of 2018 financials Revenue, Operating Income, Employees etc. Download it immediately and use it for your business.
-
 Anthem key ratios liquidity profitability debt ratio 2014-18
This is a professionally designed visual chart for Anthem Key Ratios Liquidity Profitability Debt Ratio 2014 to 18. This is part of our Data and Statistics products selection, and you will need a Paid account to download the actual report with accurate data and sources. Downloaded report will contain the editable graph with accurate data, an excel table with the actual data, the exact source of the data and the release date. This slide provides a table of key ratios Current ratio, interest coverage ratio, Return on Assets, Debt to equity ratio of Anthem Inc. for the years 2014 to 18. Download it immediately and use it for your business.
-
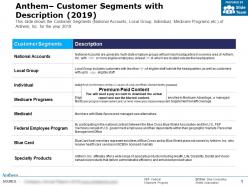 Anthem customer segments with description 2019
The information presented in this slide has been researched by our team of professional business analysts. This is part of our Company Profiles products selection, and you will need a Paid account to download the actual report with accurate data and sources. Downloaded report will be in Powerpoint and will contain the actual editable slides with the actual data and sources for each data. This slide shows the Customer Segments National Accounts, Local Group, Individual, Medicare Programs etc. of Anthem Inc. for the year 2019. Download it immediately and use it for your business.
-
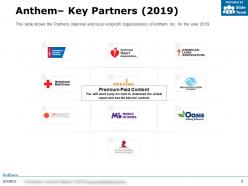 Anthem key partners 2019
The information presented in this slide has been researched by our team of professional business analysts. This is part of our Company Profiles products selection, and you will need a Paid account to download the actual report with accurate data and sources. Downloaded report will be in Powerpoint and will contain the actual editable slides with the actual data and sources for each data. This slide shows the Partners national and local nonprofit organizations of Anthem Inc. for the year 2019. Download it immediately and use it for your business.
-
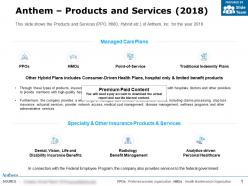 Anthem products and services 2018
The information presented in this slide has been researched by our team of professional business analysts. This is part of our Company Profiles products selection, and you will need a Paid account to download the actual report with accurate data and sources. Downloaded report will be in Powerpoint and will contain the actual editable slides with the actual data and sources for each data. This slide shows the Products and Services PPO, HMO, Hybrid etc. of Anthem Inc. for the year 2018. Download it immediately and use it for your business.
-
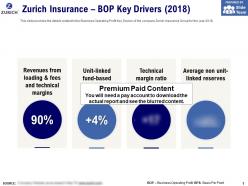 Zurich insurance bop key drivers 2018
The information presented in this slide has been researched by our team of professional business analysts. This is part of our Company Profiles products selection, and you will need a Paid account to download the actual report with accurate data and sources. Downloaded report will be in Powerpoint and will contain the actual editable slides with the actual data and sources for each data. This slide provides the details related to the Business Operating Profit Key Drivers of the company Zurich Insurance Group for the year 2018. Download it immediately and use it for your business.
-
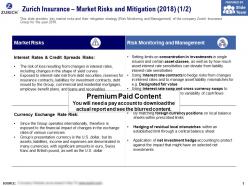 Zurich insurance market risks and mitigation 2018
The information presented in this slide has been researched by our team of professional business analysts. This is part of our Company Profiles products selection, and you will need a Paid account to download the actual report with accurate data and sources. Downloaded report will be in Powerpoint and will contain the actual editable slides with the actual data and sources for each data. This slide provides key market risks and their mitigation strategy Risk Monitoring and Management of the company Zurich Insurance Group for the year 2018. Download it immediately and use it for your business.
-
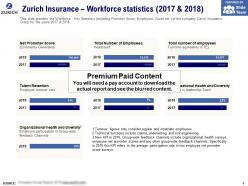 Zurich insurance workforce statistics 2017-2018
The information presented in this slide has been researched by our team of professional business analysts. This is part of our Company Profiles products selection, and you will need a Paid account to download the actual report with accurate data and sources. Downloaded report will be in Powerpoint and will contain the actual editable slides with the actual data and sources for each data. This slide provides the Workforce Key Statistics including Promoter Score, Employees Count etc. of the company Zurich Insurance Group for the years 2017 to 2018. Download it immediately and use it for your business.


