- Sub Categories
-
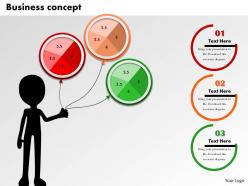 0514 tricolor business data driven display powerpoint slides
Presentation templates work smoothly on each software capable of running slides. Effortlessly convert to JPG and PDF formats. Compatible with Google slides for additional shared viewing. Convenient widescreen viewing without PPT graphics pixilation. No space constraint issues when adding titles and sub titles to the PPT design. Insert company logo, trademark without worries. High resolution PPT graphics for crisp viewing. Customizable layout including font, text, color, design. This example of great PPT can be used in businesses, startups and education.
-
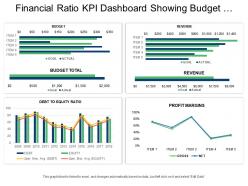 Financial ratio kpi dashboard snapshot showing budget revenue and profit margins
Presenting this set of slides with name - Financial Ratio Kpi Dashboard Snapshot Showing Budget Revenue And Profit Margins. This is a four stage process. The stages in this process are Accounting Ratio, Financial Statement, Financial Ratio.
-
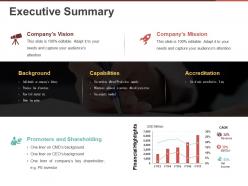 Executive summary powerpoint themes
Presenting this set of slides with name - Executive Summary Powerpoint Themes. This is a three stage process. The stages in this process are Bar Chart, Finance, Marketing, Analysis, Strategy, Business.
-
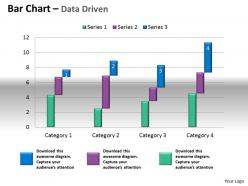 Data driven bar chart to compare quantities powerpoint slides
We are proud to present our data driven bar chart to compare quantities powerpoint slides. Use Our Data Driven Bar Chart To Compare Quantities Powerpoint Slides Power Point Templates In Concert. Create A Masterful Melody With Your Ideas. Light A Fire With Our Data Driven Bar Chart To Compare Quantities Powerpoint Slides Power Point Templates. Spread The Warmth Of Your Ideas.
-
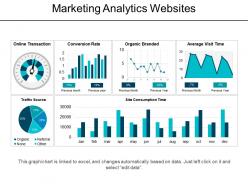 Marketing analytics websites powerpoint topics
Presenting marketing analytics websites powerpoint topics. This is a marketing analytics websites powerpoint topics. This is a six stage process. The stages in this process are market analysis, marketing analytics, web analytics, marketing optimization.
-
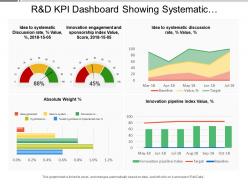 R and d kpi dashboard showing systematic discussion rate innovation engagement and sponsorship index
Presenting this set of slides with name - R And D Kpi Dashboard Showing Systematic Discussion Rate Innovation Engagement And Sponsorship Index. This is a four stage process. The stages in this process are R And D, Research And Development, Research And Technological Development.
-
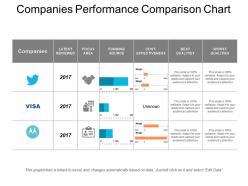 Companies performance comparison chart powerpoint templates
Presenting Companies Performance Comparison Chart Powerpoint Template. The slide is totally compatible with Google Slides. It can be customised as per your requirement. Also, related content can be added in the text holders provided. The size, style and color of the font can be changed according to your requirement. The slide is available in two sizes - standard screen size and wide screen size. It has a high resolution which ensures that the image does not blur upon enlarging. It can be downloaded easily.
-
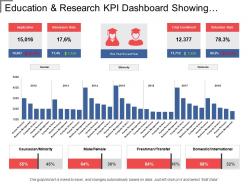 Education and research kpi dashboard showing retention rate and admissions
Presenting education and research KPI dashboard showing retention rate and admissions PPT slide. The KPI for school teachers PPT slide designed by professional team of SlideTeam. The education presentation slide is customizable in PowerPoint. The education KPI dashboard PowerPoint template is also compatible with Google Slide so a user can share this template with others via the internet. A user can make changes in the font size, font type, color as well as dimensions of the key performance indicators for schools & education management PPT slide as per the requirement. You may edit the value in the KPI dashboard higher education template as the template get linked with Excel sheet.
-
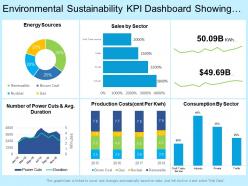 Environmental sustainability kpi dashboard showing total consumption sales energy sources
Presenting this set of slides with name - Environmental Sustainability Kpi Dashboard Showing Total Consumption Sales Energy Sources. This is a six stage process. The stages in this process are Environment Sustainability, Environment Continual, Environment Feasibility.
-
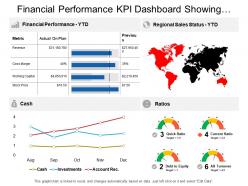 Financial performance kpi dashboard showing regional sales status cash and ratios
Presenting this set of slides with name - Financial Performance Kpi Dashboard Showing Regional Sales Status Cash And Ratios. This is a four stage process. The stages in this process are Financial Performance, Financial Report, Financial Review.
-
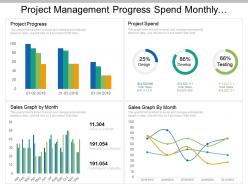 Project management progress spend monthly growth dashboard
Presentation design is easy download and can be changed into other software programs such as JPEG and PDF. Personalize the PowerPoint template with brand name, logo and image. Presentation slide is available with choice to download with different nodes and stages. Completely editable PPT slide can be edited as colors, icons, and text. Easy to present amongst large set of audience as accessible in widescreen view option. PowerPoint graphic can be merged with Google slides as fully compatible with them.
-
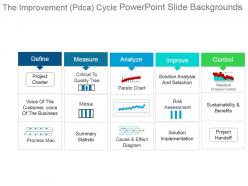 The improvement pdca cycle powerpoint slide backgrounds
Presenting the improvement pdca cycle PPT template. Fully creative and editable PPT slide visual. Modify and personalize the presentation by including the company name and logo. Guidance for executing the changes has been provided for assistance. Useful for sales executives, marketers, business professionals, analysts, strategists, students, teachers, etc. Easily and effortlessly modifiable by any user at any time without even having any specialized knowledge. Compatible with Microsoft office software and the Google slides. Available to be saved in jpg or pdf format.
-
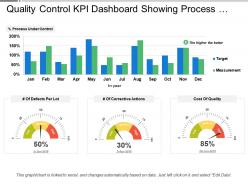 Quality control kpi dashboard showing process under control and cost of quality
Presenting this set of slides with name - Quality Control Kpi Dashboard Showing Process Under Control And Cost Of Quality. This is a four stage process. The stages in this process are Quality Management, Quality Control, Quality Assurance.
-
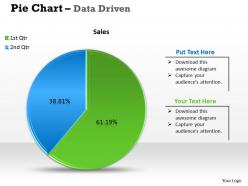 Data driven sales profit pie chart powerpoint slides
We are proud to present our data driven sales profit pie chart powerpoint slides. The above template displays data driven market trends scatter chart.Think outside the box and impress your boss by taking advantage of informative charts to support your recommendations.
-
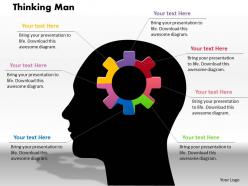 0414 thinking man gear pie chart powerpoint graph
We are proud to present our 0414 thinking man gear pie chart powerpoint graph. Our Thinking Man Gear Pie Chart Powerpoint Graph Powerpoint Templates are like the strings of a tennis racquet. Well strung to help you serve aces. Aesthetically crafted by artistic young minds. Our Thinking Man Gear Pie Chart Powerpoint Graph Powerpoint Templates are designed to display your dexterity.
-
 1214 battery icon with power icons energy technology powerpoint slide
We are proud to present our 1214 battery icon with power icons energy technology powerpoint slide. Graphic of battery icons are used to craft this power point template. This PPT slide contains the concept of energy technology. Use this PPT slide and build an innovative presentation for your viewers.
-
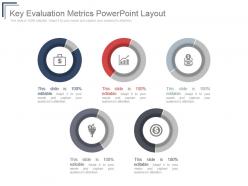 Key evaluation metrics powerpoint layout
Presenting key evaluation metrics powerpoint layout. This is a key evaluation metrics powerpoint layout. This is a five stage process. The stages in this process are icons, business, marketing, presentation, management.
-
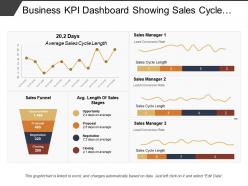 Business kpi dashboard showing sales cycle length and sales funnel
Presenting this set of slides with name - Business Kpi Dashboard Showing Sales Cycle Length And Sales Funnel. This is a three stage process. The stages in this process are Business Dashboard, Business Kpi, Business Performance.
-
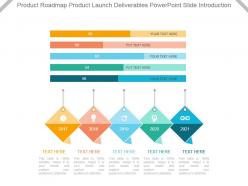 Product roadmap product launch deliverables powerpoint slide introduction
Presenting product roadmap product launch deliverables powerpoint slide introduction. This is a product roadmap product launch deliverables powerpoint slide introduction. This is a five stage process. The stages in this process are business, management, marketing, roadmap, deliverables.
-
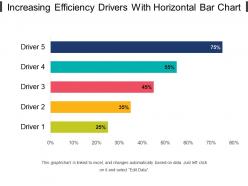 Increasing efficiency drivers with horizontal bar chart
Presenting increasing efficiency drivers with horizontal bar chart. This is a increasing efficiency drivers with horizontal bar chart. This is a five stage process. The stages in this process are increasing efficiency, increasing effectiveness, improving efficiency.
-
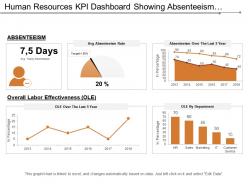 Human resources kpi dashboard showing absenteeism overall labor effectiveness
Presenting this set of slides with name - Human Resources Kpi Dashboard Showing Absenteeism Overall Labor Effectiveness. This is a five stage process. The stages in this process are Human Resource, Hrm, Human Capital.
-
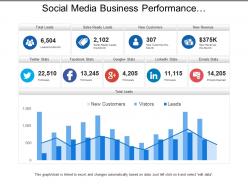 Social media business performance dashboards with total leads
Presenting this set of slides with name - Social Media Business Performance Dashboards With Total Leads. This is a three stage process. The stages in this process are Business Dashboard, Business Kpi, Business Performance.
-
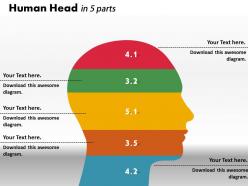 0414 human head ratio bar chart powerpoint graph
Supreme quality PPT presentation layouts. Equipped with high-resolution images and patterns to impress the viewers. Maintains the speed and consistency of the system. Well matched framework with Google. Runs smoothly with all software’s. Downloads easily without any hurdles. Provides error free performance and wraps the presentation session on the scheduled time frame.
-
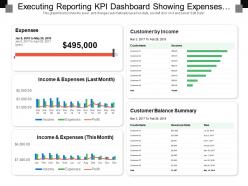 Executing reporting kpi dashboard showing expenses customer by income
Presenting this set of slides with name - Executing Reporting Kpi Dashboard Showing Expenses Customer By Income. This is a five stage process. The stages in this process are Executive Reporting, Executive Analysis, Executive Performance.
-
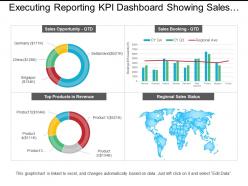 Executing reporting kpi dashboard showing sales opportunity and sales booking
Presenting this set of slides with name - Executing Reporting Kpi Dashboard Showing Sales Opportunity And Sales Booking. This is a four stage process. The stages in this process are Executive Reporting, Executive Analysis, Executive Performance.
-
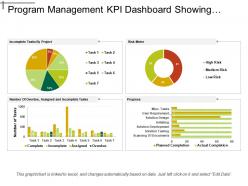 Program management kpi dashboard showing incomplete tasks and risk meter
Presenting this set of slides with name - Program Management Kpi Dashboard Showing Incomplete Tasks And Risk Meter. This is a four stage process. The stages in this process are Program Development, Human Resource Management, Program Management.
-
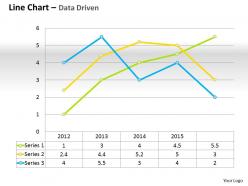 Data driven line chart for business performance powerpoint slides
We are proud to present our data driven line chart for business performance powerpoint slides. Our Data Driven Line Chart For Business Performance Powerpoint Slides Power Point Templates Provide The Perfect Balance. Your Weighty Ideas Will Get The Ideal Impetus. You Can Safely Bank On Our Data Driven Line Chart For Business Performance Powerpoint Slides Power Point Templates. They Will Provide A Growth Factor To Your Valuable Thoughts.
-
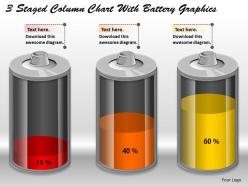 0414 3 staged column chart with battery graphics powerpoint graph
These are exclusively codified PPT design schemes which are quite suitable for business managers, process experts etc. These PPT graphics can be acclimating with divergent software’s and Google slides. These are wonderfully conceived pictorial Presentation templates which can be customizable in to other file formats like PDF or JPG. They have an alterable designs, forms, colors, contents etc. They have an option to add company name or emblems with these PPT templates.
-
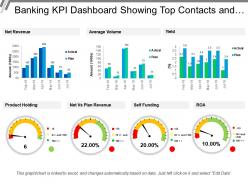 Banking kpi dashboard showing top contacts and client value
Presenting this set of slides with name - Banking Kpi Dashboard Showing Top Contacts And Client Value. This is a three stage process. The stages in this process are Banking, Finance, Money.
-
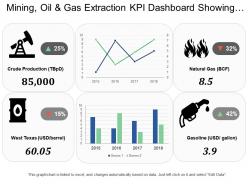 Mining oil and gas extraction kpi dashboard showing crude production and natural gas
Presenting this set of slides with name - Mining Oil And Gas Extraction Kpi Dashboard Showing Crude Production And Natural Gas. This is a four stage process. The stages in this process are Mining, Oil And Gas Extraction, Refinery, Natural Gas.
-
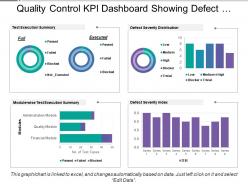 Quality control kpi dashboard showing defect severity distribution
Presenting this set of slides with name - Quality Control Kpi Dashboard Showing Defect Severity Distribution. This is a four stage process. The stages in this process are Quality Management, Quality Control, Quality Assurance.
-
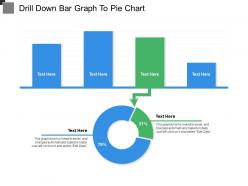 Drill down bar graph to pie chart
Presenting this set of slides with name - Drill Down Bar Graph To Pie Chart. This is a two stage process. The stages in this process are Drill Down, Hierarchy, Top Downwards.
-
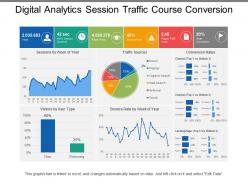 Digital analytics session traffic course conversion
Presenting this set of slides with name - Digital Analytics Session Traffic Course Conversion. This is a five stage process. The stages in this process are Digital Analytics, Digital Dashboard, Digital Kpis.
-
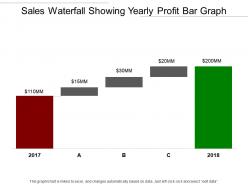 Sales waterfall showing yearly profit bar graph
Presenting this set of slides with name - Sales Waterfall Showing Yearly Profit Bar Graph. This is a five stage process. The stages in this process are Sales Waterfall, Waterfall Chart.
-
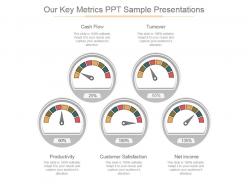 Our key metrics ppt sample presentations
Presenting our key metrics ppt sample presentations. This is a our key metrics ppt sample presentations. This is a five stage process. The stages in this process are cash flow, turnover, net income, customer satisfaction, productivity.
-
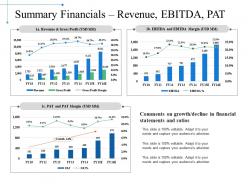 Summary financials revenue ebitda pat powerpoint slide download
Presenting this set of slides with name - Summary Financials Revenue Ebitda Pat Powerpoint Slide Download. This is a four stage process. The stages in this process are Business, Marketing, Finance, Planning, Analysis.
-
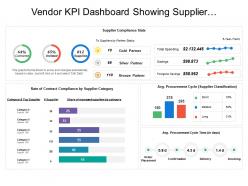 Vendor kpi dashboard showing supplier compliance stats and procurement cycle time
Presenting this set of slides with name - Vendor Kpi Dashboard Showing Supplier Compliance Stats And Procurement Cycle Time. This is a four stage process. The stages in this process are Vendor, Supplier, Retailer.
-
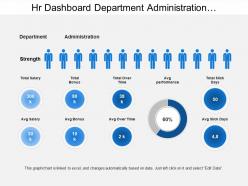 Hr dashboard department administration workforce strength
Presenting this set of slides with name - Hr Dashboard Department Administration Workforce Strength. This is a two stage process. The stages in this process are Hr Dashboard, Human Resource Dashboard, Hr Kpi.
-
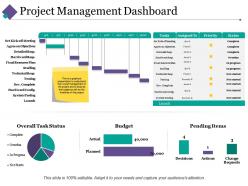 Project management dashboard snapshot ppt pictures infographic template
Displaying project management dashboard snapshot PPT picture infographic template. Alter the design with trade components like name and picture. Presentation slide is well-harmonized with Google slides. Colors and text can be replaced as the PowerPoint graphic comes with easy editing options. Rapid and easy download with saving options. PPT diagram can be viewed in both standard and widescreen display view. Flexible with other software options such as PDF or JPG formats.
-
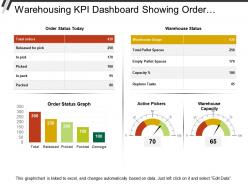 Warehousing kpi dashboard showing order status and active pickers
The design template is compatible with Google Slides and MS PowerPoint software. You can download this design into various formats such as JPEG or PDF format. The warehouse KPI dashboard PPT design template is 100% editable; you can modify and personalize the design according to your business requirements. Design is fully supported on standard and full screen view; no change in design quality on full screen view.
-
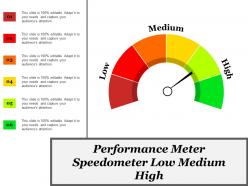 Performance meter speedometer low medium high
Presenting, the performance meter speedometer PowerPoint Presentation Slide. This Presentation has been designed professionally and is fully editable. You can personalize font size, font type, colors, and even the background. This Template is obedient with Google Slide and can be saved in JPG or PDF format without any hassle. Fast download at the click of the button.
-
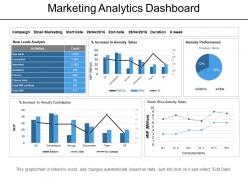 Marketing analytics dashboard powerpoint slide clipart
Presenting Marketing Analytics Assessment PowerPoint Templates. The designs are 100% editable in this PowerPoint template. The font size, font color, graphic colors, and slide background can be customized without any hassle. The users can add or remove the images according to their needs. This template includes one slide which is designed by keeping compatibility with Google Slides in mind. It is available in both standard and widescreen.
-
 Financial ratio kpi dashboard showing liquidity ratio analysis current ratio and quick ratio
Presenting this set of slides with name - Financial Ratio Kpi Dashboard Showing Liquidity Ratio Analysis Current Ratio And Quick Ratio. This is a three stage process. The stages in this process are Accounting Ratio, Financial Statement, Financial Ratio.
-
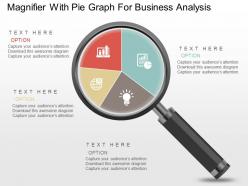 Magnifier with pie graph for business analysis powerpoint slides
Innovatively and expertly crafted PowerPoint slide. Impeccable quality of pictures and images used in the designing. Presentation can be exhibited in both standard and widescreen as pixels don’t break. Easily adjustable into other software programs such as JPG and PDF. Immediate download and easy to share with large set of people. Availability to edit the content as per the industry requirement. PPT slides completely compatible with Google slides.
-
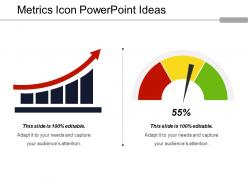 Metrics icon powerpoint ideas
Presenting Metrics Icon PowerPoint Ideas which is completely editable. Can be changed into formats like PDF, JPG, and PNG. The slide is readily available in both 4:3 and 16:9 aspect ratio. The template is compatible with Google Slides, which makes it accessible at once. Modify the colors, fonts, font size, and font types of the template as per the requirements.
-
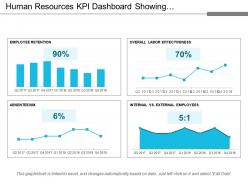 Human resources kpi dashboard showing employee retention absenteeism
Presenting this set of slides with name - Human Resources Kpi Dashboard Showing Employee Retention Absenteeism. This is a four stage process. The stages in this process are Human Resource, Hrm, Human Capital.
-
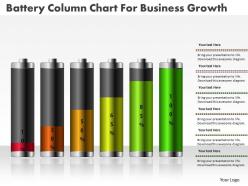 0414 battery column chart for business growth powerpoint graph
High resolution. No fear of image pixilation when projected on wide screen. Impactful, unique and eye catchy visuals. Easy to download. Easy to save in any desired format. Compatible with multiple numbers of software options. Compatible with Google slide, Mac and Windows. Thoroughly editable pre designed slides. Saves time, energy and efforts. Used by students, teachers and business executives.
-
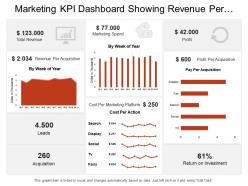 Marketing kpi dashboard showing revenue per acquisition leads speed profit
Presenting this set of slides with name - Marketing Kpi Dashboard Showing Revenue Per Acquisition Leads Speed Profit. This is a three stage process. The stages in this process are Marketing, Branding, Promoting.
-
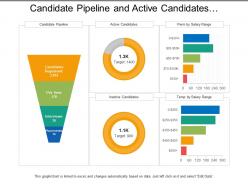 Candidate pipeline and active candidates recruitment dashboard
Presenting this set of slides with name - Candidate Pipeline And Active Candidates Recruitment Dashboard. This is a three stage process. The stages in this process are Staffing Plan, Recruitment, Staff Management.
-
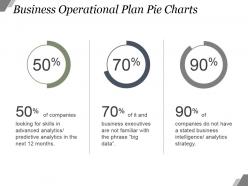 Business operational plan pie charts powerpoint presentation
Presenting business operational plan pie charts powerpoint presentation. This is a business operational plan pie charts powerpoint presentation. This is a three stage process. The stages in this process are business, operation, plan, percentage, financial.
-
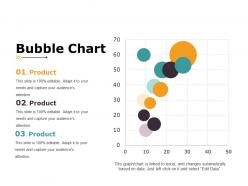 Bubble chart presentation examples
Presenting bubble chart presentation examples. This is a bubble chart presentation examples. This is a four stage process. The stages in this process are business, marketing product, management.
-
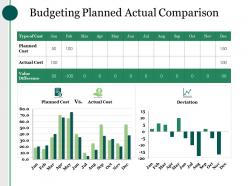 Budgeting planned actual comparison powerpoint guide
Presenting this set of slides with name - Budgeting Planned Actual Comparison Powerpoint Guide. This is a three stage process. The stages in this process are Type Of Cost, Planned Cost, Actual Cost, Value Difference, Deviation.
-
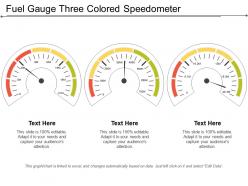 Fuel gauge three colored speedometer
Presenting this set of slides with name - Fuel Gauge Three Colored Speedometer. This is a three stage process. The stages in this process are Fuel Gauge, Gas Gauge, Fuel Containers.
-
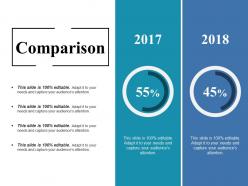 Comparison ppt good
Presenting this set of slides with name - Comparison Ppt Good. This is a two stage process. The stages in this process are Comparison, Years, Percentage, Business, Finance.
-
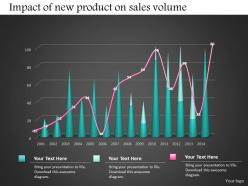 0414 sales volume column and line chart powerpoint graph
High resolution images do not pixelate when projected on wide screen. Personalize the PPT with your company name and logo. Modify the presentation elements as per the need of an hour. Compatible with numerous software and format options. Used by entrepreneurs, marketers, managerial department, stakeholders and students. Self-explanatory and intellectual slide charts. Access to edit the content, style, size and orientation of the PPT slides.
-
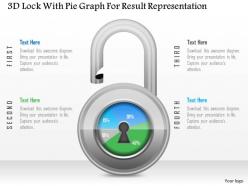 1214 3d lock with pie graph for result representation powerpoint slide
Professional and business oriented PowerPoint presentation design. Modify and personalize the presentation by inserting company name, logo and design. Information about the use of the slide is provided. Easy and smooth downloading by following the steps. No compromise with the quality as can be presented even on wide screen. Editable visuals, colors and shape. Useful for sales administrators, marketing professionals, business executives etc.
-
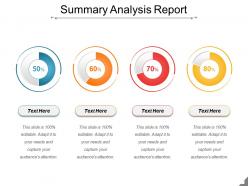 Summary analysis report presentation powerpoint example
Presenting Summary Analysis Report Presentation PowerPoint Example. It is fully editable in PowerPoint and the slide can be modified as per your requirements. Edit the fonts, colors and slide background. When you download the presentation, you get the PPT files in both widescreen (16:9) and standard screen (4:3) aspect ratio. Our presentation is compatible with Google Slides and can be saved in JPG or PDF format. Get this template with high resolution graphics and deliver presentations in no time.
-
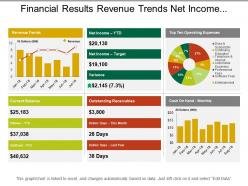 Financial results revenue trends net income cash on hand layout
Presenting financial results revenue trends net income cash on hand layout. Change PowerPoint structure, font, text, color and design as per your requirements. Easy to input data with excel linked charts, just right to click to input data. This presentation theme is totally attuned with Google slide. Easy conversion to other software’s like JPG and PDF formats. Image quality of these PPT diagram remains the unchanged even when you resize the image or portray on large screens.
-
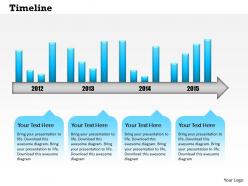 0514 annual data driven time line diagram powerpoint slides
Can be used by businessmen, sales, marketing and managers in the company. Filling background in a different color from the text is additional supportive feature of PPT layout. All images are 100% editable in the presentation slide. Presentation icon supports changing the color, size and orientation of any icon to your liking. Featured proofing and editing is supported in presentation slide show. Smooth functioning is ensured by the presentation slide show on all software’s.
-
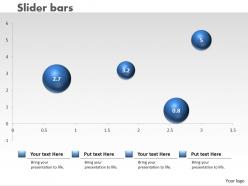 0414 bubble chart to present business data powerpoint graph
We are proud to present our 0414 bubble chart to present business data powerpoint graph. Brilliant backdrops are the essence of our 0414 Bubble Chart To Present Business Data Powerpoint Graph Powerpoint Templates. Guaranteed to illuminate the minds of your audience. Our 0414 Bubble Chart To Present Business Data Powerpoint Graph Powerpoint Templates are conceived by a dedicated team. Use them and give form to your wondrous ideas.


