- Sub Categories
-
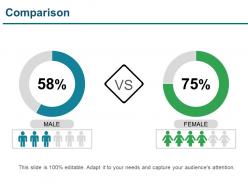 Comparison presentation powerpoint templates
Presenting our Comparison Presentation PowerPoint Templates. This PPT theme is available in both 4:3 and 16:9 aspect ratios. Choose this PPT graphic to display apt and suitable comparative graphs, charts, and images. This PPT layout is 100% adaptable allowing you to modify the font, color, font size, and shapes. This PPT presentation is also Google Slides compatible making it easily accessible. Without further ado, click the download button!
-
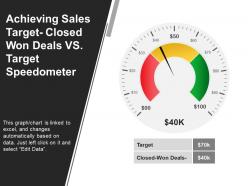 Achieving sales target closed won deals vs target speedometer ppt design
This sales target achievement presentation PPT template can be downloaded and converted into JPEG and PDF formats. You can change font type, size, color, shape, style, background according to your business preferences. Design allows full editing. PPT is fully compatible with Google Slides and MS PowerPoint software. Both normal and full screen design views are available. No change in the design quality even when viewed in full screen.
-
 New business journey ppt slide
Presenting New Business Journey PPT Slide. Individualize this PPT layout as per your requirements. You are free to change anything in this PPT slide. The colors, the font type, font size, and the background, everything is under your control. We offer you a high-resolution graphics template that is entirely compatible with Google Slides. Convert and save this slide in various formats, including JPG and PDF formats. Download this slide design in 2 screen sizes i.e., standard screen and widescreen.
-
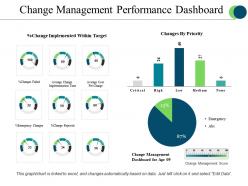 Change management performance dashboard powerpoint slide designs
Presenting change management performance dashboard powerpoint slide designs. This is a change management performance dashboard powerpoint slide designs. This is a three stage process. The stages in this process are critical, high, low, medium, none.
-
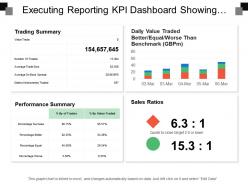 Executing reporting kpi dashboard showing trading summary performance summary and sales ratio
Presenting this set of slides with name - Executing Reporting Kpi Dashboard Showing Trading Summary Performance Summary And Sales Ratio. This is a four stage process. The stages in this process are Executive Reporting, Executive Analysis, Executive Performance.
-
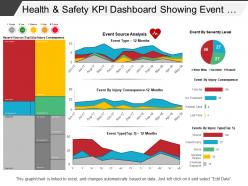 Health and safety kpi dashboard showing event source analysis
Presenting the colorful dashboard presentation layout. This modern dashboard design is fully editable and is created under the strict supervision of professionals. You can bring changes to the objects in the slide like font size and font color hassle-free. This presentation slide is fully compatible with Google Slide and can be saved in JPG or PDF file format without any hassle. Fast download this at the click of the button.
-
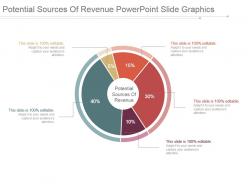 Potential sources of revenue powerpoint slide graphics
Presenting potential sources of revenue powerpoint slide graphics. This is a potential sources of revenue powerpoint slide graphics. This is a five stage process. The stages in this process are potential sources of revenue.
-
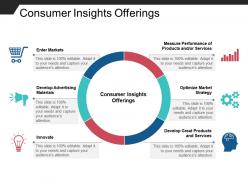 Consumer insights offerings
Presenting this Consumer Insights Offerings PowerPoint presentation. The slide is 100% adaptable in PowerPoint and compatible with Google Slides. Modify the font style, font color, and other components with ease. Convert this template into common document or image formats such as PDF or JPEG. High-quality graphics always ensure that quality is not affected.
-
 Comparison ppt icon examples
Presenting this set of slides with name - Comparison Ppt Icon Examples. This is a two stage process. The stages in this process are Business, Marketing, Male, Female, Comparison, Percentage.
-
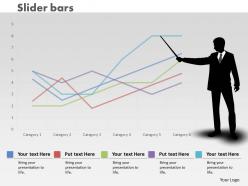 0414 man illustrating slider line chart powerpoint graph
We are proud to present our 0414 man illustrating slider line chart powerpoint graph. Our Man Illustrating Slider Line Chart Powerpoint Graph Powerpoint Templates give good value for money. They also have respect for the value of your time. Take a leap off the starting blocks with our Man Illustrating Slider Line Chart Powerpoint Graph Powerpoint Templates. They will put you ahead of the competition in quick time.
-
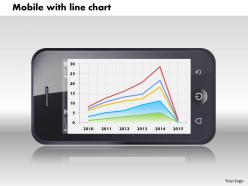 0414 mobile with line chart display powerpoint graph
Scrupulously collected PowerPoint slides having swift downloading procedure, Comfortably tractable into different arrangements like PDF or JPG, Quite Simple to add your titles or subtitles in the PPT templates, Restructure able subject matter, forms, source etc. of the PowerPoint images, Furnished well with all Google slides and other system program also, Lively Presentation graphic designs beneficial for business investors, business managers and management professionals and business analysts etc.
-
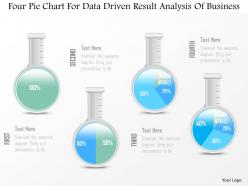 1214 four pie chart for data driven result analysis of business powerpoint slide
We are proud to present our 1214 four pie chart for data driven result analysis of business powerpoint slide. This Power Point template has been crafted with graphic of four pie charts. This PPT slide contains the concept of data driven result analysis. Use this PPT slide for your business and marketing related presentations.
-
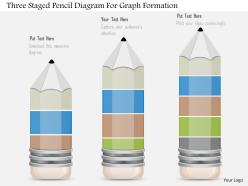 1214 three staged pencil diagram for graph formation powerpoint slide
We are proud to present our 1214 three staged pencil diagram for graph formation powerpoint slide. Three staged pencil diagram has been used to craft this power point template slide. This PPT contains the concept of graph formation. This PPT slide is usable for education and business related presentations.
-
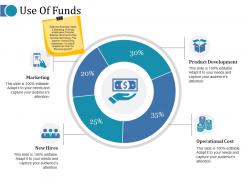 Use of funds ppt layouts slide download
Presenting this set of slides with name - Use Of Funds Ppt Layouts Slide Download. This is a four stage process. The stages in this process are Marketing, New Hires, Operational Cost, Product Development.
-
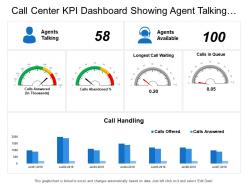 Call center kpi dashboard showing agent talking longest call waiting call handling
Presenting this set of slides with name - Call Center Kpi Dashboard Showing Agent Talking Longest Call Waiting Call Handling. This is a five stage process. The stages in this process are Call Center Agent, Customer Care, Client Support.
-
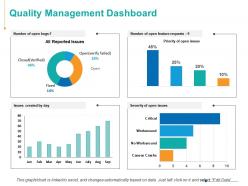 Quality management dashboard marketing ppt powerpoint presentation infographics skills
Presenting this set of slides with name - Quality Management Dashboard Marketing Ppt Powerpoint Presentation Infographics Skills. This is a four stage process. The stages in this process are Finance, Analysis, Business, Investment, Marketing.
-
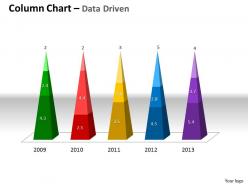 Data driven 3d business changes with time powerpoint slides
We are proud to present our data driven 3d business changes with time powerpoint slides. A bar graph is composed of discrete bars that represent different categories of data. The length or height of the bar is equal to the quantity within that category of data. Bar graphs are best used to compare values across categories.
-
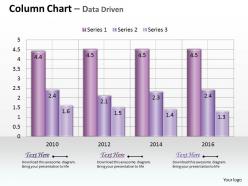 Data driven sets of business information powerpoint slides
We are proud to present our data driven sets of business information powerpoint slides. Use this PowerPoint chart to display business information. It gets easier to understand and interpret the data. This PowerPoint diagram allows you to present information in an intelligent and meaningful manner.
-
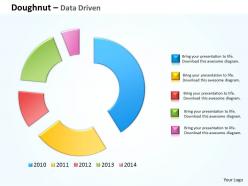 Data driven compare market share of brand powerpoint slides
We are proud to present our data driven compare market share of brand powerpoint slides. Be The Star Of The Show With Our Data Driven Compare Market Share Of Brand Powerpoint Slides Power Point Templates. Rock The Stage With Your Ideas. Break Through With Our Data Driven Compare Market Share Of Brand Powerpoint Slides Power Point Templates. Bring Down The Mental Barriers Of Your Audience.
-
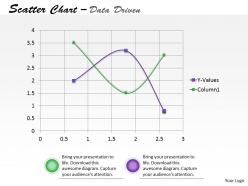 Data driven scatter chart to predict future movements powerpoint slides
We are proud to present our data driven scatter chart to predict future movements powerpoint slides. Timeline Crunches Are A Fact Of Life. Meet All Deadlines Using Our Data Driven Scatter Chart To Predict Future Movements Powerpoint slides Power Point Templates. Connect The Dots Using Our Data Driven Scatter Chart To Predict Future Movements Powerpoint slides Power Point Templates. Fan Expectations As The Whole Picture Emerges.
-
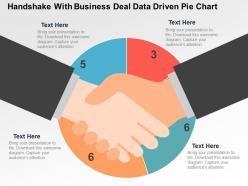 Handshake with business deal data driven pie chart powerpoint slides
We are proud to present our handshake with business deal data driven pie chart powerpoint slides. Graphic of handshake and pie chart has been used to design this power point template diagram. This PPT diagram contains the concept of data driven business deal and analysis. Use this PPT diagram for business and finance related presentations.
-
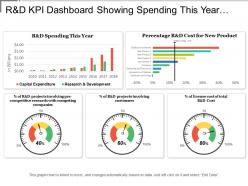 R and d kpi dashboard showing spending this year and cost for new product
Presenting this set of slides with name - R And D Kpi Dashboard Showing Spending This Year And Cost For New Product. This is a five stage process. The stages in this process are R And D, Research And Development, Research And Technological Development.
-
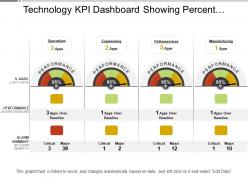 Technology kpi dashboard showing percent availability and performance
Displaying Technology KPI dashboard percent availability PowerPoint design. Colors and text can be easily changed as the PPT slide is completely editable. Modify the design with brand name and logo. Presentation diagram is available both Standard and Widescreen slide. Fast and easy download with saving options. Adaptable with other software’s such as PDF or JPG formats. PowerPoint graphic is fully compatible with Google slides as can be merged with them accordingly.
-
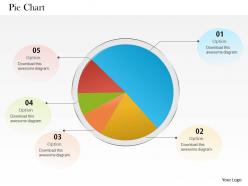 0514 5 staged data driven pie chart powerpoint slides
Proofing and editing can be done with ease in PPT design. Presentation slide is of utmost use to management professionals, big or small organizations and business startups. Smooth functioning is ensured by the presentation slide show on all software’s. When projected on the wide screen the PPT layout does not sacrifice on pixels or color resolution. Best feature being the conversion of presentation slide show to PDF or JPG format.
-
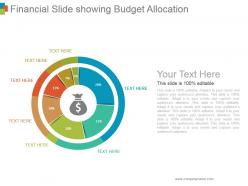 Financial slide showing budget allocation ppt background
Presenting financial slide showing budget allocation ppt background. This is a financial slide showing budget allocation ppt background. This is a seven stage process. The stages in this process are circular, process, percentage, financial, budget.
-
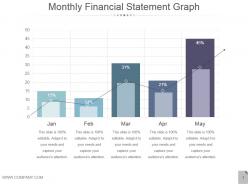 Monthly financial statement graph ppt examples slides
Presenting monthly financial statement graph ppt examples slides. This is a monthly financial statement graph ppt examples slides. This is a two stage process. The stages in this process are jan, feb, mar, apr, may.
-
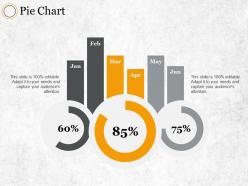 Pie chart ppt professional graphics download
Presenting this set of slides with name - Pie Chart Ppt Professional Graphics Download. This is a three stage process. The stages in this process are Product, Percentage, Business, Marketing, Management.
-
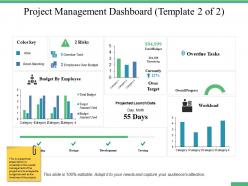 Project management dashboard snapshot ppt professional graphic images
Presenting this set of slides with name - Project Management Dashboard Snapshot Ppt Professional Graphic Images. This is a four stage process. The stages in this process are Percentage, Product, Management, Marketing, Business.
-
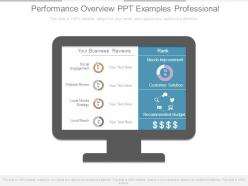 Performance overview ppt examples professional
Presenting performance overview ppt examples professional. This is a performance overview ppt examples professional. This is a one stage process. The stages in this process are social engagement, website review, local mobile strategy, local reach, your business, reviews, rank, needs improvement, customer solution, recommended budget.
-
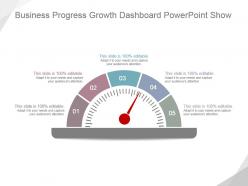 Business progress growth dashboard powerpoint show
Presenting business progress growth dashboard powerpoint show. This is a business progress growth dashboard powerpoint show. This is a five stage process. The stages in this process are business, marketing, dashboard, measure, management.
-
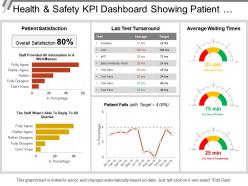 Health and safety kpi dashboard showing patient satisfaction and lab test turnaround
Presenting this set of slides with name - Health And Safety Kpi Dashboard Showing Patient Satisfaction And Lab Test Turnaround. This is a five stage process. The stages in this process are Health And Safety, Health And Security, Health And Protection.
-
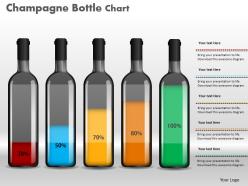 0414 champagne bottle column chart for data diaplay powerpoint graph
Employ slides in numerous software smoothly and coherently. Trouble-free download and use of slide. Company logo, trademark or name can be appended for extra accuracy and specificity. PPT graphics never pixelate when projected on widescreen displays. PowerPoint Slides quite compatible with google slides. Insert more titles and sub titles without space constraints. High resolution PPT slides for clarity. Highly alterable layout including font, text, color and design.
-
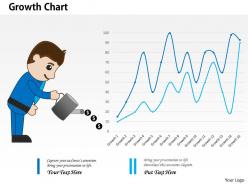 0514 unique financial growth chart powerpoint slides
Runs jitter free and smoothly on all compatible software. PowerPoint images exhibit sharp resolution. When projected on widescreen, the Presentation graphics never pixelate. Hassle-free download of PPT slides. Further customize slide by appending your company’s logo, trademark. Add and employ titles and sub titles at will with no space constraints. Compatible with Google slides. Useful for strategic firms engaged in intense data analysis, technical startups, businesses, project management, educational colleges and universities teaching economics, management and statistics and many more.
-
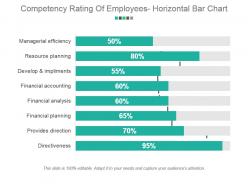 Competency rating of employees horizontal bar chart sample ppt presentation
Presenting competency rating of employees horizontal bar chart sample ppt presentation. This is a competency rating of employees horizontal bar chart sample ppt presentation. This is a eight stage process. The stages in this process are managerial efficiency, resource planning, develop and implements, financial accounting, financial analysis, financial planning, provides direction, directiveness.
-
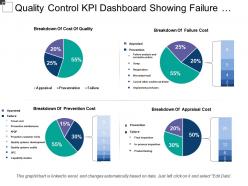 Quality control kpi dashboard showing failure and prevention cost
Presenting this set of slides with name - Quality Control Kpi Dashboard Showing Failure And Prevention Cost. This is a four stage process. The stages in this process are Quality Management, Quality Control, Quality Assurance.
-
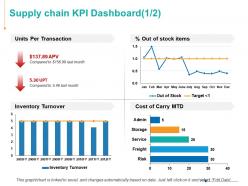 Supply chain kpi dashboard ppt powerpoint presentation infographics grid
Presenting this set of slides with name - Supply Chain KPI Dashboard Ppt Powerpoint Presentation Infographics Grid. This is a four stage process. The stages in this process are Inventory Turnover, Service, Marketing, Analysis, Investment.
-
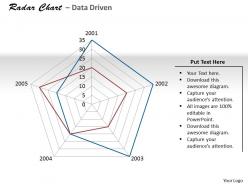 Data driven rader chart for rating items powerpoint slides
We are proud to present our data driven rader chart for rating items powerpoint slides. The purpose of this data driven radar chart is to compare options across parameters so that audience can be convinced. Your boss will appreciate the visual representation of the business components by this diagram.
-
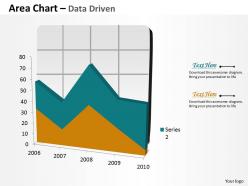 Data driven 3d area chart for business process powerpoint slides
We are proud to present our data driven 3d area chart for business process powerpoint slides. Our Data Driven 3D Area Chart For Business Process Powerpoint slides Power Point Templates Are Topically Designed To Provide An Attractive Backdrop To Any Subject. Use Them To Look Like A Presentation Pro. Use Our Data Driven 3D Area Chart For Business Process Powerpoint slides Power Point Templates To Effectively Help You Save Your Valuable Time. They Are Readymade To Fit Into Any Presentation Structure.
-
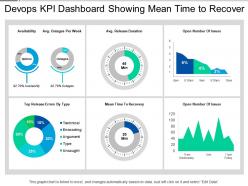 Devops kpi dashboard showing mean time to recover
Presenting this set of slides with name - Devops Kpi Dashboard Showing Mean Time To Recover. This is a six stage process. The stages in this process are Development And Operations, Devops.
-
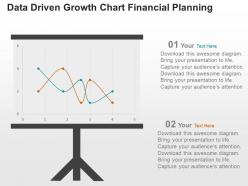 Data driven growth chart financial planning powerpoint slides
Basic theme yet it can modified with respect to font, color and layout. Attractive and professional color scheme. Presentation graphic offers font size which can be read from a distance. High resolution is offered by the presentation slide show. Easy to download and instant use of pre designed PPT layout adds to its advantage. High color resolution offered by PPT. Beneficial for businessmen, project managers for business and financial accounting purposes.
-
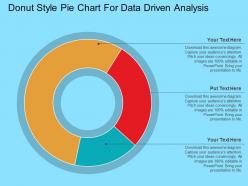 Donut style pie chart for data driven analysis powerpoint slides
Organized slide pie diagram is totally variable. Downloading design in any configuration choices like JPEG, JPG or PDF is straightforward and lively. Provide a star point of view to your organization slides. Highly clear with Google slides. Symbols are in like way being joined. Editing of substance, portrayal, diagrams, and substance as showed up by your hurting and need. Visuals don't dark when exposed on widescreen.
-
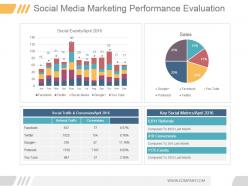 Social media marketing performance evaluation ppt diagrams
Presenting social media marketing performance evaluation ppt diagrams. This is a social media marketing performance evaluation ppt diagrams. This is a four stage process. The stages in this process are social event april, facebook, twitter, social media, google, you tube, jan, feb, mar, apr, may, jun, jul, aug, sep, oct, nov, dec, social traffic and conversion april 2016, referral traffic, conversions, pinterest, sales, key social metrics april 2016, referral traffic, conversions, pinterest, sales, key social metrics april, referrals, compared to 4655 last month, conversions, compared to 354 last month, events, compared to 1052 last month.
-
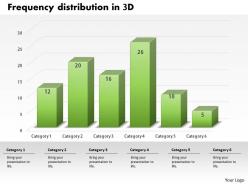 0414 frequency distribution in 3d column chart powerpoint graph
Use of high-resolution and quality images. Trouble free insertion of the brand logo or name in the background. Adjustable style, size and orientation of the slide charts. Open without any risk on wide screen. Use perfectly with Google slides and other Microsoft office software. 100% editing of the slide charts, colors, text, etc. Used by the business professionals, marketing people and management students.
-
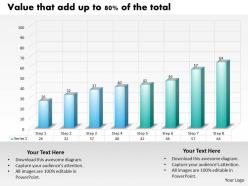 0414 progress in 8 steps column chart powerpoint graph
Runs very well with softwares and is compatible with Google slides. Easy to download and consumes less space. Company’s name logo and trademark can be inserted. Picture graphics do not pixilate even when shown on a bigger screen. No space constraints while mentioning titles and sub-titles. Changeable orientation, font text, design and color. Convertible into PDF and JPEG. Useful for professionals preparing any progress related presentation.
-
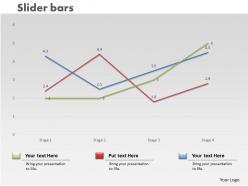 0414 slider line chart trend series powerpoint graph
We are proud to present our 0414 slider line chart trend series powerpoint graph. Our Slider Line Chart Trend Series Powerpoint Graph Powerpoint Templates provide the skeleton of your presentation. Flesh them out with your weighty ideas. Our Slider Line Chart Trend Series Powerpoint Graph Powerpoint Templates are the sinews of your lecture. Give them the muscle of your vibrant thoughts.
-
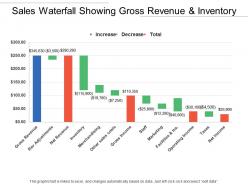 Sales waterfall showing gross revenue and inventory
Presenting this set of slides with name - Sales Waterfall Showing Gross Revenue And Inventory. This is a thirteen stage process. The stages in this process are Sales Waterfall, Waterfall Chart.
-
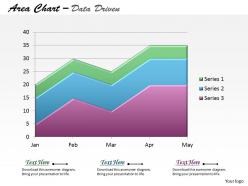 Data driven stacked area chart powerpoint slides
We are proud to present our data driven stacked area chart powerpoint slides. Let Our Data Driven Stacked Area Chart Powerpoint slides Power Point Templates Mark The Footprints Of Your Journey. Illustrate How They Will Lead You To Your Desired Destination. Conjure Up Grand Ideas With Our Magical Data Driven Stacked Area Chart Powerpoint slides Power Point Templates. Leave Everyone Awestruck By The End Of Your Presentation.
-
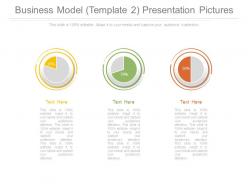 Business model template 2 presentation pictures
Presenting business model template 2 presentation pictures. This is a business model template 2 presentation pictures. This is a three stage process. The stages in this process are business, percentage, marketing, success, strategy.
-
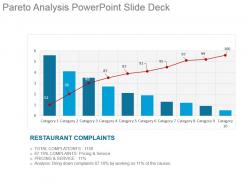 Pareto analysis powerpoint slide deck
Presenting pareto analysis powerpoint slide deck. This is a pareto analysis powerpoint slide deck. This is a ten stage process. The stages in this process are restaurant complaints, total complaints, complaints pricing and service, pricing and service, analysis bring down complaints, category.
-
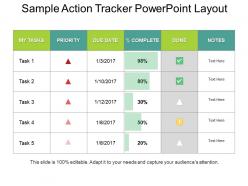 Sample action tracker powerpoint layout
Presenting a PPT template named Sample Action Tracker PowerPoint Layout. You can completely edit this slide as per your requirements. The font color, font size, font style, background color, and the color of the diagram are all editable and can be changed. The dummy text in the slide can be rewritten. A collection of editable and high-quality icons ensure better design for your presentation. Choose from an array of these icons to enhance your presentation. The slide is compatible with Google Slides and can be saved in both JPG and PDF formats.
-
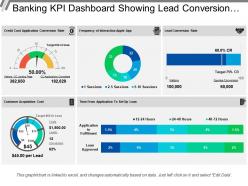 Banking kpi dashboard showing lead conversion and acquisition cost
Presenting this set of slides with name - Banking Kpi Dashboard Showing Lead Conversion And Acquisition Cost. This is a five stage process. The stages in this process are Banking, Finance, Money.
-
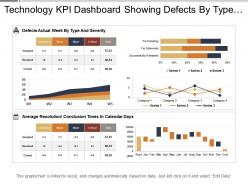 Technology kpi dashboard showing defects by type and severity
Presenting this set of slides with name - Technology Kpi Dashboard Showing Defects By Type And Severity. This is a six stage process. The stages in this process are Technology, IT, IOT.
-
 Warehousing kpi dashboard showing stock value and dispatched items
This storage KPI dashboard PPT design is completely editable; you can modify and personalize the design as per your business needs; include business logo and trademark to look PPT more authentic, put your business warehousing figures in excel and linked charts in design will get updated automatically. You can download the design into JPEG or PDF formats; easy and swift downloading available. Design is compatible with Google Slides and MS PowerPoint software.
-
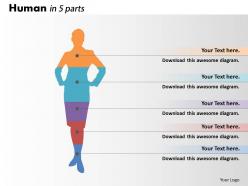 0414 human parts column chart design powerpoint graph
Displays the vitality of body language by utilizing lively graphics and icons. Visually appealing PPT presentation diagrams. Grabs the viewers’ attention easily. Provides pre-defined guidelines for making any changes in these patterns to match the business needs. Allows insertion of business trademark, logos and names. Can be viewed on huge screens for better vision and clarity.
-
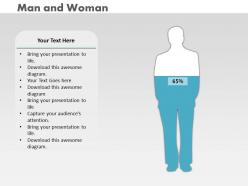 0414 man woman perecntage column chart powerpoint graph
Hastily volatile shades, context, fonts, forms of PPT images, Dynamic PPT design in vector formats which can be exportable in to divergent forms like PDF or JPG, , Refurbish able Presentation graphics which is quite compatible with Google slides and other software’s applications, simply add relevant title or subtitles also, quite beneficial for social educationalists and scholars etc. Runs efficiently with all other software’s applications and all Google slides.
-
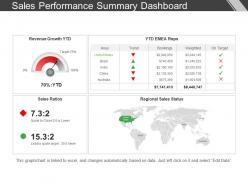 Sales performance summary dashboard snapshot presentation outline
Presenting sales performance summary dashboard snapshot presentation outline PPT slide. High-resolution slide design visuals. No fear of image pixelation when projected on a wide screen. It has compatibility with numerous software options available both online and offline. It is compatible with numerous format options. Ease of customization and personalization. Ease of editing in color and orientation of the slide visual. There is freedom to add the company logo, name and trademark as part of personalization. Thoroughly used by business professionals, students and teachers as part of their presentation.
-
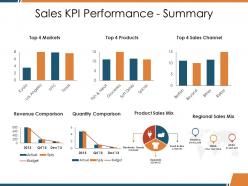 Sales kpi performance summary ppt template
Presenting this set of slides with name - Sales Kpi Performance Summary Ppt Template. This is a six stage process. The stages in this process are Revenue Comparison, Quantity Comparison, Product Sales Mix, Regional Sales Mix, Sales Channel.
-
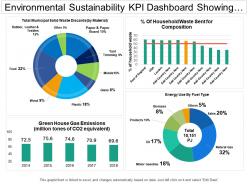 Environmental sustainability kpi dashboard showing municipal solid waste discard
Presenting this set of slides with name - Environmental Sustainability Kpi Dashboard Showing Municipal Solid Waste Discard. This is a four stage process. The stages in this process are Environment Sustainability, Environment Continual, Environment Feasibility.
-
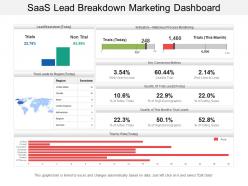 Saas lead breakdown marketing dashboard
Presenting this set of slides with name - Saas Lead Breakdown Marketing Dashboard. Stunning Saas lead breakdown marketing dashboard PPT template. Download is rapid and can be displayed in widescreen view mode also. 100% editable PPT designs as completely modifiable such as icons, text, colors, etc. Effortlessly convertible into JPEG and PDF file formats. Top quality and creative PowerPoint slide design. Adjustable presentation graphic as compatible with Google slides. Perfect for sales executives, marketers, business professionals, analysts, strategists, students, teachers, etc. Information on making the changes has been provided for your provision.
-
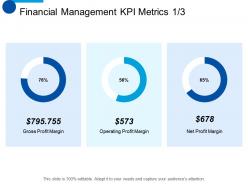 Financial management kpi metrics strategy ppt visual aids infographic template
Presenting this set of slides with name - Financial Management KPI Metrics Strategy Ppt Visual Aids Infographic Template. This is a three stage process. The stages in this process are Gross Profit Margin, Net Profit Margin, Operating Profit Margin, Finance, Planning.


