- Sub Categories
-
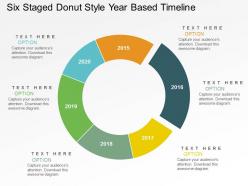 Six staged donut style year based timeline powerpoint slides
High resolution PPT example for timeline to identify sales growth. Increase the level of personalization with your company logo and name. Compatible with all software and can be saved in any format. Useful tool for business analysts, sales people, sales managers and professionals of any industry. Precise and easy to comprehend information on PPT sample. Wide screen projection does not affect the output adversely.
-
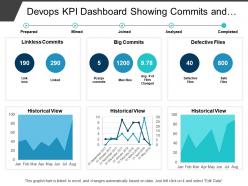 Devops kpi dashboard showing commits and defective files
Presenting this set of slides with name - Devops Kpi Dashboard Showing Commits And Defective Files. This is a six stage process. The stages in this process are Development And Operations, Devops.
-
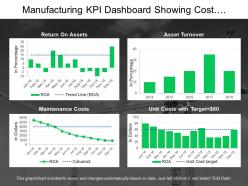 Manufacturing kpi dashboard showing cost management and asset turnover
Presenting this set of slides with name - Manufacturing Kpi Dashboard Showing Cost Management And Asset Turnover. This is a four stage process. The stages in this process are Manufacturing, Production, Manufacture.
-
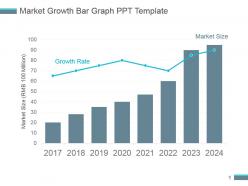 Market growth bar graph ppt template
Presenting market growth bar graph ppt template. This is a market growth bar graph ppt template. This is a eight stage process. The stages in this process are market size, growth rate.
-
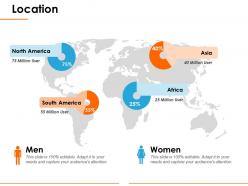 Location ppt rules
Presenting location PPT template. This world map template for PowerPoint is fully editable and is designed by professionals. You can easily customize the objects in the slide like font size and font color. This presentation slide is fully compatible with Google Slide and can be saved in JPG or PDF file format easily. Download this fast at the click of a button.
-
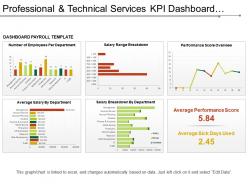 Professional and technical services kpi dashboard showing payroll services
Presenting this set of slides with name - Professional And Technical Services Kpi Dashboard Showing Payroll Services. This is a six stage process. The stages in this process are Professional And Technical Services, Services Management, Technical Management.
-
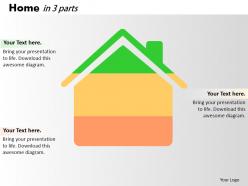 0414 business bar chart home illustration powerpoint graph
We are proud to present our 0414 business bar chart home illustration powerpoint graph. Use our 0414 Business Bar Chart Home Illustration Powerpoint Graph Powerpoint Templates to weave a web of your great ideas. They are guaranteed to attract even the most critical of your colleagues. Our 0414 Business Bar Chart Home Illustration Powerpoint Graph Powerpoint Templates are designed to help you succeed. They have all the ingredients you need.
-
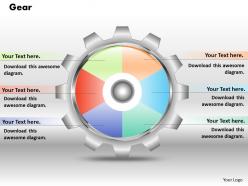 0414 gears pie chart marketing layout powerpoint graph
We are proud to present our 0414 gears pie chart marketing layout powerpoint graph. Our Gears Pie Chart Marketing Layout Powerpoint Graph Powerpoint Templates are created with admirable insight. Use them and give your group a sense of your logical mind. Use our Gears Pie Chart Marketing Layout Powerpoint Graph Powerpoint Templates to bullet point your ideas. See them fall into place one by one.
-
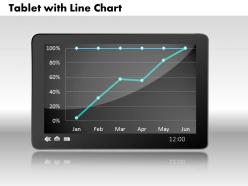 0414 tablate with line chart powerpoint graph
We are proud to present our 0414 tablate with line chart powerpoint graph. Our Tablate With Line Chart Powerpoint Graph Powerpoint Templates provide the pitch to bowl on. Mesmerise your audience with your guile. Our Tablate With Line Chart Powerpoint Graph Powerpoint Templates are stepping stones to success. Climb them steadily and reach the top.
-
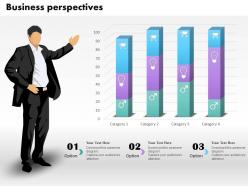 0514 3d business prospective data driven chat powerpoint slides
Well Spruced Presentation graphics, All features like contents, themes, symbols can be manually alterable, PPT templates can be exportable into diverse file structures such as PDF or JPG, Well pertinent for the management students and other business and marketing professionals, Sufficient room available to reinstate the dummy Presentation design data and to add sufficient title or subtitles, easily compatible with all Google slides.
-
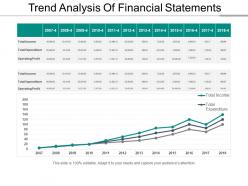 Trend analysis of financial statements powerpoint layout
Presenting a PowerPoint slide named Trend Analysis of Financial Statements PowerPoint Layout. This template with high-quality graphics is completely editable and professionally designed. With an option to change the size, style, and color of the font, this slide is ready to use. You can customize the text and color of the diagram as well as the background as per your discretion. The PPT slide is compatible with Google Slides, which makes it easily accessible. You can customize and save the file as JPG or PDF formats. Once the graph is linked to excel, it automatically changes based on the data.
-
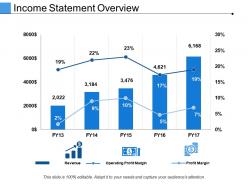 Income statement overview presentation portfolio
Presenting this set of slides with name - Income Statement Overview Presentation Portfolio. This is a five stage process. The stages in this process are Finance, Marketing, Bar, Planning, Growth.
-
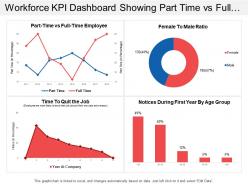 Workforce kpi dashboard showing part time vs full time employee
Presenting this set of slides with name - Workforce Kpi Dashboard Showing Part Time Vs Full Time Employee. This is a four stage process. The stages in this process are Staff, Personnel, Workforce.
-
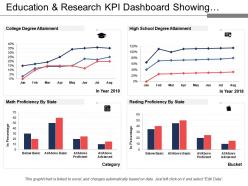 Education and research kpi dashboard showing degree attainment and proficiency
Presenting education and research KPI dashboard showing degree attainment and proficiency PPT slide. The educational degree attainment KPI report presentation slide designed by the professional team of SlideTeam. The education population analysis PPT template is fully editable in PowerPoint. The research status KPI report presentation template is compatible with Google Slide so a user can share this degree attainment metric dashboard slide with others. A user can make changes in the font size, font type, color as well as dimensions of the proficiency KPI dashboard PPT slide as per the requirement. You may edit the value in the education proficiency report slide as the slide gets linked with the Excel sheet.
-
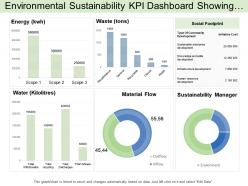 Environmental sustainability kpi dashboard showing social footprint and supply chain category
Presenting this set of slides with name - Environmental Sustainability Kpi Dashboard Showing Social Footprint And Supply Chain Category. This is a six stage process. The stages in this process are Environment Sustainability, Environment Continual, Environment Feasibility.
-
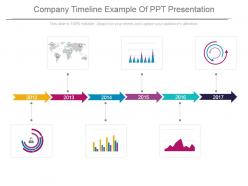 Company timeline example of ppt presentation
Presenting company timeline example of ppt presentation. This is a company timeline example of ppt presentation. This is a six stage process. The stages in this process are arrow, business, process, marketing, success, planning.
-
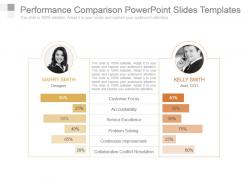 Performance comparison powerpoint slides templates
Presenting performance comparison powerpoint slides templates. This is a performance comparison powerpoint slides templates. This is a two stage process. The stages in this process are customer focus, accountability, service excellence, problem solving, continuous improvement, collaborative conflict resolution.
-
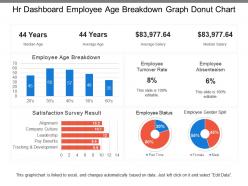 Hr dashboard employee age breakdown graph donut chart
Presenting this set of slides with name - Hr Dashboard Employee Age Breakdown Graph Donut Chart. This is a four stage process. The stages in this process are Hr Dashboard, Human Resource Dashboard, Hr Kpi.
-
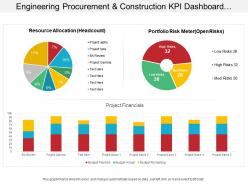 Engineering procurement and construction kpi dashboard having project financials and resource allocation
Presenting this set of slides with name - Engineering Procurement And Construction Kpi Dashboard Having Project Financials And Resource Allocation. This is a three stage process. The stages in this process are Engineering, Procurement And Construction, Construction Management, Engineering, Purchasing And Construction .
-
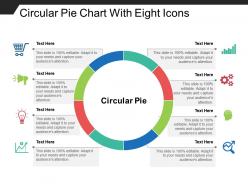 Circular pie chart with eight icons
Presenting circular pie chart with eight icons. This is a circular pie chart with eight icons. This is a eight stage process. The stages in this process are customer insight, consumer insight, customer experience.
-
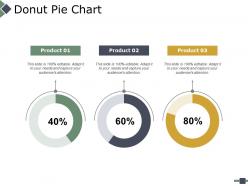 Donut pie chart ppt powerpoint presentation file infographics
Presenting this set of slides with name - Donut Pie Chart Ppt Powerpoint Presentation File Infographics. This is a three stage process. The stages in this process are Percentage, Product, Business, Management, Marketing.
-
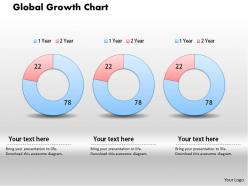 0414 global growth donut chart powerpoint graph
Straightforward download in quick and easy steps. Insert text to as per to the context without constraint on word length. High resolution PPT icons with fully modifiable size, color scheme and orientation. Add your company logo, trademark, tagline etc. for personalization. Project on wide screen without pixelation. Perfectly compatible with Google slides and easily convertible to PDF or JPG formats.
-
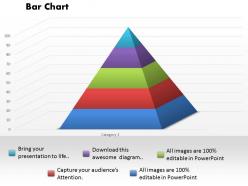 0414 pyramid style column chart powerpoint graph
Useful for business and growth related presentations. High resolution graphics do not pixilate when projected on bigger and wider screens. Runs smoothly with softwares and is compatible with Google slides. The layout can accommodate company’s logo, trademark and name. Provision to add sub-titles and titles as there are no space constraints. Changeable layout in terms of orientation, color, font text and design. Convertible into common formats like JPEG and PDF.
-
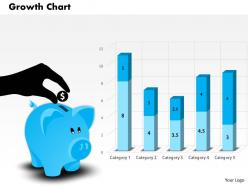 0514 financial growth chart with piggy powerpoint slides
We are proud to present our 0514 financial growth chart with piggy powerpoint slides. This Business Power Point template slide is designed with 3d graphic of piggy with growth chart. This template is crafted for financial growth display.
-
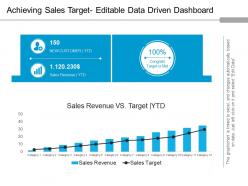 Achieving sales target editable data driven dashboard Snapshot powerpoint ideas
The design allows full editing. You can modify and customize the design the way you want. The design makes use of excel linked chart, where you need to include business related facts on excel sheet and it will automatically get changed in the PPT design. Quick and easy downloading available. You can download the design into JPEG and PDF formats. Design template is fully compatible with Google Slides and MS PowerPoint software.
-
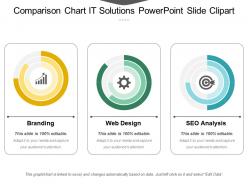 Comparison chart it solutions powerpoint slide clipart
Presenting our comparison chart it solutions PowerPoint slide clipart. This PPT display can be used to represent business it solutions in an approachable way. All the components used here are fully editable by means of color, shape, and orientation, font shape, font type, font size, and text. This PPT plan can be used with Google Slides and can be adjusted in any PowerPoint software. These high-quality graphics can be projected on widescreen forecasts and are available in both standard 4:3, widescreen format 16:9 after downloading.
-
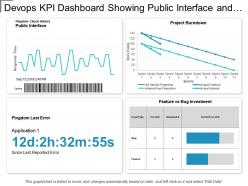 Devops kpi dashboard showing public interface and project burndown
Presenting this set of slides with name - Devops Kpi Dashboard Showing Public Interface And Project Burndown. This is a four stage process. The stages in this process are Development And Operations, Devops.
-
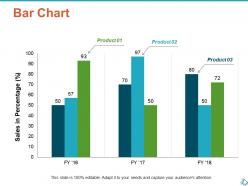 Bar chart finance ppt show infographic template
Presenting this set of slides with name - Bar Chart Finance Ppt Show Infographic Template. This is a three stage process. The stages in this process are Finance, Analysis, Business, Investment, Marketing.
-
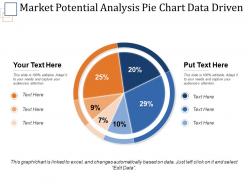 Market potential analysis pie chart data driven ppt slide
Presenting the slide named Market potential analysis Pie chart data driven PPT slide. This template with high-quality graphics is professionally designed. With an option to change the size, style and color of the font, this slide is totally editable. You can customize the text and color of the diagram as well as the background as per your discretion. The slide is compatible with Google Slides which make it easily accessible. You can customize and save the file as JPG or PDF formats. Once the pie chart is linked to excel, it automatically changes based on the data. Use this readymade template to analyse website visits instantly.
-
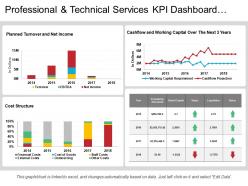 Professional and technical services kpi dashboard showing cost structure
Presenting this set of slides with name - Professional And Technical Services Kpi Dashboard Showing Cost Structure. This is a four stage process. The stages in this process are Professional And Technical Services, Services Management, Technical Management.
-
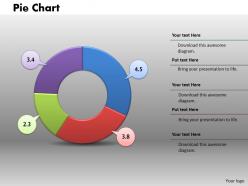 0414 colorful donut chart business graphics powerpoint graph
PPT slide works evenly and smoothly on all software. PPT example can be downloaded easily. More customization by including your company’s logo, trademark. No space constraints whatsoever. Graphics do not pixelate when displayed on widescreen format. Insert title and sub-title at your discretion. Slides compatible with Google slides for more viewership. Flexible layout including font, text, color and design. Change to JPG and PDF formats in moments.
-
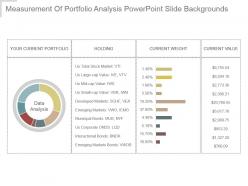 Measurement of portfolio analysis powerpoint slide backgrounds
Presenting measurement of portfolio analysis powerpoint slide backgrounds. This is a measurement of portfolio analysis powerpoint slide backgrounds. This is a seven stage process. The stages in this process are data analysis, your current portfolio, holding, current weight, current value.
-
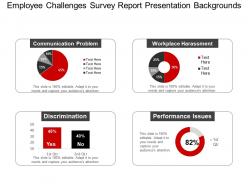 Employee challenges survey report presentation backgrounds
Presenting employee challenges survey report presentation backgrounds. This is a employee challenges survey report presentation backgrounds. This is a four stage process. The stages in this process are survey, forecasting, statistics.
-
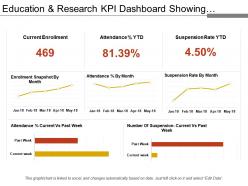 Education and research kpi dashboard showing attendance and suspension rate
Presenting education and research KPI dashboard showing attendance and suspension rate PPT slide. The suspension rate KPI dashboard PPT slide designed by the professional team of SlideTeam. The attendance rate report slide is 100% editable in PowerPoint. The attendance and detention KPI dashboard PowerPoint slide is compatible with Google Slide so a user can share this attendance rate dashboard slide with others. A user can make changes in the font size, font type, color as well as dimensions of the college acceptance rate dashboard PPT template as per the requirement. You may edit the value in the reporting tool KPI dashboard presentation template as the slide gets linked with the Excel sheet.
-
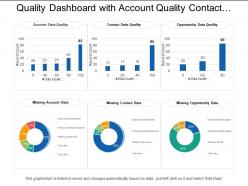 Quality dashboard snapshot with account quality contact data missing account data
Presenting this set of slides with name - Quality Dashboard Snapshot With Account Quality Contact Data Missing Account Data. This is a six stage process. The stages in this process are Quality Dashboard, Quality Kpi, Quality Metircs.
-
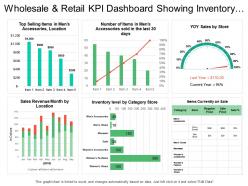 Wholesale and retail kpi dashboard showing inventory level by category sales revenue month
Presenting the retail business slide for PowerPoint. This presentation template is 100% modifiable in PowerPoint and is designed by professionals. You can edit the objects in the slide like font size and font color very easily. This presentation slide is fully compatible with Google Slide and can be saved in JPG or PDF file format without any fuss. Click on the download button to download this template in no time.
-
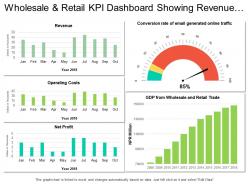 Wholesale and retail kpi dashboard showing revenue operating costs net profit
Presenting the KPI dashboard presentation template. This PowerPoint slide is fully editable in PowerPoint and is professionally designed. The user can bring changes to edit the objects in the slide like font size and font color without going through any hassle. This presentation slide is 100% compatible with Google Slide and can be saved in JPG or PDF file format without any fuss. Fast download this at the click of the button.
-
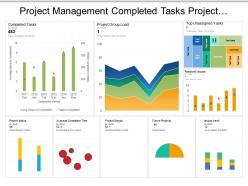 Project management completed tasks project group load dashboard
Preference to present design in standard and widescreen display view. PowerPoint design is goes well with Google slides. Fine quality Presentation template comes with editing options as color, text and font can be edited at any stage. Present the PPT slide by addition of business logo. Fast download and simple transform into JPEG and PDF document. Presentation design is downloadable with different nodes and stages. PowerPoint diagram comes with high resolution pixels.
-
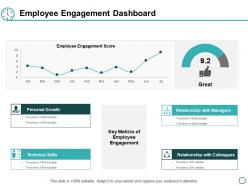 Employee engagement dashboard ppt powerpoint presentation layouts ideas
Presenting this set of slides with name - Employee Engagement Dashboard Ppt Powerpoint Presentation Layouts Ideas. This is a five stages process. The stages in this process are Personal Growth, Technical Skills, Relationship With Colleagues, Business, Management.
-
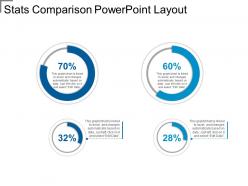 Stats comparison powerpoint layout
Presenting, our, stats comparison PowerPoint layout. Download this design within a few seconds and add your company logo. Alter the text to suit the context and justify your data. Use this stats comparison layout in your business meetings and use in both standard 4:3 and widescreen format 16:9 after downloading. No difference in the quality of PPT models after editing. Transform into jpeg/pdf as per term. This design is entirely compatible with Google Slides and various online and offline software. Pitch this PPT deck on widescreens to for an impactful activity. Personalize the color schemes, text and font as needed.
-
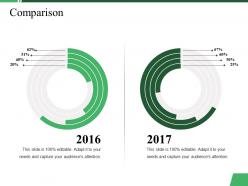 Comparison ppt summary rules
Presenting this set of slides with name - Comparison Ppt Summary Rules. This is a two stage process. The stages in this process are Comparison, Years, Business, Marketing, Strategy.
-
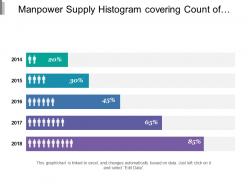 Manpower supply histogram covering count of hiring of year over year in percent
Presenting this set of slides with name - Manpower Supply Histogram Covering Count Of Hiring Of Year Over Year In Percent. This is a five stage process. The stages in this process are Manpower Supply, Manpower Service, Manpower Recruitment.
-
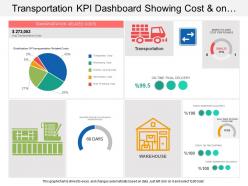 Transportation kpi dashboard showing cost and on time final delivery
Presenting transportation KPI dashboard showing cost and on time final delivery PPT slide. This deck offers you plenty of space to put in titles and sub titles. This template is Excel linked just right click to input your information. High resolution based layout, does not change the image even after resizing. This presentation icon is fully compatible with Google slides. Quick downloading speed and simple editing options in color text and fonts.PPT icons can easily be changed into JPEG and PDF applications.
-
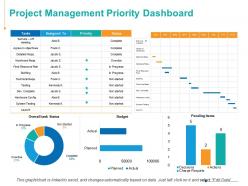 Project management priority dashboard marketing ppt powerpoint presentation inspiration outline
Presenting this set of slides with name - Project Management Priority Dashboard Marketing Ppt Powerpoint Presentation Inspiration Outline. This is a five stage process. The stages in this process are Staffing, Priority, Budget, Planned, Actual.
-
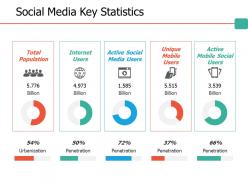 Social media key statistics ppt professional files
Presenting this set of slides with name - Social Media Key Statistics Ppt Professional Files. This is a five stage process. The stages in this process are Business, Management, Strategy, Analysis, Icons.
-
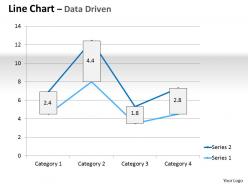 Data driven line chart market graph powerpoint slides
We are proud to present our data driven line chart market graph powerpoint slides. You Have Belief Am Faith In Your Futuristic Plans. Chalk Them Out For Your Team With Our Data Driven Line Chart Market Graph Powerpoint Slides Power Point Templates. Use Our Bewitching Data Driven Line Chart Market Graph Powerpoint Slides Power Point Templates. They Will Delight Your Audience With The Magic Of Your Words.
-
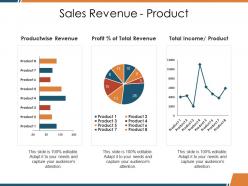 Sales revenue product ppt picture
Presenting this set of slides with name - Sales Revenue Product Ppt Picture. This is a three stage process. The stages in this process are Productwise Revenue, Total Revenue, Total Income, Business, Marketing.
-
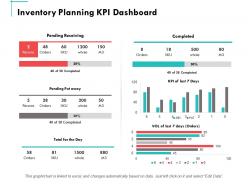 Inventory planning kpi dashboard ppt powerpoint presentation summary graphics
Presenting this set of slides with name - Inventory Planning Kpi Dashboard Ppt Powerpoint Presentation Summary Graphics. This is a four stages process. The stages in this process are Finance, Marketing, Management, Investment, Analysis.
-
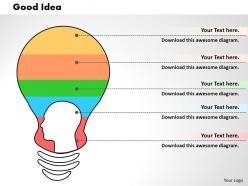 0414 best business idea bar chart powerpoint graph
Easily presentable PowerPoint design. Presentation template slide download easily. Text, font, colors and orientation can be changed as per the commerce need. Unaffected High resolution presentation design even after customization. Presentable with business details name and logo of your company. Well harmonious with all the software’s and Google slides. Translatable into PDF or JPEG formats. Suitable for sharing information on progress, development, targets, goals, success, achievements etc.
-
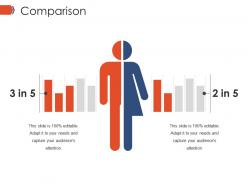 Comparison ppt infographics
Presenting comparison ppt infographics. This is a comparison ppt infographics. This is a two stage process. The stages in this process are comparison, business, marketing, management, percentage.
-
 Our market share ppt show
Presenting this set of slides with name - Our Market Share Ppt Show. This is a four stage process. The stages in this process are Wages, Depreciation, Rent And Utilities, Marketing.
-
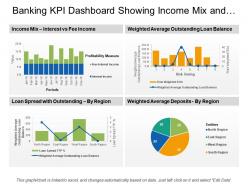 Banking kpi dashboard showing income mix and loan spread
Presenting this set of slides with name - Banking Kpi Dashboard Showing Income Mix And Loan Spread. This is a four stage process. The stages in this process are Banking, Finance, Money.
-
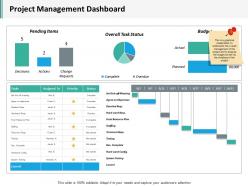 Project management dashboard snapshot ppt inspiration ideas
Presenting this set of slides with name - Project Management Dashboard Snapshot Ppt Inspiration Ideas. This is a three stage process. The stages in this process are Business, Management, Strategy, Analysis, Marketing.
-
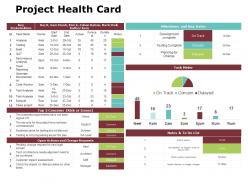 Project health card slide2 ppt powerpoint presentation gallery slides
Presenting this set of slides with name - Project Health Card Slide2 Ppt Powerpoint Presentation Gallery Slides. This is a two stage process. The stages in this process are Business, Management, Strategy, Analysis, Marketing.
-
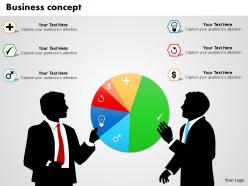 0514 3d pie chart data driven application diagram powerpoint slides
High-resolution images and the slide icons. Allow saving in the multiple formats like JPG or PDF format. Easy to edit and customize the content or the slide icons. 100% access to edit the background, style and orientation of the slide icons once downloaded. Provided guidance to customize the background or the slide icons content. Beneficial for the business leaders, sales and marketing professionals.
-
 1214 battery with alert sign and dices power technology powerpoint slide
We are proud to present our 1214 battery with alert sign and dices power technology powerpoint slide. Graphic of battery with alert sign and dices are used to craft this power point template. This PPT contains the concept of energy conservation and power technology. Use this PPT for your energy and technology related presentations.
-
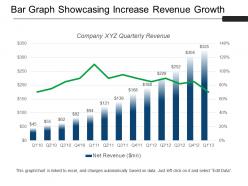 Bar graph showcasing increase revenue growth sample of ppt
Presenting the bar graph showcasing increase revenue growth sample of PPT. This PowerPoint theme is fully supported by Google Slides. Simple data input with linked Excel chart, just right click to input values. The picture quality of these slides does not change even when you project them on a large screen. Quick downloading speed and formats can be easily changed to other applications like JPEG and PDF. This template is suitable for marketing, salespersons, business managers, and entrepreneurs.
-
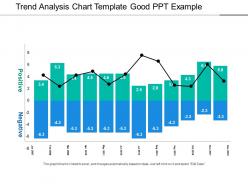 Trend analysis chart template good ppt example
Presenting Trend Analysis Chart Template Good Ppt Example. This PPT presentation is thoroughly researched by the experts and the slide consists of appropriate content that can be modified. It is fully customizable. You can add or delete the content as per your need. Not just this, you can also make the required changes in the texts and shapes. Download this professionally designed PPT, add your content and present it with confidence.
-
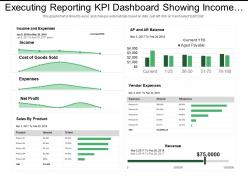 Executing reporting kpi dashboard snapshot showing income sales by product vendor expenses
Presenting this set of slides with name - Executing Reporting Kpi Dashboard Snapshot Showing Income Sales By Product Vendor Expenses. This is a four stage process. The stages in this process are Executive Reporting, Executive Analysis, Executive Performance.
-
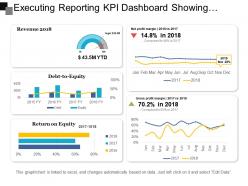 Executing reporting kpi dashboard showing revenue net profit margin debt to equity
Presenting this set of slides with name - Executing Reporting Kpi Dashboard Showing Revenue Net Profit Margin Debt To Equity. This is a five stage process. The stages in this process are Executive Reporting, Executive Analysis, Executive Performance.


