- Sub Categories
-
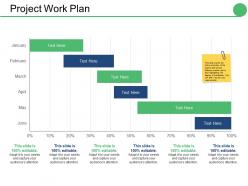 Project work plan ppt infographics vector
Presenting this set of slides with name - Project Work Plan Ppt Infographics Vector. This is a six stage process. The stages in this process are Month, Business, Step, Management, Percentage.
-
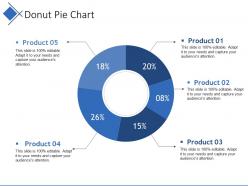 Donut pie chart presentation backgrounds
Presenting this set of slides with name - Donut Pie Chart Presentation Backgrounds. This is a five stage process. The stages in this process are Business, Marketing, Percentage, Chart, Process.
-
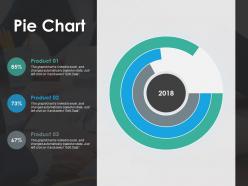 Pie chart ppt show infographic template
Presenting this set of slides with name - Pie Chart Ppt Show Infographic Template. This is a three stage process. The stages in this process are Percentage, Product, Management, Marketing, Business.
-
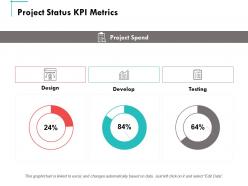 Project status kpi metrics develop ppt powerpoint presentation summary aids
Presenting this set of slides with name - Project Status Kpi Metrics Develop Ppt Powerpoint Presentation Summary Aids. This is a three stages process. The stages in this process are Finance, Marketing, Management, Investment, Analysis.
-
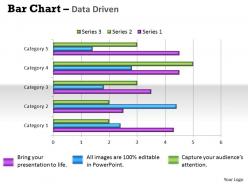 Data driven bar chart for different categories powerpoint slides
We are proud to present our data driven bar chart for different categories powerpoint slides. Great Ideas Deserve A Powerful Launch. Our Data Driven Bar Chart For Different Categories Powerpoint Slides Power Point Templates Will Give Them The Thrust They Need. Bake Your Thoughts In The Oven Of Our Data Driven Bar Chart For Different Categories Powerpoint Slides Power Point Templates. Sense The Aromas Of Your Ideas Waft Across The Room.
-
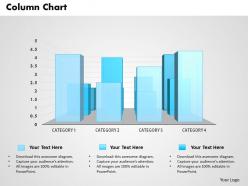 0514 3d bar graph data driven result display powerpoint slides
Wonderfully designed PPT design templates suitable for different business professionals and management scholars, Detailed and appropriate PPT Images with supple data alternate and can add title and subtitle too, Feasible downloading flexibility available hence which is time savings, Fully harmonious with all the graphic software available and all Google slides, Editable background images, styles, texts, colors, fonts etc.,
-
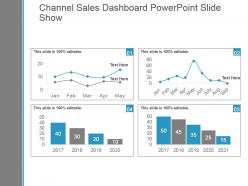 Channel sales dashboard powerpoint slide show
Presenting channel sales dashboard powerpoint slide show. This is a channel sales dashboard powerpoint slide show. This is a four stage process. The stages in this process are business, marketing, line chart, dashboard, management.
-
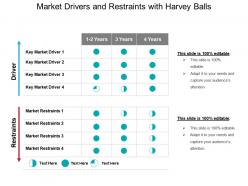 Market drivers and restraints with harvey balls powerpoint slide designs
Presenting market drivers and restraints with harvey balls PPT Slide which is 100% editable. This slideshow is data driven chart and the shapes of the graphics adjust automatically according to your data. Easy to customize and personalize this PowerPoint template and its high resolution visuals are easy to modify as per your need. This PowerPoint theme is compatible with Google Slides , multiple software and format options. This PPT is used by business analysts and professionals belongs to sales and marketing.
-
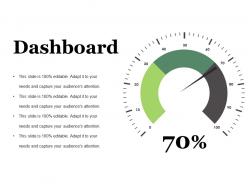 Dashboard snapshot ppt summary maker
Presenting this set of slides with name - Dashboard Snapshot Ppt Summary Maker. This is a one stage process. The stages in this process are Dashboard, Meter, Speed, Measure, Planning.
-
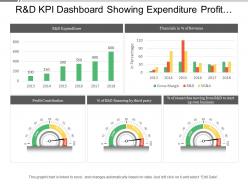 R and d kpi dashboard showing expenditure profit contribution and financial in percentage of revenue
Presenting this set of slides with name - R And D Kpi Dashboard Showing Expenditure Profit Contribution And Financial In Percentage Of Revenue. This is a five stage process. The stages in this process are R And D, Research And Development, Research And Technological Development.
-
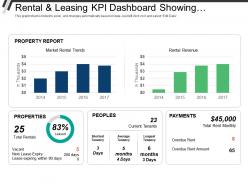 Rental and leasing kpi dashboard showing properties people payments rental revenue
Presenting this set of slides with name - Rental And Leasing Kpi Dashboard Showing Properties People Payments Rental Revenue. This is a five stage process. The stages in this process are Rental And Leasing, Dealing And Leasing, Rental And Engage.
-
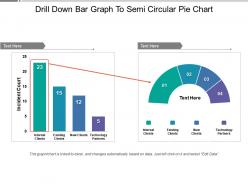 Drill down bar graph to semi circular pie chart
Presenting this set of slides with name - Drill Down Bar Graph To Semi Circular Pie Chart. This is a two stage process. The stages in this process are Drill Down, Hierarchy, Top Downwards.
-
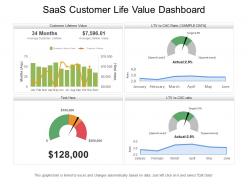 Saas customer life value dashboard
Introducing Saas customer life value dashboard PPT template. An easy access to make the desired changes or edit it anyways. Wide screen view of the slides. Easy conversion into Jpeg or Pdf format. The PPT images offer compatibility with Google templates. High resolution icons for clear message delivery. Unique and informational content. Valuable for business professionals, sales representatives, marketing professionals, students and selling investigators. High quality charts and visuals used in the designing process. They enhance the performance of the presentation.
-
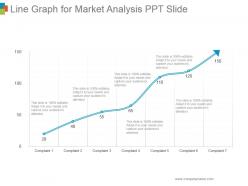 Line graph for market analysis ppt slide
Presenting line graph for market analysis ppt slide. This is a line graph for market analysis ppt slide. This is a seven stage process. The stages in this process are complaint.
-
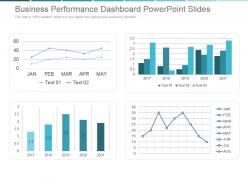 Business performance dashboard powerpoint slides
Presenting business performance dashboard powerpoint slides. This is a business performance dashboard powerpoint slides. This is a four stage process. The stages in this process are business, chart and graph, strategy, success, line graph.
-
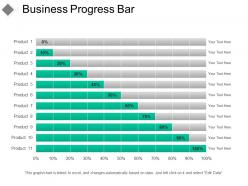 Business progress bar sample of ppt
Presenting Business Progress Bar Sample Of PPT template. This slide is designed according to your specific needs. You can include a wide range of custom made slides with all sorts of relevant charts and graphs. Download this PowerPoint template in both widescreen(16:9) and standard screen(4:3) sizes. The layout is completely supported by Google Slides. This slide can be saved into JPG or PDF format can be done with just the click of a button.
-
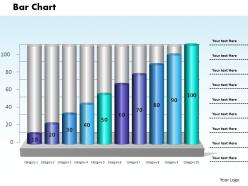 0414 column chart growth illustration powerpoint graph
Image quality remain the unaffected even when resize the image. Change PowerPoint image font, text, color and design as per your method. Perfect for marketing professionals, business managers, entrepreneurs and big organizations. This presentation slide is totally attuned with Google slide. Easy adaptation to other software’s like JPG and PDF formats. Easy to put in company logo, brand or name.
-
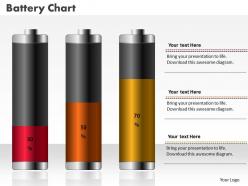 0414 increasing flow battery column chart powerpoint graph
Requires minimal additional space for explanations being self-expressive. Enable highlighting the key aspects. User- friendly PPT presentation diagrams. Supports the process of decision making to enhance business productivity. Makes the entire information appear extremely relevant and interesting. Compatible with Google Slides. Enables complete modification without any hassles. Provides error-free performance.
-
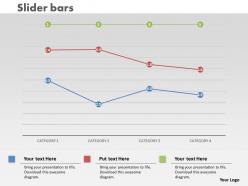 0414 slider line chart for communicating data powerpoint graph
We are proud to present our 0414 slider line chart for communicating data powerpoint graph. Activate the energies of your audience with our Slider Line Chart For Communicating Data Powerpoint Graph Powerpoint Templates. Get their creative juices flowing with your words. Enhance the stature of your presentation with our Slider Line Chart For Communicating Data Powerpoint Graph Powerpoint Templates. Adorn the beauty of your thoughts with their colourful backgrounds.
-
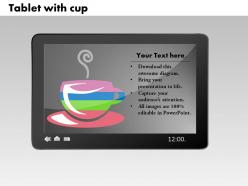 0414 tea cup bar chart illustration powerpoint graph
We are proud to present our 0414 tea cup bar chart illustration powerpoint graph. Our Tea Cup Bar Chart Illustration Powerpoint Graph Powerpoint Templates are the strands of your mental loom. Weave them together and produce a magical tapestry. Our Tea Cup Bar Chart Illustration Powerpoint Graph Powerpoint Templates provide windows to your brilliant mind. Open them to your audience and impress them with your knowledge.
-
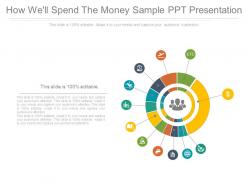 How well spend the money sample ppt presentation
Presenting how well spend the money sample ppt presentation. This is a how well spend the money sample ppt presentation. This is a twelve stage process. The stages in this process are business, marketing, process, analysis, strategy, management.
-
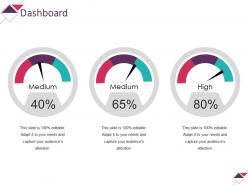 Dashboard powerpoint slide
Presenting this set of slides with name - Dashboard Powerpoint Slide. This is a three stage process. The stages in this process are Medium, Medium, High, Dashboard, Business, Percentage.
-
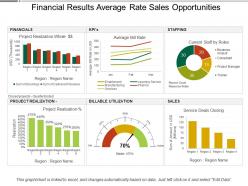 Financial results average rate sales opportunities
Introducing financial results average rates sales opportunities Presentation template. Pre-designed PowerPoint slide assist you in saving time and effort. Color, text and font can be easily edited as the PPT graphic is completely editable. Adaptable as can be transformed into PDF or JPEG formats. Fast download and easy to share with large set of audience. Presentation diagram is presentable in standard and widescreen display. Innovatively created PPT design familiar with Google slides.
-
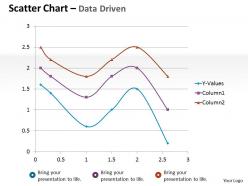 Data driven scatter chart mathematical diagram powerpoint slides
We are proud to present our data driven scatter chart mathematical diagram powerpoint slides. This data driven scatter graph is a popular chart style used to show the distribution and clustering of data. The scatter graph is best used when there are many data items which not evenly distributed in any dimension.
-
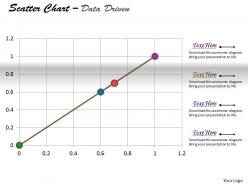 Data driven scatter chart for market capitalisation powerpoint slides
We are proud to present our data driven scatter chart for market capitalisation powerpoint slides. Put The Wind In Your Sails With Our Data Driven Scatter Chart For Market Capitalisation Powerpoint slides Power Point Templates. Skim Smoothly Over The Choppy Waters Of The Market. Let Our Data Driven Scatter Chart For Market Capitalisation Powerpoint slides Power Point Templates Give The Updraft To Your Ideas. See Them Soar To Great Heights With Ease.
-
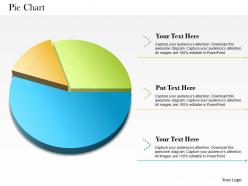 0514 3 staged colored pie chart powerpoint slides
They are magnificently created PPT images constructed by team of experts which are quite convenient for management professional, business researchers and analysts etc. The scheme, intensity, context, symbols etc. can be easily rearrange able according to the need of your matter. These Presentation graphics can also be transformable into various schemes like PDF or JPG. They have an easy and simple downloading procedure.
-
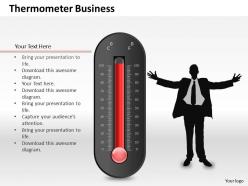 0514 unique design thermometer graphic powerpoint slides
We are proud to present our 0514 unique design thermometer graphic powerpoint slides. Unique design scientific thermometer is used in this Business Power Point template. To display various reading in any science related presentation use this graphic masterpiece and get noticed.
-
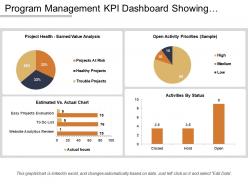 Program management kpi dashboard showing estimated vs actual chart
Presenting this set of slides with name - Program Management Kpi Dashboard Showing Estimated Vs Actual Chart. This is a four stage process. The stages in this process are Program Development, Human Resource Management, Program Management.
-
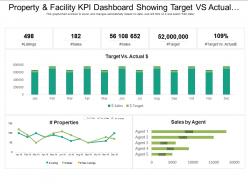 Property and facility kpi dashboard showing target vs actual cost and sales by agent
Get a chance to go through, property and facility KPI dashboard showing target-vs-actual cost and sales by agent PowerPoint Presentation Slide. This Presentation has been designed by professionals and is fully editable. You can have access to alter the font size, font type, colors, and even the background. This Template is amiable with Google Slide and can be saved in JPG or PDF format without any chaos created. Fast download at the click of the button.
-
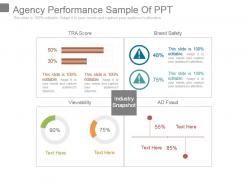 Agency performance sample of ppt
Presenting agency performance sample of ppt. This is a agency performance sample of ppt. This is a four stage process. The stages in this process are tra score, brand safety, viewability, industry snapshot, ad fraud.
-
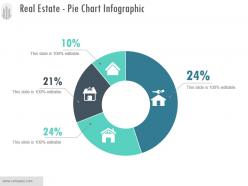 Real estate pie chart infographic sample of ppt presentation
Presenting real estate pie chart infographic sample of ppt presentation. This is a real estate pie chart infographic sample of ppt presentation. This is a four stage process. The stages in this process are icons, strategy, percentage, finance, business.
-
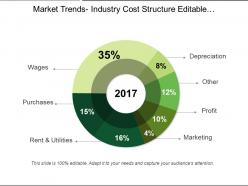 Market trends industry cost structure editable doughnut chart ppt icon
Presenting market trends industry cost structure editable doughnut chart ppt icon. This is a market trends industry cost structure editable doughnut chart ppt icon. This is a seven stage process. The stages in this process are wages, purchases, rent and utilities, marketing, profit, other, depreciation.
-
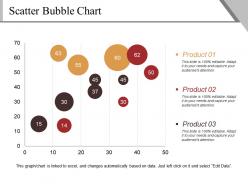 Scatter bubble chart presentation background images
Presenting scatter bubble chart presentation background images. This is a scatter bubble chart presentation background images. This is a three stage process. The stages in this process are bubble, finance, business, marketing, strategy.
-
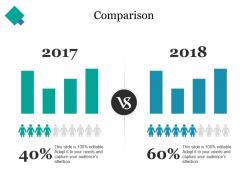 Comparison ppt backgrounds
Presenting this set of slides with name - Comparison Ppt Backgrounds. This is a two stage process. The stages in this process are Comparison, Table, Marketing, Management, Business.
-
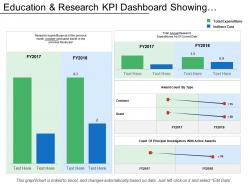 Education and research kpi dashboard showing research expenditure
Presenting education and research KPI dashboard showing research expenditure PPT slide. The expenditure on research and development presentation slide designed by the professional team of SlideTeam. The research expenditure PPT template is fully editable in PowerPoint. The research and development expenditure PowerPoint template is compatible with Google Slide so a user can share this dashboard slide with others. A user can make changes in the font size, font type, color as well as dimensions of the research expenditure PPT template as per the requirement. You may edit the value in the expense research and development presentation slide as the slide gets linked with the Excel sheet.
-
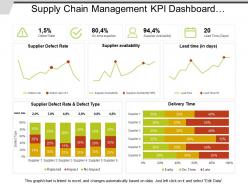 Supply chain management kpi dashboard showing defect rate and delivery time
Presenting this set of slides with name - Supply Chain Management Kpi Dashboard Showing Defect Rate And Delivery Time. This is a three stage process. The stages in this process are Demand Forecasting, Predicting Future Demand, Supply Chain Management.
-
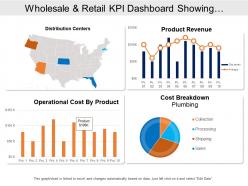 Wholesale and retail kpi dashboard showing distribution centers product revenue
Presenting this set of slides with name - Wholesale And Retail Kpi Dashboard Showing Distribution Centers Product Revenue. This is a four stage process. The stages in this process are Wholesale And Retail, Extensive And Retail, Wholesale And Distribute.
-
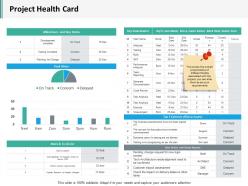 Project health card slide2 ppt infographics structure
Presenting this set of slides with name - Project Health Card Slide2 Ppt Infographics Structure. This is a two stage process. The stages in this process are Business, Management, Strategy, Analysis, Marketing.
-
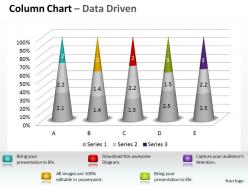 Data driven 3d chart for interpretation of statistics powerpoint slides
We are proud to present our data driven 3d chart for interpretation of statistics powerpoint slides. A bar graph is composed of discrete bars that represent different categories of data. The length or height of the bar is equal to the quantity within that category of data. Bar graphs are best used to compare values across categories.
-
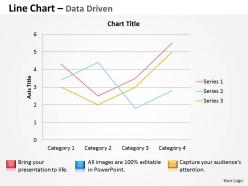 Data driven line chart to demonstrate data powerpoint slides
We are proud to present our data driven line chart to demonstrate data powerpoint slides. This line chart displays information as a series of data points connected by straight line segments.You can illustrate your ideas and imprint them in the minds of your team with this PPT diagram
-
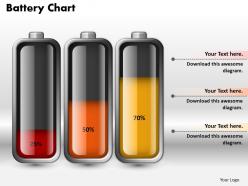 0414 battery percentage style column chart powerpoint graph
High resolution slide design visuals. Impactful and eye catchy images. No fear of image pixilation when projected on wide screen. Ease of download. Compatible with multiple formats, Google slides, Mac and Windows. Compatible with multiple software options both online and offline. Thoroughly editable slide design visuals. Ease of inclusion and exclusion of slide content. Ease of slide design personalization with company specific name, logo and trademark.
-
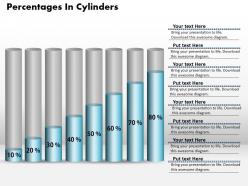 0414 cylinders column chart of percentage growth powerpoint graph
PPT example works perfectly with Google slides. Fluently download and variable into JPEG and PDF document. Smoothly editable PowerPoint clipart as color, text and font are editable. Alternate of insertion of trade representation and pictograph for personalization. Presentation slide template can be exhibited in both standard and widescreen view. Convenience to download identical designs with different nodes and stages. Perfect for business entrepreneurs, event management team, project management team, industry professionals etc.
-
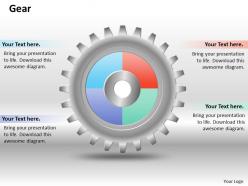 0414 gears mechanism pie chart powerpoint graph
We are proud to present our 0414 gears mechanism pie chart powerpoint graph. Hit the right notes with our Gears Mechanism Pie Chart Powerpoint Graph Powerpoint Templates. Watch your audience start singing to your tune. Walk your team through your plans using our Gears Mechanism Pie Chart Powerpoint Graph Powerpoint Templates. See their energy levels rise as you show them the way.
-
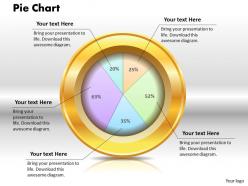 0414 percetage profit ratio pie chart powerpoint graph
High resolution slide design background. Thoroughly editable slide content. Ease of inclusion and exclusion of content at sole discretion. Ease of download. Freedom to personalize the content with company specific name, logo and trademark. Compatible with numerous format options. Compatible with multiple software options available both online and offline. Compatible with Google slides. Used by financiers, business professionals, students and teachers.
-
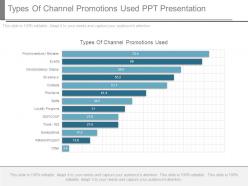 Types of channel promotions used ppt presentation
Presenting types of channel promotions used ppt presentation. This is a types of channel promotions used ppt presentation. This is a thirteen stage process. The stages in this process are types of channel promotions used, loyalty programs.
-
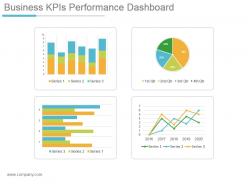 Business kpis performance dashboard snapshot powerpoint slide clipart
Presenting business kpis performance dashboard snapshot powerpoint slide clipart. This is a business kpis performance dashboard powerpoint slide clipart. This is a four stage process. The stages in this process are series, qtr.
-
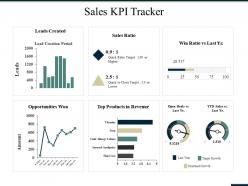 Sales kpi tracker ppt summary grid
Presenting this set of slides with name - Sales Kpi Tracker Ppt Summary Grid. This is a six stage process. The stages in this process are Leads Created, Sales Ratio, Opportunities Won, Products In Revenue, Open Deals Vs.
-
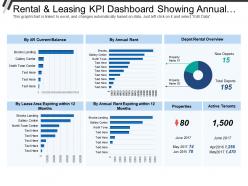 Rental and leasing kpi dashboard showing annual rent depot rental overview
Presenting this set of slides with name - Rental And Leasing Kpi Dashboard Showing Annual Rent Depot Rental Overview. This is a seven stage process. The stages in this process are Rental And Leasing, Dealing And Leasing, Rental And Engage.
-
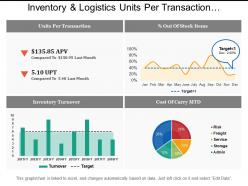 Inventory and logistics units per transaction dashboards
Spectacular inventory and logistics units per transaction dashboards PPT template. Top quality and creative PowerPoint slide design. Adjustable presentation graphic as compatible with Google slides. Perfect for sales executives, marketers, business professionals, analysts, strategists, students, teachers, etc. Information on making the changes has been provided for your provision. Download is rapid and can be displayed in widescreen view mode also. 100% editable PPT designs as completely modifiable such as icons, text, colors, etc. Effortlessly convertible into JPEG and PDF file formats.
-
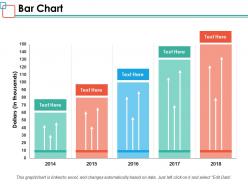 Bar chart ppt powerpoint presentation inspiration images
Presenting this set of slides with name - Bar Chart Ppt Powerpoint Presentation Inspiration Images. This is a five stage process. The stages in this process are Business, Management, Strategy, Analysis, Marketing.
-
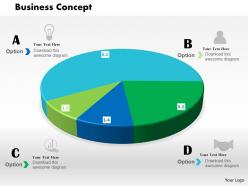 0514 3d colored data driven pie chart for business powerpoint slides
We are proud to present our 0514 3d colored data driven pie chart for business powerpoint slides. A 3d colored data driven chart is used in this Business power Point template. Use this template for sequential data flow in any presentation. Go ahead use this template in your business presentation.
-
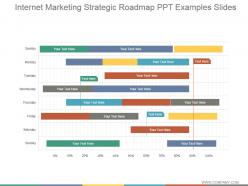 Internet marketing strategic roadmap ppt examples slides
Presenting internet marketing strategic roadmap ppt examples slides. This is a internet marketing strategic roadmap ppt examples slides. This is a seven stage process. The stages in this process are business, marketing, management, strategy, success.
-
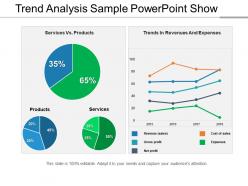 Trend analysis sample powerpoint show
Presenting a PowerPoint slide named Trend Analysis Sample PowerPoint Show. Create a compelling presentation with this PPT diagram, which is both professional and editable. Customize colors, choose font styles, and size. You can choose from a wide variety of icons. Resize and scale the images to fit any content. The PPT slide is compatible with Google Slides and can be fetched at once. You can save it as both PDF and JPG format. This PPT slide is data-driven and linked to the Excel sheet.
-
 Customer lifetime value and total mrr sales dashboards
Presenting this set of slides with name - Customer Lifetime Value And Total Mrr Sales Dashboards. This is a three stage process. The stages in this process are Sales Dashboard, Sales Kpis, Sales Performance.
-
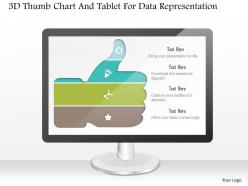 1214 3d thumb chart and tablet for data representation powerpoint slide
We are proud to present our 1214 3d thumb chart and tablet for data representation powerpoint slide. This Power point template slide has been designed with graphic of thumb chart and tablet. These text boxes can be used for data representation. Use this PPT for your business data analysis related presentations.
-
 Alarm clock with data driven pie chart powerpoint slides
We are proud to present our alarm clock with data driven pie chart powerpoint slides. This power point template diagram has been designed with graphic of alarm clock and pie chart. This pie chart is data driven. Use this PPT diagram can be used for marketing and business related presentations.
-
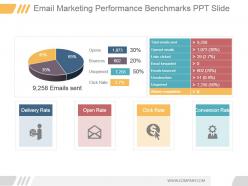 Email marketing performance benchmarks ppt slide
Presenting email marketing performance benchmarks ppt slide. This is a email marketing performance benchmarks ppt slide. This is a two stage process. The stages in this process are opens, bounces, unopened, click rate, emails sent, total emails sent, opened emails, links clicked, email forwarded, emails bounced, unsubscribes, unopened, abuse complaints, delivery rate, open rate, click rate, conversion rate.
-
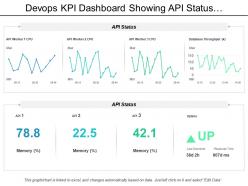 Devops kpi dashboard showing api status and uptime
Presenting this set of slides with name - Devops Kpi Dashboard Showing Api Status And Uptime. This is a four stage process. The stages in this process are Development And Operations, Devops.
-
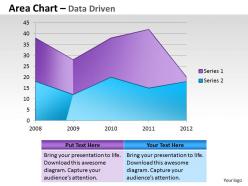 Data driven area chart for showing trends powerpoint slides
We are proud to present our data driven area chart for showing trends powerpoint slides. Tee Off With Our Data Driven Area Chart For Showing Trends Powerpoint Slides Power Point Templates. They Will Reward You With A Hole In One. Launch Your Ideas With Our Data Driven Area Chart For Showing Trends Powerpoint Slides Power Point Templates. Take Your Audience Along On A Magnificent Flight.
-
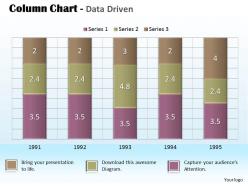 Data driven chart for business project powerpoint slides
We are proud to present our data driven chart for business project powerpoint slides. Zap Them With Our Data Driven Chart For Business Project Powerpoint Slides Power Point Templates. See Them Reel Under The Impact. Inspire Your Team With Our Data Driven Chart For Business Project Powerpoint Slides Power Point Templates. Let The Force Of Your Ideas Flow Into Their Minds.


