- Sub Categories
-
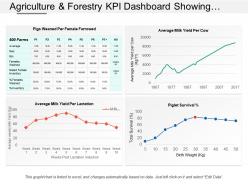 Agriculture and forestry kpi dashboard showing average milk yield per lactation
Exhibiting agriculture and forestry KPI dashboard showing average milk yield per lactation PPT design. Speedy download with easy to save options. Effortless to put in corporation name, logo and image. Presentation template can be shared with Google slides as easily merge with them. PowerPoint graphic can be showcased in standard and widescreen view. Preference to download and present with different nodes and stages. PPT diagram can be modify easily as some components are editable.
-
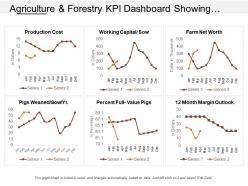 Agriculture and forestry kpi dashboard showing production cost and working capital sow
Presenting agriculture and forestry KPI dashboard showing production cost and working capital sow PPT slideshow. Easy and convenient downloading by following simple steps. They have an amazing view to grab the attention if the viewer. They are popular and in demand due to their easy use and accessibility. They maintain the professionalism of the presentation. Fully compatible with Google slides. Have the tendency to enhance the overall impact of your presentation. User friendly PPT templates. Presented to be saved in jpg or pdf format if required.
-
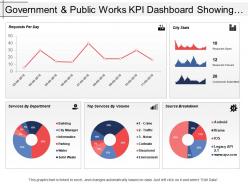 Government and public works kpi dashboard showing requests per day and city stats
Presenting this set of slides with name - Government And Public Works Kpi Dashboard Showing Requests Per Day And City Stats. This is a five stage process. The stages in this process are Government And Public Works, Government And Public Tasks.
-
 Property and facility kpi dashboard showing sold homes per available inventory ratio
Get a chance to go through, property and facility KPI dashboard showing sold homes per available inventory ratio PowerPoint Presentation Slide. This Presentation has been designed by professionals and is fully editable. You can have access to play with the font size, font type, colors, and even the background. This Template is attainable with Google Slide and can be saved in JPG or PDF format without any hurdles created during the saving process. Fast download at the click of the button.
-
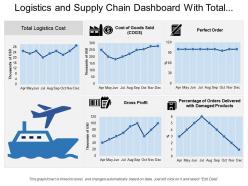 Logistics and supply chain dashboard with total logistics cost and perfect order
Presenting this set of slides with name - Logistics And Supply Chain Dashboard With Total Logistics Cost And Perfect Order. This is a six stage process. The stages in this process are Logistics Dashboard, Logistics Kpis, Logistics Performance.
-
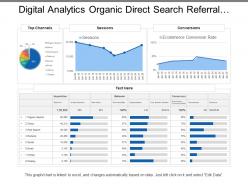 Digital analytics organic direct search referral social
Presenting this set of slides with name - Digital Analytics Organic Direct Search Referral Social. This is a five stage process. The stages in this process are Digital Analytics, Digital Dashboard, Digital Kpis.
-
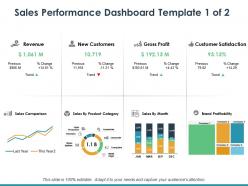 Revenue new customers gross profit customer satisfaction sales performance
Presenting this set of slides with name - Revenue New Customers Gross Profit Customer Satisfaction Sales Performance. This is a four stage process. The stages in this process are Revenue, New Customers, Gross Profit Customer, Satisfaction Sales Performance.
-
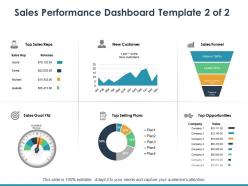 Top sales reps new customer sales funnel top selling plans opportunities sales goal
Presenting this set of slides with name - Top Sales Reps New Customer Sales Funnel Top Selling Plans Opportunities Sales Goal. This is a six stage process. The stages in this process are Top Sales Reps New, Customer Sales, Funnel Top, Selling Plans Opportunities, Sales Goal.
-
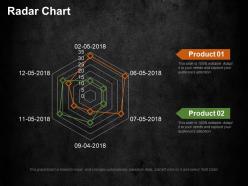 Radar chart ppt summary background designs
Presenting this set of slides with name - Radar Chart Ppt Summary Background Designs. This is a two stage process. The stages in this process are Radar Chart, Finance, Marketing, Strategy, Analysis, Business.
-
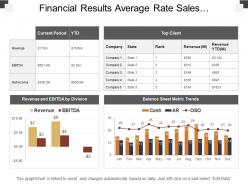 Financial results average rate sales opportunities ppt
Presenting financial results average rate sales opportunities Presentation design with editing options. Amazing picture quality as pixels doesn’t break even on large display. PowerPoint slide can be displayed in standard and widescreen view. Preference personalizes the presentation with business credentials. Similar designs available with different nodes and stages. Easy download and transform into another format such as JPEG and PDF. PPT template works well with Google slides and can be shared easily whenever required.
-
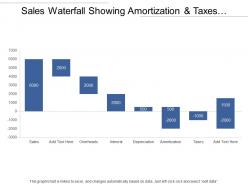 Sales waterfall showing amortization and taxes with negative values
Presenting this set of slides with name - Sales Waterfall Showing Amortization And Taxes With Negative Values. This is a eight stage process. The stages in this process are Sales Waterfall, Waterfall Chart.
-
 Workers leaving by time from home to go to work for females in us from 2015-17
Presenting this set of slides with name - Workers Leaving By Time From Home To Go To Work For Females In US From 2015-17. Workers By Time Leaving Home To Go To Work For Females In The U.S From 2015 to 17. This is part of our Data and Statistics products selection, and you will need a Paid account to download the actual report with accurate data. Downloaded report will contain the actual editable graph with the actual data, an excel table with the actual data, the exact source of the data and the release date. This graph shows the workers by time 12.00 a.m to 11.59 p.m leaving home to go to work for females in the U.S from the years 2015 to 17. It covers topic Workers by time leaving home to go to work for females for region USA and is for date range 2015 to 17. Download it immediately and use it for your business.
-
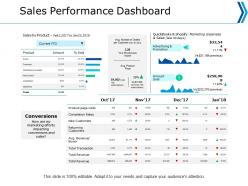 Sales performance dashboard marketing ppt powerpoint presentation professional background images
Presenting this set of slides with name - Sales Performance Dashboard Marketing Ppt Powerpoint Presentation Professional Background Images. This is a four stage process. The stages in this process are Finance, Analysis, Business, Investment, Marketing.
-
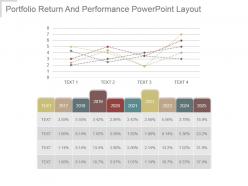 Portfolio return and performance powerpoint layout
Presenting portfolio return and performance powerpoint layout. This is a portfolio return and performance powerpoint layout. This is a nine stage process. The stages in this process are years, planning, business, finance, marketing.
-
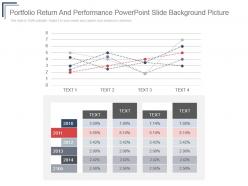 Portfolio return and performance powerpoint slide background picture
Presenting portfolio return and performance powerpoint slide background picture. This is a portfolio return and performance powerpoint slide background picture. This is a four stage process. The stages in this process are years, planning, presentation, business, marketing.
-
 Comparison stats trend line powerpoint templates
Presenting comparison stats trend line PowerPoint templates PPT slide. You can download the slide and save into JPG & PDF format and can also display in the standard & widescreen view. You may even do alteration in the slide such as color, text, font type, font size and aspect ratio. The template gets synced with Google Slides and editable in PowerPoint. You may share this slide with large segment because it has tremendous pixel quality. You can insert the relevant content in text placeholder of the template.
-
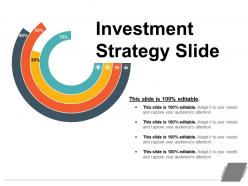 Investment strategy slide powerpoint presentation
Presenting investment strategy PowerPoint slide. The PPT template is convenient to use for the business analyst, investors, management students, professionals etc. The divergent features of this Presentation graphic are 100% revamp able such as the font, font size, colors, designs, words etc. This PPT graphic can be easily fabricated into PDF or JPG file forms. The PPT image diagram is also well versant with all software applications and Google Slides.
-
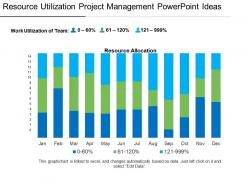 Resource utilization project management powerpoint ideas
Presenting resource utilization project management PowerPoint ideas design template. PPT can be used in business and project management related slideshows. Fully amendable slideshow can easily be changed by anyone. Insert business logo, trademarks to personalize the design. PPT can be opened with Google Slides and PowerPoint. You can access the design on normal and full screen views. Easy and swift downloading is available.
-
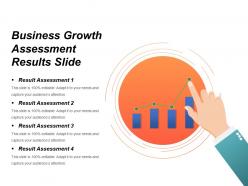 Business growth assessment results slide powerpoint graphics
Introducing business growth assessment PPT slide. The Presentation image is articulate and useful for the understudies, analysts, experts from different fields. The essential features of this PowerPoint diagram enable you to alter the appearance, design, text, shade and more. This PPT diagram even provides enough scope to embed the title or captions separately. This Presentation template is also well familiar with all Google Slides and other operating applications.
-
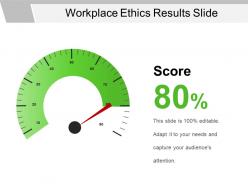 Workplace ethics results slide powerpoint slide show
Presenting Workplace Ethics Results Slide PowerPoint Slide Show.. A presenter can easily edit all kind of feature or even text of this business ethics slide as per his requirement. You can modify the font size, font color & font style of this slide. This template is completely compatible with Google Slides. You can make changes in the graphical illustrations, aspect ratio, color of the workplace ethics template because the template is 100% customizable. Download this slide in JPG and PDF format .
-
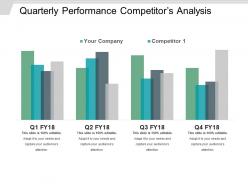 Quarterly performance competitors analysis powerpoint graphics
Presenting Quarterly performance competitors analysis PowerPoint slide. They are informational and adorned PPT formats useful for the business experts. They remain its high caliber even when anticipated on the wide screen .These PowerPoint designs can be effectively exportable into PDF or JPG file frames. They can be effectively utilized with Google Slides and different applications. They have amend able highlights like shading, content, images, and more.
-
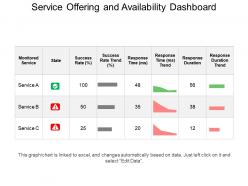 Service Offering And Availability Dashboard Snapshot Ppt Slide
Presenting Service Offering And Availability Dashboard Snapshot PPT Slide. This presentation is professionally designed. You can modify the font type, size, diagram color, and background color. The slideshow is also compatible with Google Slides and can be saved in image formats such as JPG or document formats such as PDF without any difficulty. High-quality graphics and icons ensure that there is no deterioration in quality.
-
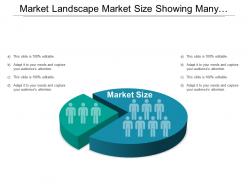 Market landscape market size showing many silhouette segments
Presenting this set of slides with name - Market Landscape Market Size Showing Many Silhouette Segments. This is a two stage process. The stages in this process are Current Landscape, Competitor Landscape, Market Landscape.
-
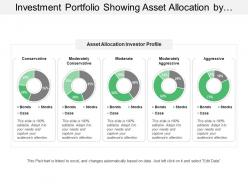 Investment portfolio showing asset allocation by investor profile
Presenting this set of slides with name - Investment Portfolio Showing Asset Allocation By Investor Profile. This is a five stage process. The stages in this process are Investment Portfolio, Funding Portfolio, Expenditure Portfolio.
-
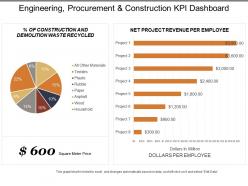 Engineering procurement and construction kpi dashboard showing net project revenue per employee
Presenting this set of slides with name - Engineering Procurement And Construction Kpi Dashboard Showing Net Project Revenue Per Employee. This is a two stage process. The stages in this process are Engineering, Procurement And Construction, Construction Management, Engineering, Purchasing And Construction .
-
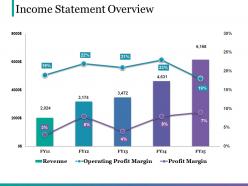 Income statement overview good ppt example
Presenting this set of slides with name - Income Statement Overview Good Ppt Example. This is a five stage process. The stages in this process are Business, Marketing, Strategy, Graph, Finance.
-
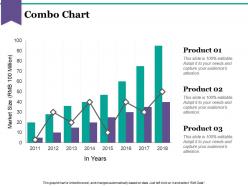 Combo chart ppt model
Presenting this set of slides with name - Combo Chart Ppt Model. This is a three stage process. The stages in this process are Business, Marketing, Finance, Market Size, In Years.
-
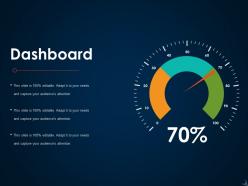 Dashboard Snapshot ppt icon good
Presenting this set of slides with name - Dashboard Snapshot Ppt Icon Good. This is a three stage process. The stages in this process are Business, Marketing, Dashboard, Percentage, Process.
-
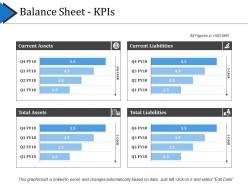 Balance sheet kpis ppt presentation
This PPT has subject specific content which is thoroughly editable. In case of any doubt one may refer to the editing instructions provided along. This easy to download slide template can be converted into any format and can be accessed by means of any trending software. The visuals as used are of high definition and so do not deter in quality when projected on wide screen. Often financial analysts, or managers or auditors make use of balance sheet PPT template for their work.
-
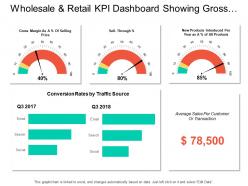 Wholesale and retail kpi dashboard showing gross margin as a percentage of selling price
Presenting this set of slides with name - Wholesale And Retail Kpi Dashboard Showing Gross Margin As A Percentage Of Selling Price. This is a three stage process. The stages in this process are Wholesale And Retail, Extensive And Retail, Wholesale And Distribute.
-
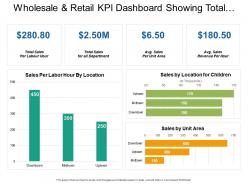 Wholesale and retail kpi dashboard showing total sales per labor hour sales by unit area
Presenting the KPI dashboard template for PowerPoint. This PPT template is 100% customizable in MS PowerPoint and is professionally designed. You can edit the objects in the slide like font size and font color very easily. This presentation template is 100% compatible with Google Slide and can be saved in JPG or PDF file format without any fuss. Click on the download button to download this presentation template.
-
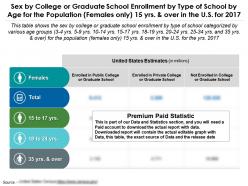 Sex by school enrollment by type of school by age group population females only 15 years over us 2017
Presenting this set of slides with name - Sex By School Enrollment By Type Of School By Age Group Population Females Only 15 Years Over US 2017. Sex By College Or Graduate School Enrollment By Type Of School By Age For The Population Females Only 15 Years And Over In The U.S For 2017. This is part of our Data and Statistics products selection, and you will need a Paid account to download the actual report with accurate data. Downloaded report will contain the actual editable graph with the actual data, an excel table with the actual data, the exact source of the data and the release date. This table shows the sex by college or graduate school enrollment by type of school categorized by various age groups 3 4 years, 5 9 years, 10 14 years, 15 17 years, 18 19 years, 20 24 years, 25 34 years and 35 years and over for the population females only 15 years and over in the U.S for the year 2017. It covers topic School Enrollment for the population 15 years and over by age group for females for region USA and is for date range 2017. Download it immediately and use it for your business.
-
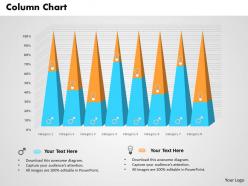 0514 triangular data driven chart for analysis powerpoint slides
We are proud to present our 0514 triangular data driven chart for analysis powerpoint slides. A triangular shape data driven chart is used in this Business power Point template. Use this template for sequential data flow in any presentation.
-
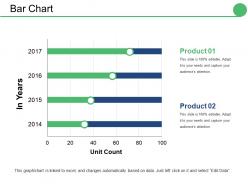 Bar chart ppt file format
Presenting this set of slides with name - Bar Chart Ppt File Format. This is a two stage process. The stages in this process are Product, Unit Count, In Years, Step, Business.
-
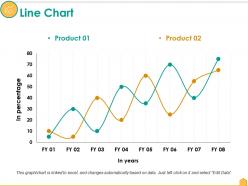 Line chart ppt file slide download
Presenting this set of slides with name - Line Chart Ppt File Slide Download. This is a two stage process. The stages in this process are Product, In Percentage, In Years, Growth, Success.
-
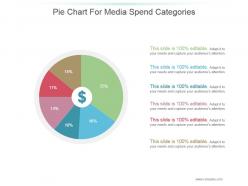 Pie chart for media spend categories presentation portfolio
Presenting pie chart for media spend categories presentation portfolio. This is a pie chart for media spend categories presentation portfolio. This is a six stage process. The stages in this process are business, success, strategy, finance, circular.
-
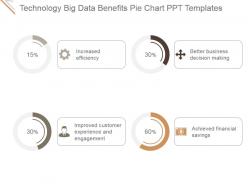 Technology big data benefits pie chart ppt templates
Presenting technology big data benefits pie chart ppt templates. This is a technology big data benefits pie chart ppt templates. This is a four stage process. The stages in this process are increased efficiency, better business decision making, improved customer experience and engagement, achieved financial savings.
-
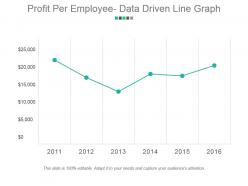 Profit per employee data driven line graph powerpoint slide background image
Presenting profit per employee data driven line graph powerpoint slide background image. This is a profit per employee data driven line graph powerpoint slide background image. This is a six stage process. The stages in this process are profit, employee, graph, line, growth.
-
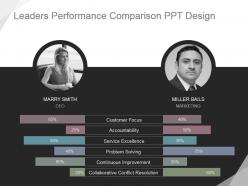 Leaders performance comparison ppt design
Presenting leaders performance comparison ppt design. This is a leaders performance comparison ppt design. This is a two stage process. The stages in this process are marry smith ceo, miller bails marketing, customer focus, accountability, service excellence, problem solving, continuous improvement, collaborative conflict resolution.
-
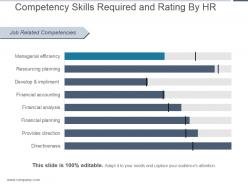 Competency skills required and rating by hr ppt example 2017
Presenting competency skills required and rating by hr ppt example 2017. This is a competency skills required and rating by hr ppt example 2017. This is a eight stage process. The stages in this process are job related competencies, managerial efficiency, resourcing planning, develop and implement, financial accounting, financial analysis, financial planning, provides direction, directiveness.
-
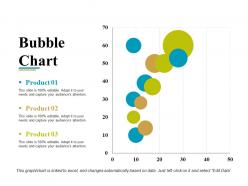 Bubble chart powerpoint slide background designs template 1
Presenting this set of slides with name - Bubble Chart Powerpoint Slide Background Designs Template 1. This is a three stage process. The stages in this process are Business, Marketing, Finance, Chart, Strategy.
-
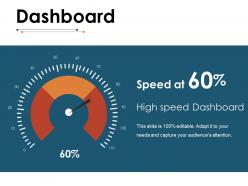 Dashboard snapshot ppt information
Presenting this set of slides with name - Dashboard Snapshot Ppt Information. This is a one stage process. The stages in this process are Dashboard, Percentage, Business, Marketing, Strategy.
-
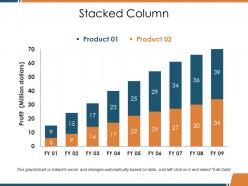 Stacked column ppt background designs
Presenting this set of slides with name - Stacked Column Ppt Background Designs. This is a two stage process. The stages in this process are Profit, Business, Marketing, Graph, Growth.
-
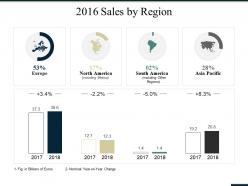 Sales by region ppt summary icons
Presenting this set of slides with name - Sales By Region Ppt Summary Icons. This is a eight stage process. The stages in this process are Europe, North America, South America, Asia Pacific, Business.
-
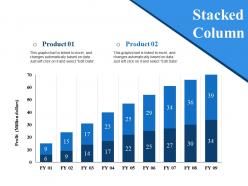 Stacked column ppt styles
Presenting this set of slides with name - Stacked Column Ppt Styles. This is a nine stage process. The stages in this process are Stacked Column, Business, Marketing, Strategy, Management.
-
 2016 sales by region powerpoint slide design templates
Presenting this set of slides with name - 2016 Sales By Region Powerpoint Slide Design Templates. This is a two stage process. The stages in this process are Business, Marketing, Finance, Strategy, Planning.
-
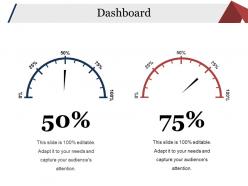 Dashboard snapshot powerpoint templates
Presenting this set of slides with name - Dashboard Snapshot Powerpoint Templates. This is a two stage process. The stages in this process are Meter, Marketing, Finance, Strategy, Dashboard.
-
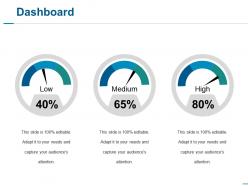 Dashboard snapshot ppt slides clipart
Presenting this set of slides with name - Dashboard Snapshot Ppt Slides Clipart. This is a three stage process. The stages in this process are Low, Dashboard, Percentage, Business, Marketing.
-
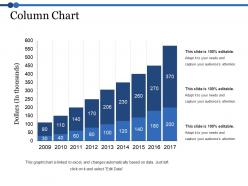 Column chart ppt themes
Presenting this set of slides with name - Column Chart Ppt Themes. This is a nine stage process. The stages in this process are Bar Graph, Finance, Planning, Strategy, Analysis.
-
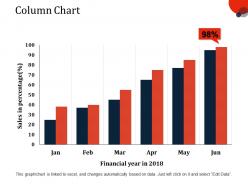 Column chart ppt slides display
Presenting this set of slides with name - Column Chart Ppt Slides Display. This is a six stage process. The stages in this process are Financial In Years, Sales In Percentage, Business, Marketing, Graph.
-
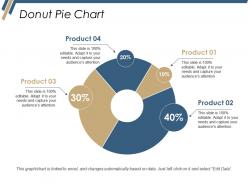 Donut pie chart ppt deck
Presenting this set of slides with name - Donut Pie Chart Ppt Deck. This is a four stage process. The stages in this process are Donut Pie Chart, Finance, Analysis, Management, Business.
-
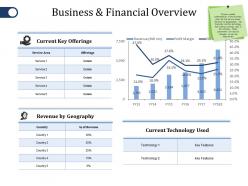 Business and financial overview ppt file model
Presenting this set of slides with name - Business And Financial Overview Ppt File Model. This is a four stage process. The stages in this process are Current Key Offerings, Revenue By Geography, Current Technology Used, Technology.
-
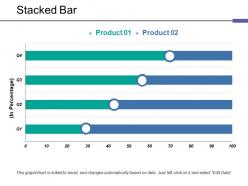 Stacked bar ppt show
Presenting Stacked Ppt Show Presentation Slides. This slide is fully editable. This slide is also compatible with Google Slides and PowerPoint software. It is made up of high-resolution graphics that do not deteriorate the quality when projected on a full screen. Customize the slide as per your needs and wants. It can be viewed on a standard screen and widescreen without any fear of pixelation. It can be easily saved into formats like PDF, JPG, and PNG.
-
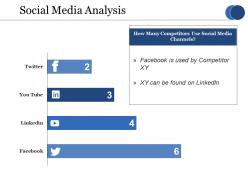 Social media analysis ppt show
Presenting this set of slides with name - Social Media Analysis Ppt Show. This is a four stage process. The stages in this process are Twitter, You Tube, Facebook, Linkedin, Social Media.
-
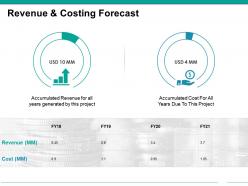 Revenue and costing forecast powerpoint slide images
Presenting this set of slides with name - Revenue And Costing Forecast Powerpoint Slide Images. This is a two stage process. The stages in this process are Business, Marketing, Planning, Finance, Donut.
-
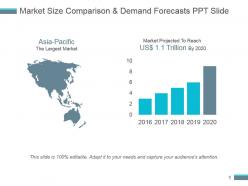 Market size comparison and demand forecasts ppt slide
Presenting market size comparison and demand forecasts ppt slide. This is a market size comparison and demand forecasts ppt slide. This is a two stage process. The stages in this process are asia pacific the largest market, market projected to reach.
-
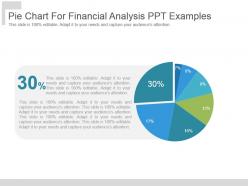 Pie chart for financial analysis ppt examples
Presenting pie chart for financial analysis ppt examples. This is a pie chart for financial analysis ppt examples. This is a seven stage process. The stages in this process are business, marketing, strategy, management, success.
-
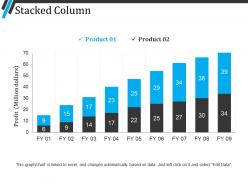 Stacked column powerpoint guide
Presenting stacked column powerpoint guide. This is a stacked column powerpoint guide. This is a two stage process. The stages in this process are stacked column, finance, marketing, strategy, analysis, business.
-
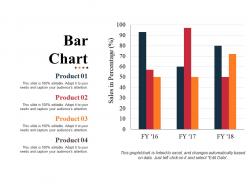 Bar chart example of ppt presentation
Presenting Bar Chart Example Of PPT Presentation. Our PPT layout is compatible with Google Slides. You can download this PPT theme in various formats like PDF, PNG, and JPG. This PowerPoint template is completely editable and you can modify the font size, font type, and shapes as per your requirements. This PPT slide is available in 4:3 and 16:9 aspect ratios.
-
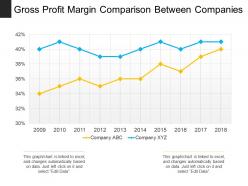 Gross profit margin comparison between companies
Presenting Gross Profit Margin Comparison Between Companies PPT theme which is fully customizable. This template is adaptable with Google Slides, which makes it accessible at once. You can change the colors, fonts, font size, and font types of the template as per the requirements. It can be converted into formats like PDF, JPG, and PNG. The slide is readily available in both 4:3 and 16:9 aspect ratio.


