- Sub Categories
-
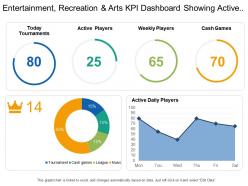 Entertainment recreation and arts kpi dashboard showing active daily players and today tournaments
Presenting this set of slides with name - Entertainment Recreation And Arts Kpi Dashboard Showing Active Daily Players And Today Tournaments. This is a four stage process. The stages in this process are Entertainment, Recreation And Arts, Attractions, Culture, Entertainment.
-
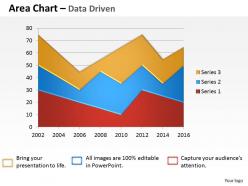 Data driven visualization area chart powerpoint slides
We are proud to present our data driven visualization area chart powerpoint slides. This PowerPoint chart helps people understand data quickly. Whether you want to make a comparison, show a relationship, or highlight a trend, it helps your audience to see what you are talking about.
-
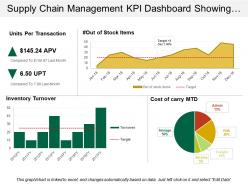 Supply chain management kpi dashboard showing units per transaction
Presenting predesigned Supply Chain Management KPI Dashboard Showing Warehouse Operating Costs PPT slide. Download of the template design is simple. You can modify the layout font type, font size, colors and the background as per needs. Template slide is fully flexible with Google Slides and other online software’s. You can alter the design using the instructional slides provided with the template. You can remove the watermark with your brand name, trademark, signature or logo. You can save the template into PNG or JPEG formats. Supreme quality layouts are used to create this template which is editable in PowerPoint. Sample content can be replaced with your presentation content.
-
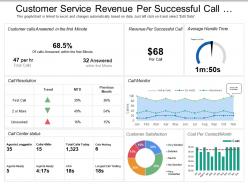 Customer service revenue per successful call dashboard
Presenting this set of slides with name - Customer Service Revenue Per Successful Call Dashboard. This is a three stage process. The stages in this process are Customer Base, Recurring Customers, Customer Services.
-
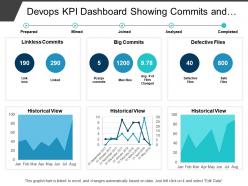 Devops kpi dashboard showing commits and defective files
Presenting this set of slides with name - Devops Kpi Dashboard Showing Commits And Defective Files. This is a six stage process. The stages in this process are Development And Operations, Devops.
-
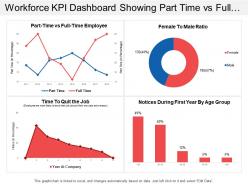 Workforce kpi dashboard showing part time vs full time employee
Presenting this set of slides with name - Workforce Kpi Dashboard Showing Part Time Vs Full Time Employee. This is a four stage process. The stages in this process are Staff, Personnel, Workforce.
-
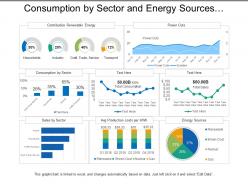 Consumption by sector and energy sources utilities dashboard
Presenting this set of slides with name - Consumption By Sector And Energy Sources Utilities Dashboard. This is a three stage process. The stages in this process are Utilities, Use, Advantage.
-
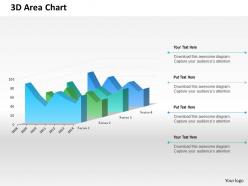 0514 3d unique area data driven chart powerpoint slides
Pixel-rich quality of the images and the graphics in the slides. Allow instant downloading and saving of the slide design. Visually appealing content and the slide graphics. Compatible with the Google Slides and other offline softwares. Easy to insert the company’s logo or brand name in the background while replacing the traditional watermark. Useful for the marketing professionals, strategy designers and the business entrepreneurs.
-
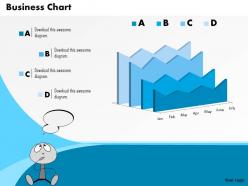 0514 text boxes with business data driven chart powerpoint slides
Presentation slides are fully compatible with Google slides. High resolution quality PowerPoint designs. Completely editable designs and charts to enable customization. PPT slide can be viewed in standard and widescreen view. Option to download design in Microsoft 2010 and 2013. Perfect for finance and operations department in any organization. Modify the size and orientation of presentation visuals to suit your requirement.
-
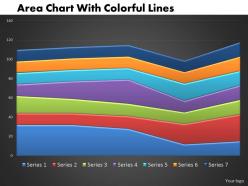 0414 area chart with colorful lines powerpoint graph
High-definition picture quality of the slide icons. Edit the color, change the theme, style and orientation of the slides. Replace the content with your business data. Prompt downloading and saving allowed. PPT design attune well with the Google slides. Use it on a wide display without effecting its quality. Useful for the marketing professionals and the business presenters.
-
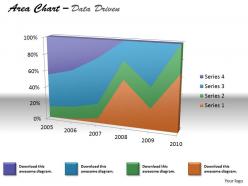 Data driven 3d area chart for various values powerpoint slides
We are proud to present our data driven 3d area chart for various values powerpoint slides. Our Data Driven 3D Area Chart For Various Values Powerpoint slides Power Point Templates Provide You With A Vast Range Of Viable Options. Select The Appropriate Ones And Just Fill In Your Text. Subscribe To Our Data Driven 3D Area Chart For Various Values Powerpoint slides Power Point Templates And Receive Great Value For Your Money. Be Assured Of Finding The Best Projection To Highlight Your Words.
-
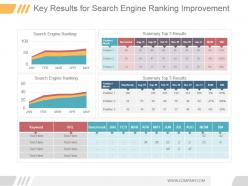 Key results for search engine ranking improvement good ppt example
Presenting key results for search engine ranking improvement good ppt example. This is a key results for search engine ranking improvement good ppt example. This is a three stage process. The stages in this process are search engine ranking, summary top 3 results, jan, feb, mar, apr, may, position month, position, aug, sep, oct, nov, dec, mom, bm, url, keyword.
-
 Customer lifetime value and total mrr sales dashboards
Presenting this set of slides with name - Customer Lifetime Value And Total Mrr Sales Dashboards. This is a three stage process. The stages in this process are Sales Dashboard, Sales Kpis, Sales Performance.
-
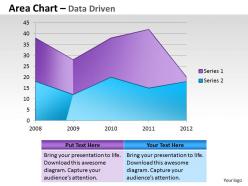 Data driven area chart for showing trends powerpoint slides
We are proud to present our data driven area chart for showing trends powerpoint slides. Tee Off With Our Data Driven Area Chart For Showing Trends Powerpoint Slides Power Point Templates. They Will Reward You With A Hole In One. Launch Your Ideas With Our Data Driven Area Chart For Showing Trends Powerpoint Slides Power Point Templates. Take Your Audience Along On A Magnificent Flight.
-
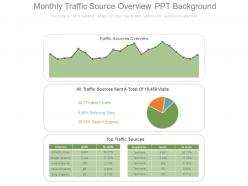 Monthly traffic source overview ppt background
Presenting monthly traffic source overview ppt background. This is a monthly traffic source overview ppt background. This is a four stage process. The stages in this process are traffic sources overview, direct traffic, referring sites, search engines.
-
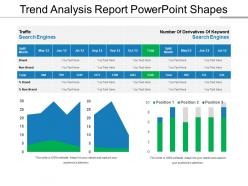 Trend analysis report powerpoint shapes
Presenting Trend Analysis Report PowerPoint Shapes. Customize the slide as per your wants. You are free to change anything in the slide. Modify the colors, background, font type, and font size. It can be transformed and saved in various formats like JPG, PNG, PDF, and JPEG. The slide goes well with the Google Slides and major Microsoft versions. It can be viewed on standard screen size and widescreen size as well.
-
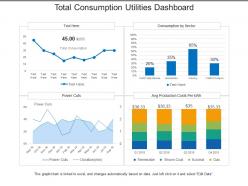 Total consumption utilities dashboard
Presenting this set of slides with name - Total Consumption Utilities Dashboard. This is a four stage process. The stages in this process are Utilities, Use, Advantage.
-
 Insurance total claims per year and month dashboard
• Bright colors and clarity in graphics • Thoroughly editable slides • Ease of editing the slides with the help of instructions provided. • Easy to download • Comfortably customizable • Of much help to financial analysts, insurance company employees, students and teachers. • High resolution of slide visuals do not let the image pixelate when projected on wide screen • Compatible with latest software options and multiple format types.
-
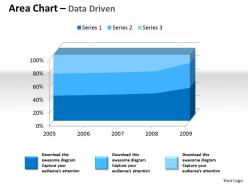 Data driven 3d area chart for quantiative data powerpoint slides
Template formats are altogether impeccable with Google slides. Respectable and straightforward into practical setup. Templates can be downloaded and saved into JPEG and PDF report. Determination to implant business name, logo or sign as per the need. Adaptable to share in widescreen see as pixels don't break. Comparative diagrams open with different centers and stages as required. Simple to adjust shading, content, content style and even shape. Useful for business experts, strategists, and corporate organization trend-setters.
-
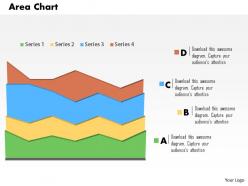 0514 area chart for data driven analysis powerpoint slides
We are proud to present our 0514 area chart for data driven analysis powerpoint slides. A unique area data driven chart is used in this Business power Point template. Use this template for sequential data flow in any presentation. Go ahead use this template in your business presentation.
-
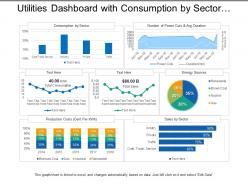 Utilities dashboard with consumption by sector and energy sources
Presenting this set of slides with name - Utilities Dashboard With Consumption By Sector And Energy Sources. This is a three stage process. The stages in this process are Utilities, Use, Advantage.
-
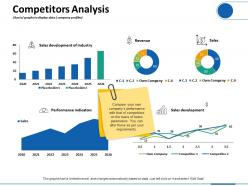 Competitors analysis charts graphs to display data company profiles
Presenting this set of slides with name - Competitors Analysis Charts Graphs To Display Data Company Profiles. This is a five stage process. The stages in this process are Revenue, Sales Development, Performance Indicators, Finance, Marketing.
-
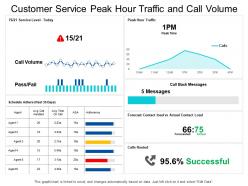 Customer service peak hour traffic and call volume dashboard
Showcasing customer service peak hour traffic and call volume dashboard PowerPoint template slide. This template slide is completely flexible with Google Slide. You can alter the hues, text style, font size of the slide data as per need. The slide is quick to download and can be saved in PDF, and JPEG formats. For guidance, additional educational slides are provided. Best quality graphics are utilized. The quality of the slide graphics does not blur when displayed on a broad screen. Dummy data can be added with other valuable content. You can personalize the slide by adding your organization name, and signature.
-
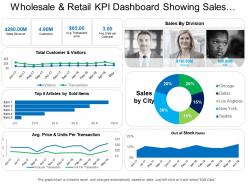 Wholesale and retail kpi dashboard showing sales revenue customers and out of stock items
Presenting the KPI dashboard presentation template. This PPT template is 100% customizable in MS PowerPoint and is designed under the strict supervision of professionals. The user can edit the objects in the slide like font size and font color without any hassle. This presentation template is 100% compatible with Google Slide and can be saved in JPG or PDF file format easily. Click on the download tab to download this presentation template.
-
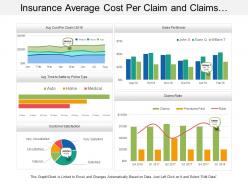 Insurance average cost per claim and claims ratio dashboard
Presenting this set of slides with name - Insurance Average Cost Per Claim And Claims Ratio Dashboard. This is a five stage process. The stages in this process are Assurance, Surety, Insurance.
-
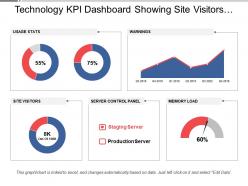 Technology kpi dashboard snapshot showing site visitors and server control panel
Showcasing technology KPI dashboard presentation slide that comes with editing options. PowerPoint design can be downloaded with different nodes and stages. Completely modifiable design as fonts, text, colors can be edited. Customize the presentation by adding trade information i.e. name, logo, icon and tagline. Simple and fast download. Easy convert into PDF or JPG formats. Works well with Google slides. PPT template is easy to share among large set of audience.
-
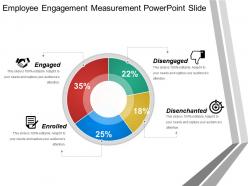 Employee engagement measurement powerpoint slide
Presenting employee engagement measurement PowerPoint slide. This layout is fully compatible with Google slides and data driven. User can edit the data in linked excel sheet and graphs and charts gets customized accordingly. Easy to put in company logo, trademark or name; accommodate words to support the key points. Images do no distort out even when they are projected on large screen. Adjust colors, text and fonts as per your business requirements.
-
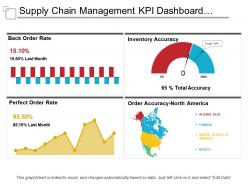 Supply chain management kpi dashboard showing back order rate and order accuracy
Presenting this set of slides with name - Supply Chain Management Kpi Dashboard Showing Back Order Rate And Order Accuracy. This is a four stage process. The stages in this process are Demand Forecasting, Predicting Future Demand, Supply Chain Management.
-
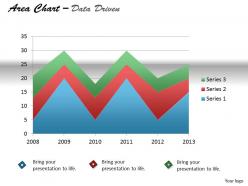 Data driven display series with area chart powerpoint slides
We are proud to present our data driven display series with area chart powerpoint slides. Our Data Driven Display Series With Area Chart Powerpoint slides Power Point Templates Are Creatively Constructed And Eye Catching. Focus Attention On The Key Issues Of Your Presentation. Use Our Data Driven Display Series With Area Chart Powerpoint slides Power Point Templates And Nail The Day. Lead Your Team Show Them The Way.
-
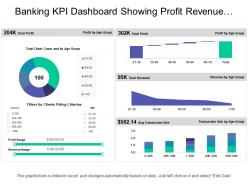 Banking kpi dashboard showing profit revenue transaction size
Presenting this set of slides with name - Banking Kpi Dashboard Showing Profit Revenue Transaction Size. This is a five stage process. The stages in this process are Banking, Finance, Money.
-
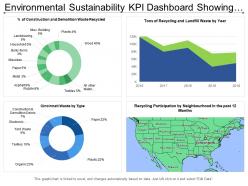 Environmental sustainability kpi dashboard showing recycling participation by neighborhood
Presenting this set of slides with name - Environmental Sustainability Kpi Dashboard Showing Recycling Participation By Neighborhood. This is a four stage process. The stages in this process are Environment Sustainability, Environment Continual, Environment Feasibility.
-
 Data driven analyzing of relationship chart powerpoint slides
We are proud to present our data driven analyzing of relationship chart powerpoint slides. Bet On Your Luck With Our Data Driven Analyzing Of Relationship Chart Powerpoint Slides Power Point Templates. Be Assured That You Will Hit The Jackpot. Let Our Data Driven Analyzing Of Relationship Chart Powerpoint Slides Power Point Templates Be The String Of Your Bow. Fire Of Your Ideas And Conquer The Podium.
-
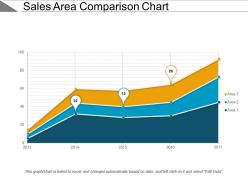 Sales area comparison chart powerpoint slide backgrounds
This uniquely designed PPT template can instantly be downloaded and converted into JPEG and PDF formats. You can open the PPT design with Google Slides and MS PowerPoint software. Design allows full editing. You can change the design components such as the font type, color, size, shape, style according to your business preferences. Design can be viewed on both standard and full screen design views.
-
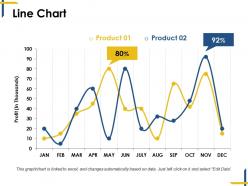 Line chart ppt diagrams
Presenting this set of slides with name - Line Chart Ppt Diagrams. This is a two stage process. The stages in this process are Growth, Finance, Analysis, Business, Marketing.
-
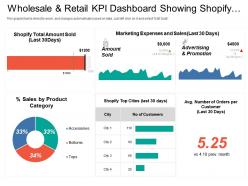 Wholesale and retail kpi dashboard showing shopify total amount sold percentage sales by product category
Presenting the retail business presentation template for PowerPoint. This PowerPoint template is 100% editable in PowerPoint and is professionally designed. You can edit the objects in the slide like font size and font color very easily. This presentation template is 100% compatible with Google Slide and can be saved in JPG or PDF file format without any fuss. Fast download this at the click of the button.
-
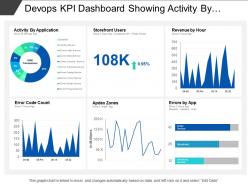 Devops kpi dashboard showing activity by application and errors by app
Presenting this set of slides with name - Devops Kpi Dashboard Showing Activity By Application And Errors By App. This is a six stage process. The stages in this process are Development And Operations, Devops.
-
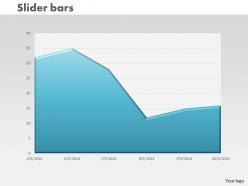 0414 slider area chart to present data powerpoint graph
We are proud to present our 0414 slider area chart to present data powerpoint graph. Deadlines are an element of todays workplace. Our Slider Area Chart To Present Data Powerpoint Graph Powerpoint Templates help you meet the demand. Just browse and pick the slides that appeal to your intuitive senses. Our Slider Area Chart To Present Data Powerpoint Graph Powerpoint Templates will help you be quick off the draw. Just enter your specific text and see your points hit home.
-
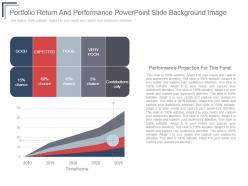 Portfolio return and performance powerpoint slide background image
Presenting portfolio return and performance powerpoint slide background image. This is a portfolio return and performance powerpoint slide background image. This is a five stage process. The stages in this process are good, expected, poor, very poor, contributions only.
-
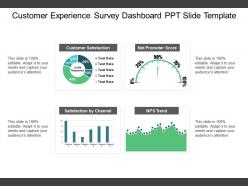 Customer experience survey dashboard ppt slide template
Presenting customer experience survey dashboard ppt slide template. This is a customer experience survey dashboard ppt slide template. This is a four stage process. The stages in this process are survey, forecasting, statistics.
-
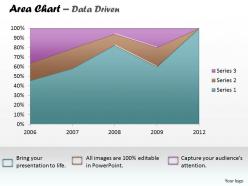 Data driven business reporting area chart powerpoint slides
We are proud to present our data driven business reporting area chart powerpoint slides. Let Our Data Driven Business Reporting Area Chart Powerpoint slides Power Point Templates Be The Vehicle Of Your Successful Journey. Ride The Bus To Glory With Your Grand Ideas. Our Data Driven Business Reporting Area Chart Powerpoint slides Power Point Templates Are Like A Basic Christmas Tree. Decorate It With Your Beautiful Thoughts And Spread Joy And Happiness.
-
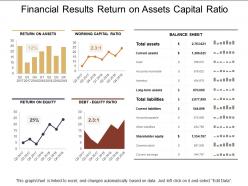 Financial results return on assets capital ratio
Sharing financial results return on assets capital ratio presentation slide. PowerPoint design can be downloaded and save into JPG and PDF format. PPT template can be downloaded in standard and widescreen view. Fully compliant slide design with Google slides. Easy to edit as color, text and font can be amended. Perfect to share business communication as pixels don’t break even when shared on large screen. Presentation graphic can be accessed with different nodes and stages.
-
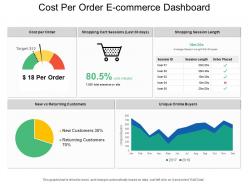 Cost per order e commerce dashboard
Presenting this set of slides with name - Cost Per Order E Commerce Dashboard. This is a five stage process. The stages in this process are Mercantilism, Commercialism, Ecommerce.
-
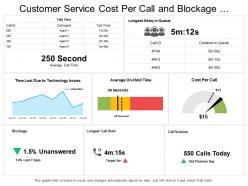 Customer service cost per call and blockage dashboard
This layout slide is completely flexible with Google Slide. You can alter the shading, content style, text dimension of the layout content according to require. The layout is anything but difficult to download and can be spared in PDF, and JPEG designs. For direction, extra instructional slides are accessible. Unrivalled quality illustrations are utilized. The nature of the slide picture does not obscure when seen on a huge screen. Sham substance can be supplanted with other important data. You can customize the format by including your organization name, and mark.
-
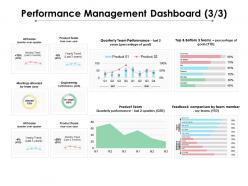 Performance management dashboard 3 3 ppt powerpoint presentation show background images
Presenting this set of slides with name - Performance Management Dashboard 3 3 Ppt Powerpoint Presentation Show Background Images. This is a four stage process. The stages in this process are Finance, Business, Marketing, Management, Analysis.
-
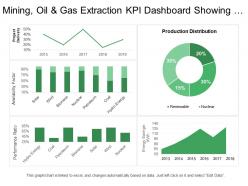 Mining oil and gas extraction kpi dashboard showing project delivery and availability factor
Presenting this set of slides with name - Mining Oil And Gas Extraction Kpi Dashboard Showing Project Delivery And Availability Factor. This is a four stage process. The stages in this process are Mining, Oil And Gas Extraction, Refinery, Natural Gas.
-
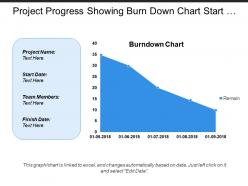 Project progress showing burn down chart start and finish date
Presenting this set of slides with name - Project Progress Showing Burn Down Chart Start And Finish Date. This is a one stage process. The stages in this process are Project Progress, Project Growth, Project Management.
-
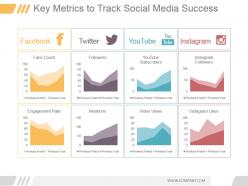 Key metrics to track social media success ppt diagrams
Presenting key metrics to track social media success ppt diagrams. This is a key metrics to track social media success ppt diagrams. This is a four stage process. The stages in this process are facebook, twitter, youtube, instagram, fans count, followers, youtube subscriber, instagram followers, engagement rate, mentions, video views, instagram, previous periods, previous year.
-
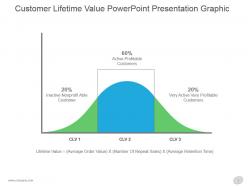 Customer lifetime value powerpoint presentation graphic
Presenting customer lifetime value powerpoint presentation graphic. This is a customer lifetime value powerpoint presentation graphic. This is a three stage process. The stages in this process are clv, lifetime value average order value number of repeat sales average retention time, inactive non profitable customer, active profitable customers, very active very profitable customers.
-
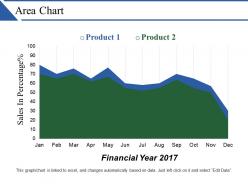 Area chart powerpoint layout
Presenting Area Chart PowerPoint Layout. This slide is completely editable. The slide is readily available in both widescreen and standard screen aspect ratios. It is compatible with Google Slides, which makes it accessible at once. Make as many changes as you want on the slide without any trouble. You can alter the colors, fonts, font size, and font types of the template as per the requirements. open and save your presentation into formats like PDF, JPG, and PNG with ease.
-
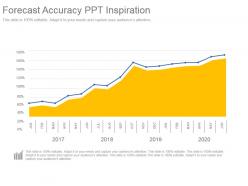 Forecast accuracy ppt inspiration
Presenting forecast accuracy ppt inspiration. This is a forecast accuracy ppt inspiration. This is a one stage process. The stages in this process are jan, feb, mar, apr, may, jun, jul, aug, sep, oct, nov, dec.
-
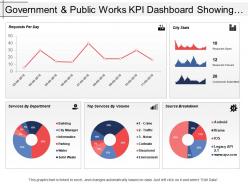 Government and public works kpi dashboard showing requests per day and city stats
Presenting this set of slides with name - Government And Public Works Kpi Dashboard Showing Requests Per Day And City Stats. This is a five stage process. The stages in this process are Government And Public Works, Government And Public Tasks.
-
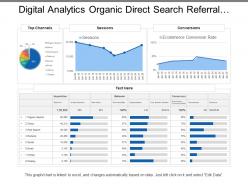 Digital analytics organic direct search referral social
Presenting this set of slides with name - Digital Analytics Organic Direct Search Referral Social. This is a five stage process. The stages in this process are Digital Analytics, Digital Dashboard, Digital Kpis.
-
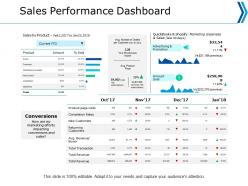 Sales performance dashboard marketing ppt powerpoint presentation professional background images
Presenting this set of slides with name - Sales Performance Dashboard Marketing Ppt Powerpoint Presentation Professional Background Images. This is a four stage process. The stages in this process are Finance, Analysis, Business, Investment, Marketing.
-
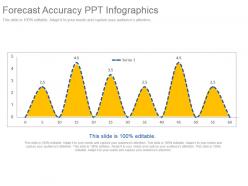 Forecast accuracy ppt infographics
Presenting forecast accuracy ppt infographics. This is a forecast accuracy ppt infographics. This is a six stage process. The stages in this process are series.
-
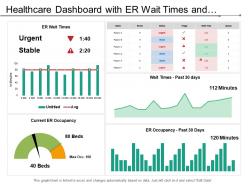 Healthcare dashboard with er wait times and patient in er
Presenting this set of slides with name - Healthcare Dashboard With Er Wait Times And Patient In Er. This is a five stage process. The stages in this process are Healthcare, Health Improvement, Medical Care.
-
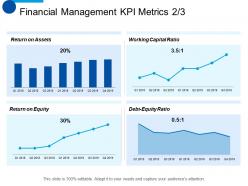 Financial management kpi metrics planning ppt summary background images
Presenting this set of slides with name - Financial Management KPI Metrics Planning Ppt Summary Background Images. This is a four stage process. The stages in this process are Return On Assets, Return On Equity, Working Capital Ratio, Finance, Planning.
-
 Market size info graphic powerpoint slide
Presenting market size info graphic powerpoint slide. This is a market size info graphic powerpoint slide. This is a two stage process. The stages in this process are market projected to reach, asia pacific, the largest market.
-
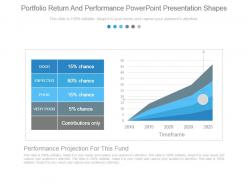 Portfolio return and performance powerpoint presentation shapes
Presenting portfolio return and performance powerpoint presentation shapes. This is a portfolio return and performance powerpoint presentation shapes. This is a two stage process. The stages in this process are good, expected, poor, very poor, contributions only, timeframe.
-
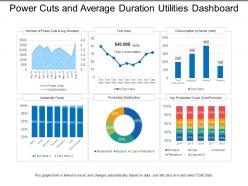 Power cuts and average duration utilities dashboard
Presenting this set of slides with name - Power Cuts And Average Duration Utilities Dashboard. This is a six stage process. The stages in this process are Utilities, Use, Advantage.
-
 Market trends report editable powerpoint chart
Presenting market trends report editable powerpoint chart. This is a market trends report editable powerpoint chart. This is a four stage process. The stages in this process are years, timeline, process, business, marketing.


