- Sub Categories
-
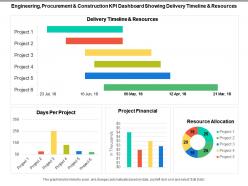 Engineering procurement and construction kpi dashboard showing delivery timeline and resources
Presenting this set of slides with name - Engineering Procurement And Construction Kpi Dashboard Showing Delivery Timeline And Resources. This is a four stage process. The stages in this process are Engineering, Procurement And Construction, Construction Management, Engineering, Purchasing And Construction .
-
 Insurance total claims per year and month dashboard
• Bright colors and clarity in graphics • Thoroughly editable slides • Ease of editing the slides with the help of instructions provided. • Easy to download • Comfortably customizable • Of much help to financial analysts, insurance company employees, students and teachers. • High resolution of slide visuals do not let the image pixelate when projected on wide screen • Compatible with latest software options and multiple format types.
-
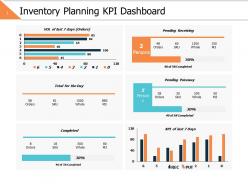 Inventory planning kpi dashboard ppt powerpoint presentation file clipart images
Presenting this set of slides with name - Inventory Planning Kpi Dashboard Ppt Powerpoint Presentation File Clipart Images. This is a six stage process. The stages in this process are Business, Management, Strategy, Analysis, Finance.
-
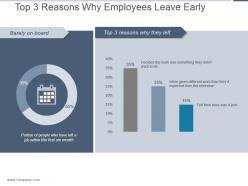 Top 3 reasons why employees leave early sample of ppt
Presenting top 3 reasons why employees leave early sample of ppt. This is a top 3 reasons why employees leave early sample of ppt. This is a two stage process. The stages in this process are decided the work was something they didnt want to do, were given different work than they expected from the interview, felt their boss was a jerk, top 3 reasons why they left, barely on board, portion of people who have left a job within the first six month.
-
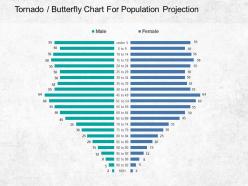 Tornado butterfly chart for population projection powerpoint ideas
Presenting tornado butterfly chart for population projection PowerPoint ideas PPT slide. Presentation is brimming with aesthetic appeal and professional parameters. It’s an uncluttered and intense projection of relevant visuals. Harmonious use of PPT icons, colors, fonts and designs with respect to the subject. There is freedom to execute changes in slide background as per the individual’s preference and flexibility to customize it with company-specific elements like name, logo, and trademark. PPT ensures compatibility with multiple software and format options. There is the use of high resolution and stupendous quality visuals. Used by several business strategists, stakeholders, managers, students, financiers, sales professionals, and entrepreneurs.
-
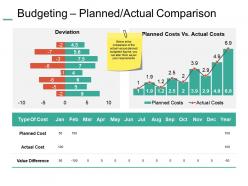 Budgeting planned actual comparison ppt summary example introduction
Presenting Budgeting Planned Actual Comparison PPT Summary Example Introduction. Customize it as per your presentation theme by changing its colors, font type, and font size. You are free to make alterations in the background as well. Convert and save it in JPG, PNG, PDF, and various other file formats. Present it in front of a large segment because of its splendid pixel quality. Its adaptability with the Google Slides makes it accessible at once.
-
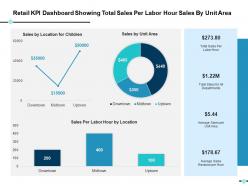 Retail kpi dashboard showing total sales per labor hour sales by unit area ppt slides gallery
Presenting this set of slides with name - Retail Kpi Dashboard Showing Total Sales Per Labor Hour Sales By Unit Area Ppt Slides Gallery. This is a three stage process. The stages in this process are Business, Management, Strategy, Analysis, Marketing.
-
 Gross margin improvement powerpoint templates
Presenting gross margin improvement powerpoint templates. Presenting gross margin improvement powerpoint templates. Presenting gross margin improvement powerpoint templates. This is a gross margin improvement powerpoint templates. This is two stage process. The stages in this process are chart title, gross margin, improvement, strategy, business, success, finance.
-
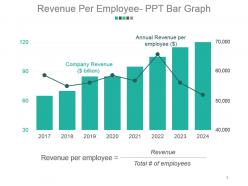 Revenue per employee ppt bar graph powerpoint slide background image
Presenting revenue per employee ppt bar graph powerpoint slide background image. This is a revenue per employee ppt bar graph powerpoint slide background image. This is a eight stage process. The stages in this process are annual revenue per employee, company revenue, revenue per employee, revenue, total number of employees.
-
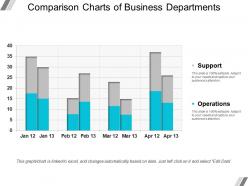 Comparison charts of business departments powerpoint slide themes
Presenting, with our comparison charts of business departments powerpoint slide themes pre-designed flat design for your business comparison plans. We have shown an excellent use of icons, images, and designs. Fit for use by managers, employees, and organizations for professional activity and comparing various parameters. Thoroughly compatible with Google Slides and can be saved in jpg or pdf format without any trouble. We have shown high-quality graphics and icons to ensure that there is no depreciating in quality on increasing their size or editing the design. Download quickly to save time.
-
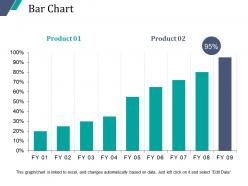 Bar chart sample ppt presentation
Presenting Bar Chart Sample Ppt Presentation Presentation. Our PPT layout is compatible with Google Slides. You can download this PPT theme in various formats like PDF, PNG, and JPG. This PowerPoint template is completely editable and you can modify the font size, font type, and shapes as per your requirements. This PPT slide is available at 4:3 and 16:9 aspect ratios.
-
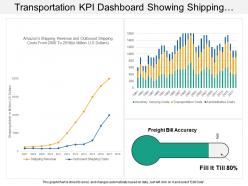 Transportation kpi dashboard showing shipping revenue and outbound shipping costs
Presenting transportation KPI dashboard showing shipping revenue and outbound shipping costs PPT slide. Simple data input like company logo, name or trademark. User can edit the data in linked excel sheet and graphs and charts gets customized accordingly .This PPT slide offers you plenty of space to put in titles and sub titles. High resolution based presentation layout, does not change the image even after resizing. This presentation icon is data driven and template can be downloaded via excel file to incorporate data.
-
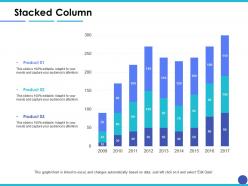 Stacked column finance ppt inspiration example introduction
This is a three stage process. The stages in this process are Stacked Column, Finance, Marketing, Analysis, Business, Investment.
-
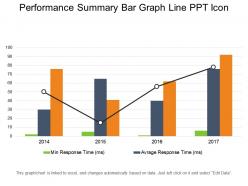 Performance summary bar graph line ppt icon
Presenting the slide named Performance Summary Bar Graph Line PPT Icon. Customize this easy to use template with font colour, font size and font style of your choice. You can easily arrange the bar categories sequentially for best readability. The text in the template can be rewritten. The colour of the background and bar graph can be changed. You can choose from a wide variety of icons that we offer and can replace them in accordance with your purpose. This template is compatible with Google Slides. You can save this slide in both PDF and JPG formats.
-
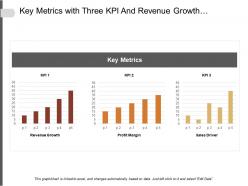 Key metrics with three kpi and revenue growth profit margin and sales driver
Presenting this set of slides with name - Key Metrics With Three Kpi And Revenue Growth Profit Margin And Sales Driver. This is a three stage process. The stages in this process are Key Metrics, Key Performance Indicator, Kpi.
-
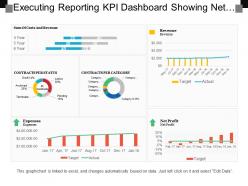 Executing reporting kpi dashboard showing net profit expenses contracts per category
Presenting this set of slides with name - Executing Reporting Kpi Dashboard Showing Net Profit Expenses Contracts Per Category. This is a six stage process. The stages in this process are Executive Reporting, Executive Analysis, Executive Performance.
-
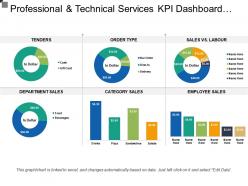 Professional and technical services kpi dashboard showing department sales
Presenting this set of slides with name - Professional And Technical Services Kpi Dashboard Showing Department Sales. This is a six stage process. The stages in this process are Professional And Technical Services, Services Management, Technical Management.
-
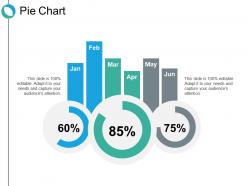 Pie chart ppt show example introduction
Presenting this set of slides with name - Pie Chart Ppt Show Example Introduction. This is a three stage process. The stages in this process are Percentage, Product, Management, Marketing.
-
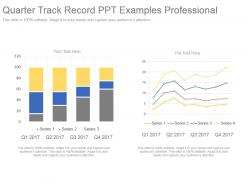 Quarter track record ppt examples professional
Presenting quarter track record ppt examples professional. This is a quarter track record ppt examples professional. This is a four stage process. The stages in this process are series.
-
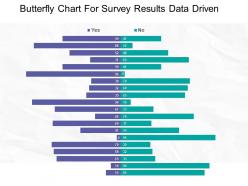 Butterfly chart for survey results data driven example of ppt
Presenting butterfly chart for survey results data-driven example of PPT slide. There is an impressive use of images, color and content parallel to the topic. Professionally equipped and aesthetically designed. PPT is compatible with numerous formats. PowerPoint is harmonious with multiple online and offline software option and is 100 percent editable. Ease of editing with the help of guidance provided for the same. Modify the content as per need. Personalize the presentation with company name, logo and trademark. Used by various students, teachers, IT professionals and entrepreneurs.
-
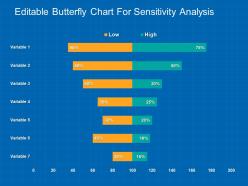 Editable butterfly chart for sensitivity analysis powerpoint guide
Presenting editable butterfly chart for sensitivity analysis PowerPoint guide PPTslide. Well crafted, aesthetically designed and professionally proficient presentation. There is the use of impressive picture quality. High-resolution images do not pixelate when projected on a wide screen. PPT has thoroughly editable slides, so add or erase the content at your personal choice. Personalize the content with company name and logo. It is compatible with multiple online and offline software options. This PPT is harmonious with a large set of format. Used by marketers, stakeholders, strategists, business analysts, and educators.
-
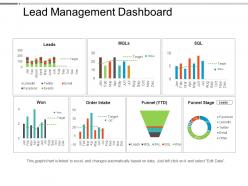 Lead management dashboard snapshot powerpoint slide
This PPT includes 1 dashboard template which can be easily edited as per your preference. The infographic slide can be instantly downloaded just with a click. It is excel linked and data-driven. It can be used by any business organization and management. The image quality does not degrade even if viewed in any size of the screen. Compatible with Google Slides. Available in two slide size designs- Standard and widescreen.
-
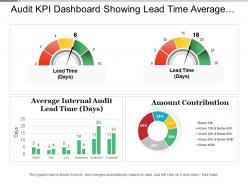 Audit kpi dashboard showing lead time average entry variance and amount contribution
Presenting this set of slides with name - Audit Kpi Dashboard Showing Lead Time Average Entry Variance And Amount Contribution. This is a four stage process. The stages in this process are Audit, Examine, Survey.
-
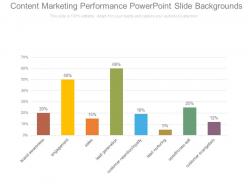 Content marketing performance powerpoint slide backgrounds
Presenting content marketing performance powerpoint slide backgrounds. This is a content marketing performance powerpoint slide backgrounds. This is a eight stage process. The stages in this process are brand awareness, engagement, sales, lead generation, customer retention loyalty, lead nurturing, upsell cross sell, customer evangelism.
-
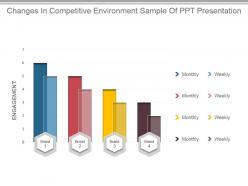 Changes in competitive environment sample of ppt presentation
Presenting changes in competitive environment sample of ppt presentation. Presenting changes in competitive environment sample of ppt presentation. Presenting changes in competitive environment sample of ppt presentation. This is a changes in competitive environment sample of ppt presentation. This is four stage process. The stages in this process are engagement, monthly, brand, weekly.
-
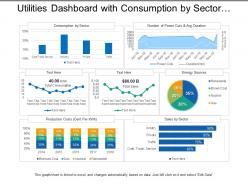 Utilities dashboard with consumption by sector and energy sources
Presenting this set of slides with name - Utilities Dashboard With Consumption By Sector And Energy Sources. This is a three stage process. The stages in this process are Utilities, Use, Advantage.
-
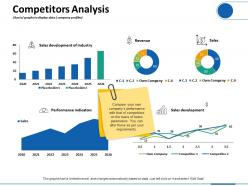 Competitors analysis charts graphs to display data company profiles
Presenting this set of slides with name - Competitors Analysis Charts Graphs To Display Data Company Profiles. This is a five stage process. The stages in this process are Revenue, Sales Development, Performance Indicators, Finance, Marketing.
-
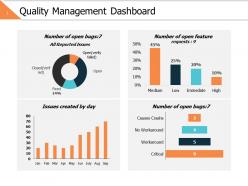 Quality management dashboard ppt powerpoint presentation gallery ideas
Presenting this set of slides with name - Quality Management Dashboard Ppt Powerpoint Presentation Gallery Ideas. This is a four stage process. The stages in this process are Business, Management, Strategy, Analysis, Finance.
-
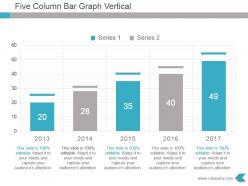 Five column bar graph vertical presentation design
Presenting five column bar graph vertical presentation design. This is a five column bar graph vertical presentation design. This is a five stage process. The stages in this process are series 1, series 2.
-
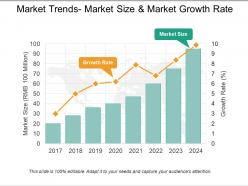 Market trends market size and market growth rate ppt infographics
Presenting market trends market size and market growth rate ppt infographics. This is a market trends market size and market growth rate ppt infographics. This is a eight stage process. The stages in this process are growth rate, market size.
-
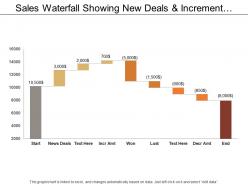 Sales waterfall showing new deals and increment amount
Presenting this set of slides with name - Sales Waterfall Showing New Deals And Increment Amount. This is a nine stage process. The stages in this process are Sales Waterfall, Waterfall Chart.
-
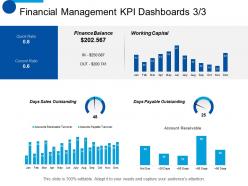 Financial management kpi dashboards business ppt summary smartart
Presenting this set of slides with name - Financial Management KPI Dashboards Business Ppt Summary Smartart. This is a six stage process. The stages in this process are Finance, Analysis, Business, Investment, Marketing.
-
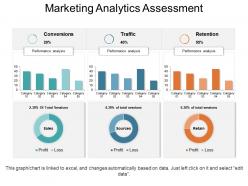 Marketing analytics assessment powerpoint templates
Presenting Marketing Analytics Assessment PowerPoint Templates.The designs are 100% editable in this PowerPoint template. The font size, font color, graphic colors, and slide background can be customized without any hassle. The users can add or remove the images according to their needs. This template includes one slide which is designed by keeping compatibility with Google Slides in mind. It is available in both standard and widescreen.
-
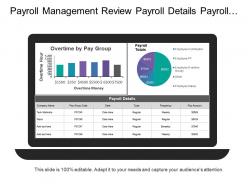 Payroll management review payroll details payroll totals
Presenting this set of slides with name - Payroll Management Review Payroll Details Payroll Totals. This is a one stage process. The stages in this process are Payroll Management, Human Resource Management, Employment Compensation.
-
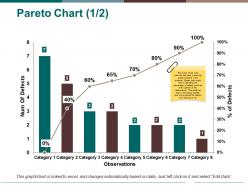 Pareto chart ppt pictures example introduction
Presenting Pareto chart PPT pictures example introduction PPT slide. The Pareto chart picture PowerPoint slide designed professionally by the team of SlideTeam and it is useful for illustrating the count of defects. The Pareto chart introduction template is the data driven template and can edit the count as the Pareto style slide gets linked with the Excel sheet. The graphical Pareto chart picture PPT slide is customizable in PowerPoint and compatible with Google Slide. A presenter can make changes in the visual Pareto chart picture template such as font size, font type, color and dimensions of the charts.
-
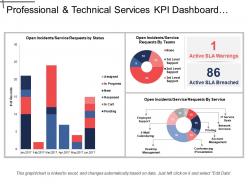 Professional and technical services kpi dashboard showing open incidents and service requests
Presenting this set of slides with name - Professional And Technical Services Kpi Dashboard Showing Open Incidents And Service Requests. This is a three stage process. The stages in this process are Professional And Technical Services, Services Management, Technical Management.
-
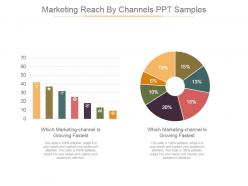 Marketing reach by channels ppt samples
Presenting marketing reach by channels ppt samples. This is a marketing reach by channels ppt samples. This is a seven stage process. The stages in this process are which marketing channel is growing fastest, strategy, financial, business, management.
-
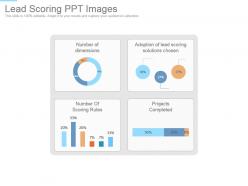 Lead scoring ppt images
Presenting lead scoring ppt images. This is a lead scoring ppt images. This is a four stage process. The stages in this process are adoption of lead scoring solutions chosen, projects completed, number of scoring rules, number of dimensions.
-
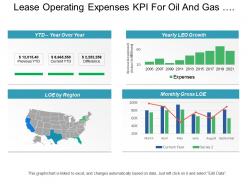 Lease operating expenses kpi for oil and gas industry kpi dashboard
Presenting this set of slides with name - Lease Operating Expenses Kpi For Oil And Gas Industry Kpi Dashboard. This is a four stage process. The stages in this process are Mining, Oil And Gas Extraction, Refinery, Natural Gas.
-
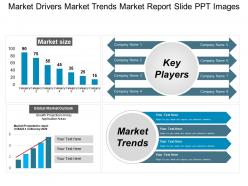 Market drivers market trends market report slide ppt images
Presenting market drivers market trends market report slide PPT images which is fully editable, data driven i.e. excel linked and fast to download. The presenter can customize and personalize this PPT slide it to meet his / her own specifications. This presentation has been designed by plethora of professional expertise. This PowerPoint shape is fully compatible with Google Slides, multiple software and format options. This slideshow can be saved as JPG and / or in PDF. For your kind assistance, editing instructions are also provided. Business analysts, business and sales managers and entrepreneurs picks this PPT.
-
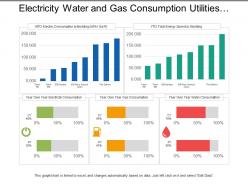 Electricity water and gas consumption utilities dashboard
Presenting this set of slides with name - Electricity Water And Gas Consumption Utilities Dashboard. This is a two stage process. The stages in this process are Utilities, Use, Advantage.
-
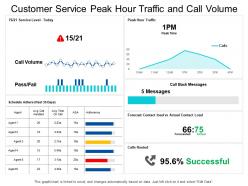 Customer service peak hour traffic and call volume dashboard
Showcasing customer service peak hour traffic and call volume dashboard PowerPoint template slide. This template slide is completely flexible with Google Slide. You can alter the hues, text style, font size of the slide data as per need. The slide is quick to download and can be saved in PDF, and JPEG formats. For guidance, additional educational slides are provided. Best quality graphics are utilized. The quality of the slide graphics does not blur when displayed on a broad screen. Dummy data can be added with other valuable content. You can personalize the slide by adding your organization name, and signature.
-
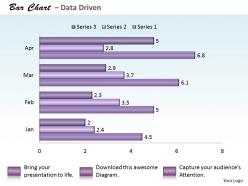 Data driven bar chart for data analysis powerpoint slides
We are proud to present our data driven bar chart for data analysis powerpoint slides. It Takes Two To Tango They Always Say. Partner Our Data Driven Bar Chart For Data Analysis Powerpoint Slides Power Point Templates And Burn The Floor. Your Ideas Will Blossom With Our Data Driven Bar Chart For Data Analysis Powerpoint Slides Power Point Templates. The Fruits Of Your Effort Will Be Sweet Indeed.
-
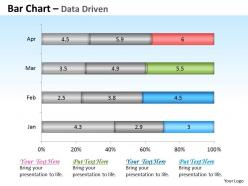 Data driven data base bar chart design powerpoint slides
We are proud to present our data driven data base bar chart design powerpoint slides. Our Data Driven Data Base Bar Chart Design Powerpoint Slides Power Point Templates Are A Sure Bet. Guaranteed To Win Against All Odds. Whip Up A Frenzy With Our Data Driven Data Base Bar Chart Design Powerpoint Slides Power Point Templates. They Will Fuel The Excitement Of Your Team.
-
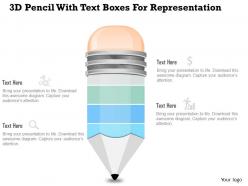 1214 3d pencil with text boxes for representation powerpoint slide
We are proud to present our 1214 3d pencil with text boxes for representation powerpoint slide. Graphic of 3d pencil and text boxes has been used to craft this power point template slide. This PPT contains the concept of data driven educational process analysis. Use this PPT for your data and education related presentations.
-
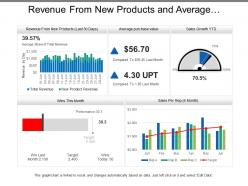 Revenue from new products and average purchase value sales dashboards
Presenting this set of slides with name - Revenue From New Products And Average Purchase Value Sales Dashboards. This is a five stage process. The stages in this process are Sales Dashboard, Sales Kpis, Sales Performance.
-
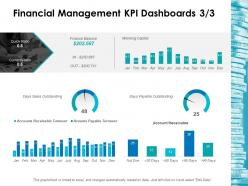 Financial management kpi dashboards 3 3 ppt layouts background images
Presenting this set of slides with name - Financial Management Kpi Dashboards 3 3 Ppt Layouts Background Images. This is a three stage process. The stages in this process are Business, Management, Strategy, Analysis, Marketing.
-
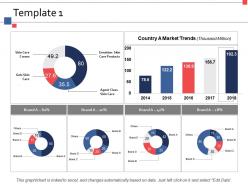 Template 1 ppt inspiration themes
Presenting this set of slides with name - Template 1 Ppt Inspiration Themes. This is a four stage process. The stages in this process are Business, Management, Strategy, Analysis, Marketing.
-
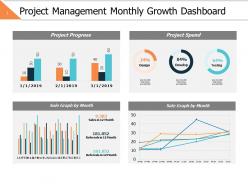 Project management monthly growth dashboard slide2 ppt powerpoint presentation file outfit
Presenting this set of slides with name - Project Management Monthly Growth Dashboard Slide2 Ppt Powerpoint Presentation File Outfit. This is a four stage process. The stages in this process are Business, Management, Strategy, Analysis, Finance.
-
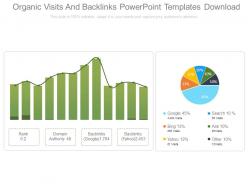 Organic visits and backlinks powerpoint templates download
Presenting organic visits and backlinks powerpoint templates download. This is a organic visits and backlinks powerpoint templates download. This is a six stage process. The stages in this process are rank, domain authority, backlinks, backlinks, yahoo, google, bing, yahoo, search, ask, other.
-
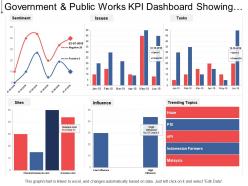 Government and public works kpi dashboard showing sentiment trending topics and issues
Presenting this set of slides with name - Government And Public Works Kpi Dashboard Showing Sentiment Trending Topics And Issues. This is a six stage process. The stages in this process are Government And Public Works, Government And Public Tasks.
-
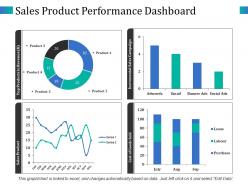 Sales product performance dashboard top products in revenue
Highlighting sales product performance dashboard top products in revenue PowerPoint slide. Easy and convenient downloading by following simple steps. No concession with the quality, once opened on wide screen. Modify and personalize the presentation by including the company name and logo. Guidance for executing the changes has been provided for assistance. Useful for sales leaders, marketers, business professionals, analysts, strategists, students, teachers, etc. Compatible with Microsoft office software and the Google Slides. Available to be saved in jpg or pdf format.
-
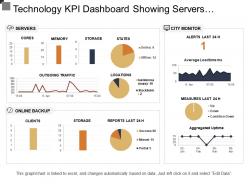 Technology kpi dashboard showing servers online backup and city monitor
Sharing technology KPI dashboard server’s online backup presentation template.PPT design is adjustable with Google slides. Quick to download and can be shared into JPG and PDF format. Fully amendable as color, text and font as elements can be modified. Sharing can be possible on both standard and widescreen. Matching designs are available with different nodes and stages. Ready to use PowerPoint slide are compatible with Google slides and can be merged easily.
-
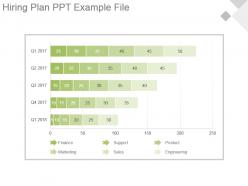 Hiring plan ppt example file
Presenting hiring plan ppt example file. Presenting hiring plan ppt example file. Presenting hiring plan ppt example file. This is a hiring plan ppt example file. This is five stage process. The stages in this process are finance, support, product, marketing, sales, engineering.
-
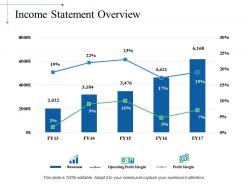 Income statement overview ppt slide themes
Presenting this set of slides with name - Income Statement Overview Ppt Slide Themes. This is a five stage process. The stages in this process are Business, Marketing, Finance, Planning, Analysis.
-
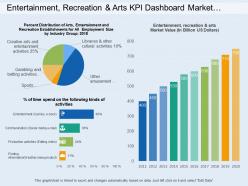 Entertainment recreation and arts kpi dashboard market value and percentage of time spend
Presenting this set of slides with name - Entertainment Recreation And Arts Kpi Dashboard Market Value And Percentage Of Time Spend. This is a three stage process. The stages in this process are Entertainment, Recreation And Arts, Attractions, Culture, Entertainment.
-
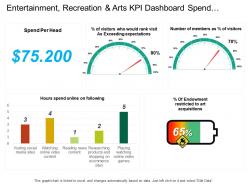 Entertainment recreation and arts kpi dashboard spend per head and hour spend online on social media
Presenting this set of slides with name - Entertainment Recreation And Arts Kpi Dashboard Spend Per Head And Hour Spend Online On Social Media. This is a four stage process. The stages in this process are Entertainment, Recreation And Arts, Attractions, Culture, Entertainment.
-
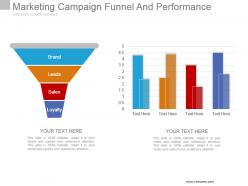 Marketing campaign funnel and performance powerpoint ideas
Presenting marketing campaign funnel and performance powerpoint ideas. This is a marketing campaign funnel and performance powerpoint ideas. This is a four stage process. The stages in this process are brand, leads, sales, loyalty.
-
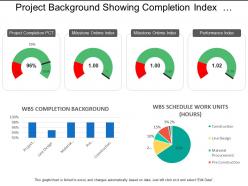 Project background showing completion index and pie chart
Presenting this set of slides with name - Project Background Showing Completion Index And Pie Chart. This is a four stage process. The stages in this process are Project Background, Project Management, Project Description.
-
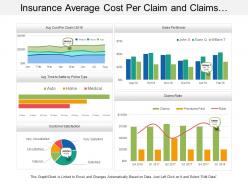 Insurance average cost per claim and claims ratio dashboard
Presenting this set of slides with name - Insurance Average Cost Per Claim And Claims Ratio Dashboard. This is a five stage process. The stages in this process are Assurance, Surety, Insurance.


