- Sub Categories
-
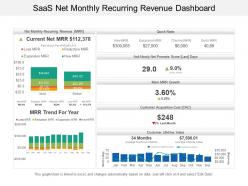 Saas net monthly recurring revenue dashboard
Presenting this set of slides with name - Saas Net Monthly Recurring Revenue Dashboard. Effortless transmuted into other format such as JPEG and PDF. PowerPoint design can be displayed in standard and widescreen view. Fascinating picture quality as pixels don’t break even on large screen. Easy adapt Presentation template as editing permissible with color, text and shape. Matching PPT designs are downloadable with different nodes and stages. Access gives personal touch to the presentation with business name and logo. PowerPoint slide is well-matched with Google slides.
-
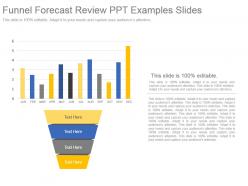 Funnel forecast review ppt examples slides
Presenting funnel forecast review ppt examples slides. This is a funnel forecast review ppt examples slides. This is a two stage process. The stages in this process are jan, feb, mar, apr, may, jun, jul, aug, sep, oct, nov, dec.
-
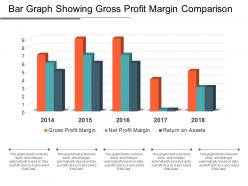 Bar graph showing gross profit margin comparison
Presenting bar graph showing gross profit margin comparison. This is a bar graph showing gross profit margin comparison. This is a five stage process. The stages in this process are gross profit, gross benefit, gross margin.
-
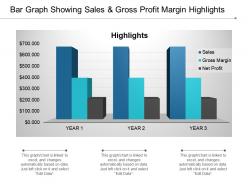 Bar graph showing sales and gross profit margin highlights
Presenting bar graph showing sales and gross profit margin highlights. This is a bar graph showing sales and gross profit margin highlights. This is a three stage process. The stages in this process are gross profit, gross benefit, gross margin.
-
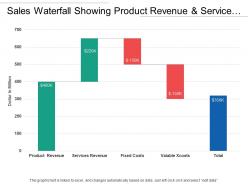 Sales waterfall showing product revenue and service revenue
Presenting this set of slides with name - Sales Waterfall Showing Product Revenue And Service Revenue. This is a five stage process. The stages in this process are Sales Waterfall, Waterfall Chart.
-
 Procurement suppliers defect rate and type dashboard
Presenting this set of slides with name - Procurement Suppliers Defect Rate And Type Dashboard. This is a six stage process. The stages in this process are Purchase, Procurement, Buy.
-
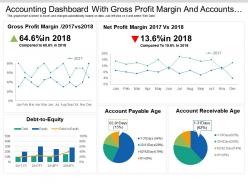 Accounting dashboard with gross profit margin and accounts payable
Offering accounting dashboard with gross profit margin and account payable PPT slideshow. Makes the information clear in the mind of the audience. Editable visuals, colors and charts. Easy to edit and customize as per your needs. Beneficial for industry professionals, technologists, managers, executives, researchers, sales people, etc. Flexible presentation designs can be presented in standard and widescreen view. Has a futuristic and realistic approach. Easy to download and save. Highly beneficial PowerPoint Slide for highlighting financial data.
-
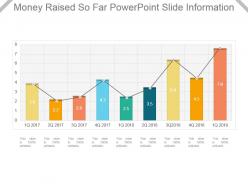 Money raised so far powerpoint slide information
Presenting money raised so far powerpoint slide information. This is a money raised so far powerpoint slide information. This is a nine stage process. The stages in this process are business, marketing, growth, rising, management.
-
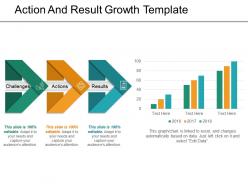 Action and result growth template powerpoint topics
Presenting Action And Result Growth Template PowerPoint Topics. You can customize colors, choose font styles and sizes. The PPT slide is compatible with Google Slides and can be fetched at once. You can avail this slide in standard screen size and widescreen size. The template works completely on your command. Change anything in the slide and match it to your presentation theme. Convert and save it in JPG, PDF, JPEG and PNG formats.
-
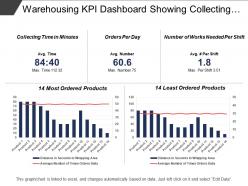 Warehousing kpi dashboard showing collecting time and orders per day
Presenting, warehousing dashboard KPI PowerPoint Presentation Slide. This Presentation has been designed professionally and is fully editable. You can personalize font size, font type, colors, and even the background. This Template is obedient with Google Slide and can be saved in JPG or PDF format without any hassle. Fast download at the click of the button.
-
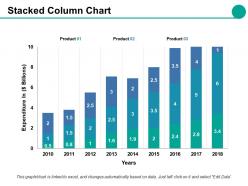 Stacked column chart ppt styles gridlines
Presenting this set of slides with name - Stacked Column Chart Ppt Styles Gridlines. This is a three stage process. The stages in this process are Business, Management, Strategy, Analysis, Marketing.
-
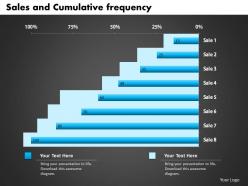 0414 sales and cumulative frequency bar chart powerpoint graph
We are proud to present our 0414 sales and cumulative frequency bar chart powerpoint graph. Lay The Foundation Of Your Presentation With Our Sales and Cumulative frequency bar chart Powerpoint Graph Power Point Templates. Build Upon It Layer By Layer And Give It The Form Of Your Choice. Our Sales and Cumulative frequency bar chart Powerpoint Graph Power Point Templates Are The Heartstrings Of Your Brilliant Song. Strum Them And Produce A Tune Certain To Touch The Souls Of Your Audience.
-
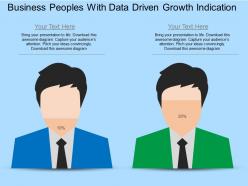 Business peoples with data driven growth indication powerpoint slides
We are proud to present our business peoples with data driven growth indication powerpoint slides. This power point template diagram has been designed with graphic of business peoples. This pie chart is data driven. This PPT diagram can be used for data driven growth indication. Use this PPT diagram can be used for marketing and business related presentations.
-
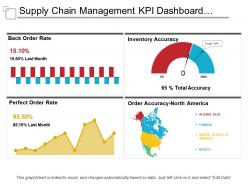 Supply chain management kpi dashboard showing back order rate and order accuracy
Presenting this set of slides with name - Supply Chain Management Kpi Dashboard Showing Back Order Rate And Order Accuracy. This is a four stage process. The stages in this process are Demand Forecasting, Predicting Future Demand, Supply Chain Management.
-
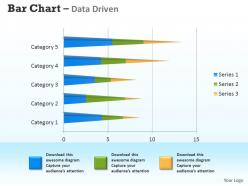 Data driven 3d bar chart for analyzing survey data powerpoint slides
We are proud to present our data driven 3d bar chart for analyzing survey data powerpoint slides. This PowerPoint chart can be used to illustrate many types of data. It should be used to make facts clearer and more understandable. Quick way for the audience to visualize what you are saying numbers trends up or down .
-
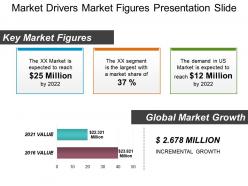 Market drivers market figures presentation slide
Presenting this PPT slide named - Market drivers market figures presentation slide. Save your time with a completely editable PPT design. You can make the needful alterations in the font color, font size and font style. The color of text and background can be for formatted. You can design the PPT slide with a range of editable icons. You can add or edit text anywhere in the PowerPoint template. It’s compatibility with Google slides make it accessible at once. You can customize and save the slide in PDF and JPG formats as well. Get this high quality slide to add value to your presentation.
-
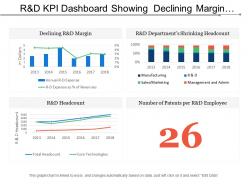 R and d kpi dashboard showing declining margin headcount and number of patents per employee
Presenting this set of slides with name - R And D Kpi Dashboard Showing Declining Margin Headcount And Number Of Patents Per Employee. This is a four stage process. The stages in this process are R And D, Research And Development, Research And Technological Development.
-
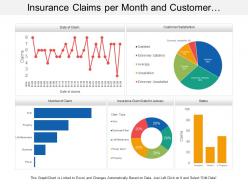 Insurance claims per month and customer satisfaction dashboard
Presenting this set of slides with name - Insurance Claims Per Month And Customer Satisfaction Dashboard. This is a five stage process. The stages in this process are Assurance, Surety, Insurance.
-
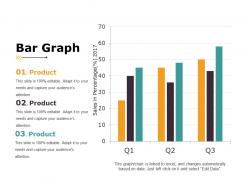 Bar graph ppt samples
Presenting Bar Graph PPT Samples PowerPoint slide. This PPT presentation is Google Slides compatible hence it is easily accessible. You can download and save this PowerPoint layout in different formats like PDF, PNG and JPG. This PPT theme is available in both 4:3 and 16:9 aspect ratios. As this PowerPoint template is 100% editable, you can modify color, font size, font type and shapes as per your requirements.
-
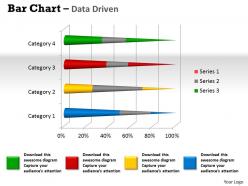 Data driven 3d bar chart to dispaly data powerpoint slides
We are proud to present our data driven 3d bar chart to dispaly data powerpoint slides. This PowerPoint diagram helps you to determine the number of activities to be studied and the number of people involved in the process.Transmit your thoughts via this slide and prods your team to action.
-
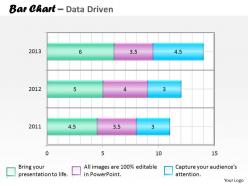 Data driven bar chart for collection of data powerpoint slides
We are proud to present our data driven bar chart for collection of data powerpoint slides. Open The Mental Windows Of Your Audience With Our Data Driven Bar Chart For Collection Of Data Powerpoint Slides Power Point Templates. Let The Fresh Breeze Of Your Thoughts Flow Through. High Five Your Audience With Our Data Driven Bar Chart For Collection Of Data Powerpoint Slides Power Point Templates. See Them Extend Their Hands With Joy.
-
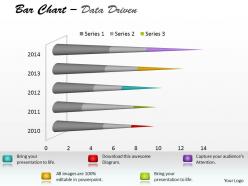 Data driven 3d bar chart to communicate information powerpoint slides
We are proud to present our data driven 3d bar chart to communicate information powerpoint slides. Our Data Driven 3D Bar Chart To Communicate Information Powerpoint slides Power Point Templates Will Generate And Maintain The Level Of Interest You Desire. They Will Create The Impression You Want To Imprint On Your Audience. Our Data Driven 3D Bar Chart To Communicate Information Powerpoint slides Power Point Templates Are Effectively Color Coded To Priorities Your Plans. They Automatically Highlight The Sequence Of Events You Desire.
-
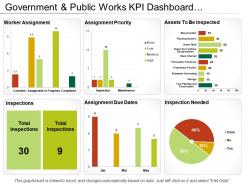 Government and public works kpi dashboard showing work assignment and due dates
Presenting the KPI dashboard presentation slide. This KPI presentation template is completely modifiable and is designed professionally. You can edit the objects in this slide like font color and font size without going through any fuss. This presentation slide is fully compatible with Google Slide and can be saved in JPG or PDF file format hassle-free. To download this, click on the button below.
-
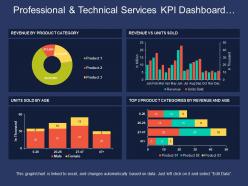 Professional and technical services kpi dashboard showing revenue vs units sold
Presenting this set of slides with name - Professional And Technical Services Kpi Dashboard Showing Revenue Vs Units Sold. This is a four stage process. The stages in this process are Professional And Technical Services, Services Management, Technical Management.
-
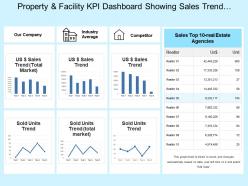 Property and facility kpi dashboard showing sales trend and sales performance
Grab an opportunity to see, property and facility KPI dashboard showing sales trend and sales performance PowerPoint Presentation Slide. This Presentation has been designed under the strict supervision of professionals and is fully editable. You can have access to play with the font size, font type, colors, and even the background. This Template is achievable with Google Slide and can be saved in JPG or PDF format without any obstacles created during the saving process. Fast download at the click of the button.
-
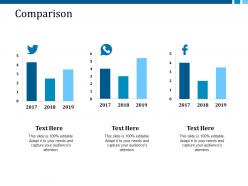 Comparison ppt layouts visual aids
Presenting this set of slides with name - Comparison Ppt Layouts Visual Aids. This is a three stage process. The stages in this process are Business,Management,Strategy,Analysis,Icons.
-
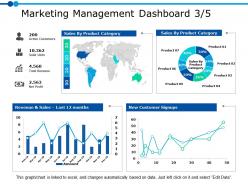 Marketing management dashboard 3 5 ppt powerpoint presentation gallery designs
Presenting this set of slides with name - Marketing Management Dashboard 3 5 Ppt Powerpoint Presentation Gallery Designs. This is a four stage process. The stages in this process are Business, Management, Strategy, Analysis, Marketing.
-
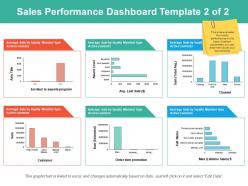 Sales performance dashboard template 2 of 2 ppt powerpoint presentation pictures microsoft
Presenting this set of slides with name - Sales Performance Dashboard Template 2 Of 2 Ppt Powerpoint Presentation Pictures Microsoft. This is a six stage process. The stages in this process are Business, Analysis, Marketing, Management, Strategy.
-
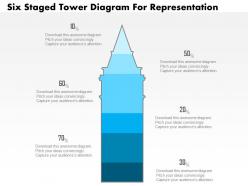 1214 six staged tower diagram for representation powerpoint slide
We are proud to present our 1214 six staged tower diagram for representation powerpoint slide. Five staged tower diagram has been used to craft this power point template slide. This PPT slide contains the concept of data representation. Use this PPT slide for your business data related presentation.
-
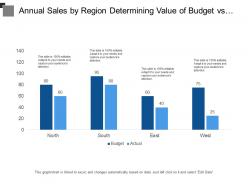 Annual sales by region determining value of budget vs actual with respective gains and differences
Presenting this set of slides with name - Annual Sales By Region Determining Value Of Budget Vs Actual With Respective Gains And Differences. This is a four stage process. The stages in this process are Forecast Vs Actual Budget, Actual Vs Budget, Marketing Budget.
-
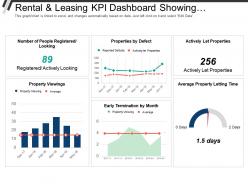 Rental and leasing kpi dashboard showing properties by defect and actively let properties
Presenting this set of slides with name - Rental And Leasing Kpi Dashboard Showing Properties By Defect And Actively Let Properties. This is a six stage process. The stages in this process are Rental And Leasing, Dealing And Leasing, Rental And Engage.
-
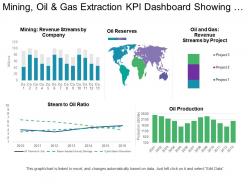 Mining oil and gas extraction kpi dashboard showing steam to oil ratio and oil reserves
Presenting this set of slides with name - Mining Oil And Gas Extraction Kpi Dashboard Showing Steam To Oil Ratio And Oil Reserves. This is a four stage process. The stages in this process are Mining, Oil And Gas Extraction, Refinery, Natural Gas.
-
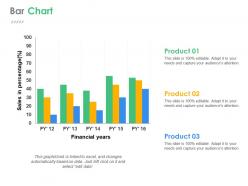 Bar chart ppt slide design
Presenting this set of slides with name - Bar Chart Ppt Slide Design. This is a three stage process. The stages in this process are Bar Chart, Marketing, Strategy, Planning, Finance.
-
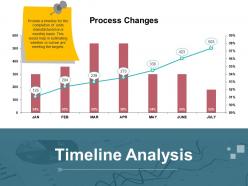 Timeline analysis powerpoint guide
Presenting this set of slides with name - Timeline Analysis Powerpoint Guide. This is a seven stage process. The stages in this Presenting timeline analysis PowerPoint guide PPT slide. The timeline analysis graph presentation slide designed by the professionals of SlideTeam to illustrate a variety of purposes. The event timeline analysis presentation slide is completely editable in PowerPoint. The timeline data analysis PPT template is also compatible with Google Slide and a user can share with others as well. A user can make changes in the font size, font type, color as well as dimensions of the graphs in analysis timeline PowerPoint slide as per his requirement and the slide get linked with Excel sheet.
-
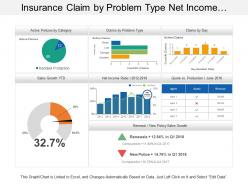 Insurance claim by problem type net income ratio dashboard
Presenting this set of slides with name - Insurance Claim By Problem Type Net Income Ratio Dashboard. This is a five stage process. The stages in this process are Assurance, Surety, Insurance.
-
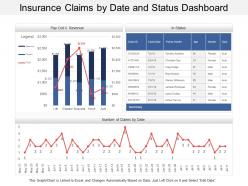 Insurance claims by date and status dashboard
Presenting this set of slides with name - Insurance Claims By Date And Status Dashboard. This is a three stage process. The stages in this process are Assurance, Surety, Insurance.
-
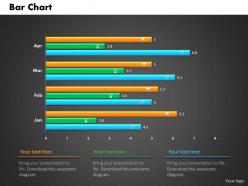 0514 monthly data driven bar graph powerpoint slides
We are proud to present our 0514 monthly data driven bar graph powerpoint slides. A monthly data driven chart graphic is used in this business power point template. Show unique way of result analysis with our great collection of data driven template.
-
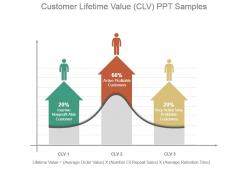 Customer lifetime value clv ppt samples
Presenting customer lifetime value clv ppt samples. Presenting customer lifetime value clv ppt samples. Presenting customer lifetime value clv ppt samples. This is a customer lifetime value clv ppt samples. This is three stage process. The stages in this process are inactive nonprofit able customer, active profitable customers, very active very profitable customers.
-
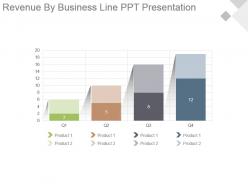 Revenue by business line ppt presentation
Presenting revenue by business line ppt presentation. This is a revenue by business line ppt presentation. This is a four stage process. The stages in this process are business, management, marketing, revenue, presentation.
-
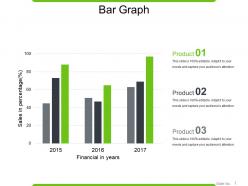 Bar graph good ppt example
Presenting bar graph good ppt example. This is a bar graph good ppt example. This is a three stage process. The stages in this process are bar graph, finance, analysis, strategy, business.
-
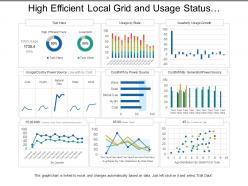 High efficient local grid and usage status utilities dashboard
Presenting this set of slides with name - High Efficient Local Grid And Usage Status Utilities Dashboard. This is a three stage process. The stages in this process are Utilities, Use, Advantage.
-
 0414 stop thinking concept bar chart powerpoint graph
We are proud to present our 0414 stop thinking concept bar chart powerpoint graph. Lay the foundation of your presentation with our Stop Thinking Concept Bar Chart Powerpoint Graph Powerpoint Templates. Build upon it layer by layer and give it the form of your choice. Our Stop Thinking Concept Bar Chart Powerpoint Graph Powerpoint Templates are the heartstrings of your brilliant song. Strum them and produce a tune certain to touch the souls of your audience.
-
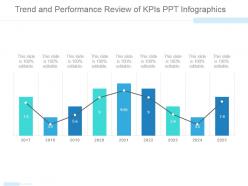 Trend and performance review of kpis ppt infographics
Presenting trend and performance review of kpis ppt infographics. This is a trend and performance review of kpis ppt infographics. This is a nine stage process. The stages in this process are graph, finance, business, marketing, year.
-
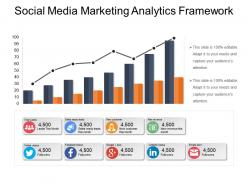 Social media marketing analytics framework ppt example
Images can be resized and colored. Color, style and position can be standardized. Supports font size which can be read from a distance. PPT slide is compatible with the all the versions of microsoft. Beneficial for businessman, representatives of big or small organizations for setting marketing goals. The PowerPoint slide is Google Slides friendly and can be saved in different formats like PDF, PNG and JPG.
-
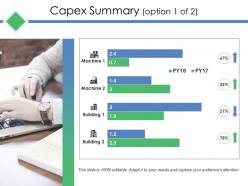 Capex summary ppt deck
Presenting this set of slides with name - Capex Summary Ppt Deck. This is a four stage process. The stages in this process are Marketing, Business, Finance, Analysis, Strategy.
-
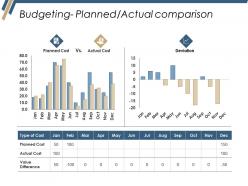 Budgeting planned actual comparison ppt icon
Presenting this set of slides with name - Budgeting Planned Actual Comparison Ppt Icon. This is a two stage process. The stages in this process are Finance, Analysis, Business, Strategy, Management.
-
 Comparison ppt styles icon
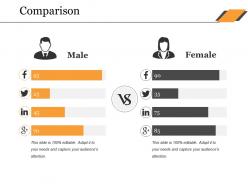
Presenting this set of slides with name - Comparison Ppt Styles Icon. This is a two stage process. The stages in this process are Male, Female, Comparison, Management, Business.
-
 Financial results return on assets capital ratio ppt design
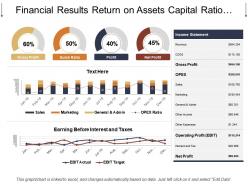
Exhibiting financial results return on assets capital ratio PPT design. Fully amendable content as color, text and shape are easily editable. Easy to add business name, icon or title. Awesome picture quality as do not break when anticipated on large screen. Easy and quick download with saving options. The PowerPoint slide can be presented in standard and widescreen view. Preference to download with different nodes and stages. PPT diagram can be shared with Google slides.
-
 Accounting dashboard with global financial performance
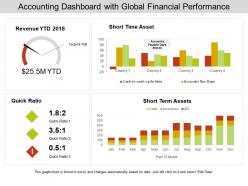
Pre-designed accounting dashboard with global financial performance PPT template. High-resolution PowerPoint presentation backgrounds for better clarity of the information displayed. Offers wide variety of options and colors to alter the appearance. Allows adding of enterprise personal details such as brand name, logo and much more. Enough space available to enter text and its related points in the PPT table. This slide is available in both Standard and Widescreen slide size. Compatible with multiple formats like JPEG, PDF and Google slides.
-
 Total full time year round civilian population by sex with occupation in the us for 2017
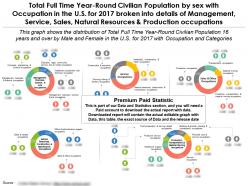
Presenting this set of slides with name - Total Full Time Year Round Civilian Population By Sex With Occupation In The US For 2017. Total Full Time Year Round Civilian Population by sex with Occupation in the U.S. for 2017 broken into details of management, service, sales, natural resources and Production occupations. This is part of our Data and Statistics products selection, and you will need a Paid account to download the actual report with accurate data. Downloaded report will contain the actual editable graph with the actual data, an excel table with the actual data, the exact source of the data and the release date. This graph shows the distribution of Total Full Time Year Round Civilian Population 16 years and over by Male and Female in the U.S. for 2017 with Occupation and Categories. It covers topic Full Time Year Round Population by Sex for region USA and is for date range 2017. Download it immediately and use it for your business.
-
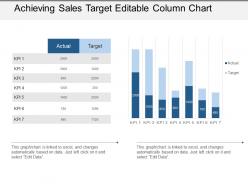 Achieving sales target editable column chart powerpoint guide
Presenting the PPT slide named Achieving sales target editable column chart PowerPoint guide. This template is professionally designed and is completely editable. The Font color, Font size, Font style, background color and color of the diagram can be altered as per your suitability. The text in the template can be rewritten and replaced with your desired content. The slide is totally compatible with Google slides and can be easily saved in JPG or PDF format. You can customize the template conveniently by changing the data in excel sheet, as this template is Excel-linked. Editable icons make the presentation more presentable. Download it now to make a hassle free presentation.
-
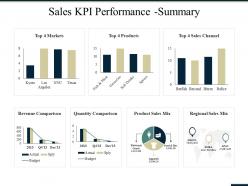 Sales kpi performance summary ppt summary gridlines
Presenting this set of slides with name - Sales Kpi Performance Summary Ppt Summary Gridlines. This is a seven stage process. The stages in this process are Markets, Sales Channel, Regional Sales Mix, Product Sales Mix, Quantity Comparison.
-
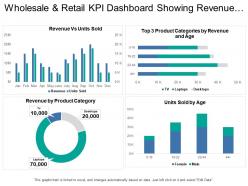 Wholesale and retail kpi dashboard showing revenue vs units sold
Presenting the retail business template for PowerPoint. This PowerPoint template is 100% editable in PowerPoint and is professionally designed. You can edit the objects in the slide like font size and font color very easily. This presentation slide is 100% compatible with Google Slide and can be saved in JPG or PDF file format without any fuss. Fast download this at the click of the button.
-
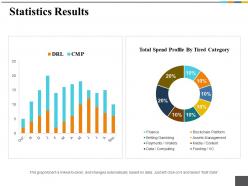 Statistics results ppt inspiration gallery
Presenting statistics results PowerPoint presentation slide. This presentation has been designed professionally and is fully editable. You can personalize font size, font type, colors, and even the background. This Template is obedient with Google Slide and can be saved in JPG or PDF format without any hassle. Fast download at the click of the button.
-
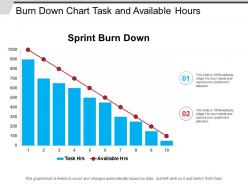 Burn down chart task and available hours
Presenting this set of slides with name - Burn Down Chart Task And Available Hours. This is a two stage process. The stages in this process are Burn Down Chart, Agile Software Development Chart, Run Chart.
-
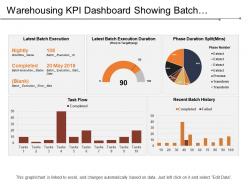 Warehousing kpi dashboard showing batch execution and task flow
Showing, warehousing KPI dashboard PowerPoint Presentation Slide. This Presentation has been designed professionally and is fully editable. You can customize the font size, font type, colors, and even the background. This Template is disciplinary with Google Slide and can be saved in JPG or PDF format without any fuss created. Fast download at the click of the button.
-
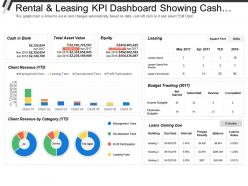 Rental and leasing kpi dashboard showing cash in bank total asset value equity
Presenting this set of slides with name - Rental And Leasing Kpi Dashboard Showing Cash In Bank Total Asset Value Equity. This is a three stage process. The stages in this process are Rental And Leasing, Dealing And Leasing, Rental And Engage.
-
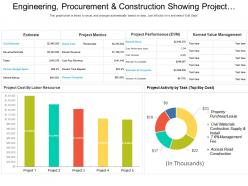 Engineering procurement and construction showing project metrics and activity
Presenting this set of slides with name - Engineering Procurement And Construction Showing Project Metrics And Activity. This is a three stage process. The stages in this process are Engineering, Procurement And Construction, Construction Management, Engineering, Purchasing And Construction .
-
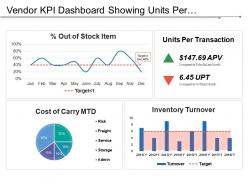 Vendor kpi dashboard showing units per transaction percentage out of stock items
Presenting this set of slides with name - Vendor Kpi Dashboard Showing Units Per Transaction Percentage Out Of Stock Items. This is a four stage process. The stages in this process are Vendor, Supplier, Retailer.
-
 Hiring plan powerpoint slide background image
Presenting hiring plan powerpoint slide background image. Presenting hiring plan powerpoint slide background image. Presenting hiring plan powerpoint slide background image. This is a hiring plan powerpoint slide background image. This is five stage process. The stages in this process are engineering, sales, marketing, product, support, finance.


