- Sub Categories
-
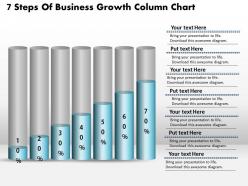 0414 7 steps of buisness growth column chart powerpoint graph
We are proud to present our 0414 7 steps of buisness growth column chart powerpoint graph. Use our 7 Steps Of Buisness Growth Column Chart PowerPoint Graph Powerpoint Templates to weave a web of your great ideas. They are guaranteed to attract even the most critical of your colleagues. Our 7 Steps Of Buisness Growth Column Chart PowerPoint Graph Powerpoint Templates are designed to help you succeed. They have all the ingredients you need.
-
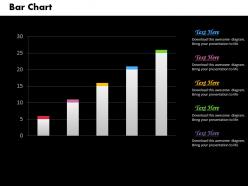 0414 business data driven column chart powerpoint graph
We are proud to present our 0414 business data driven column chart powerpoint graph. Clear and concise is the credo of our 0414 Business Data Driven Column Chart Powerpoint Graph Powerpoint Templates. Use them and dispel any doubts your team may have. Effective communication is what our 0414 Business Data Driven Column Chart Powerpoint Graph Powerpoint Templates ensure. They help you put across your views with precision and clarity.
-
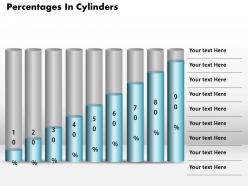 0414 percentage in cylinders 9 stages column chart powerpoint graph
We are proud to present our 0414 percentage in cylinders 9 stages column chart powerpoint graph. Tee off with our Percentage In Cylinders 9 Stages column chart Powerpoint Graph Powerpoint Templates. They will reward you with a hole in one. Launch your ideas with our Percentage In Cylinders 9 Stages column chart Powerpoint Graph Powerpoint Templates. Take your audience along on a magnificent flight.
-
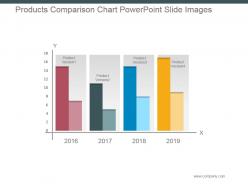 Products comparison chart powerpoint slide images
Presenting products comparison chart powerpoint slide images. This is a products comparison chart powerpoint slide images. This is a four stage process. The stages in this process are product version.
-
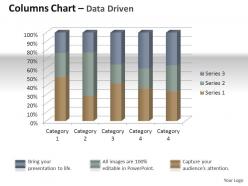 Data driven 3d quality control of units powerpoint slides
We are proud to present our data driven 3d quality control of units powerpoint slides. Channelize The Thoughts Of Your Team With Our Data Driven 3D Quality Control Of Units Powerpoint Slides Power Point Templates. Urge Them To Focus On The Goals You Have Set. Give Impetus To The Hopes Of Your Colleagues. Our Data Driven 3D Quality Control Of Units Powerpoint Slides Power Point Templates Will Aid You In Winning Their Trust.
-
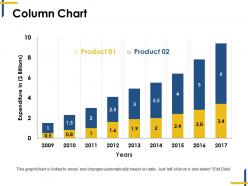 Column chart ppt examples
Presenting this set of slides with name - Column Chart Ppt Examples. This is a two stage process. The stages in this process are Column Chart, Finance, Analysis, Business, Marketing.
-
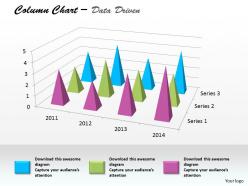 Data driven 3d column chart for business project powerpoint slides
We are proud to present our data driven 3d column chart for business project powerpoint slides. Our Data Driven Column 3D Chart For Business Project Powerpoint slides Power Point Templates Will Provide Weight To Your Words. They Will Bring Out The Depth Of Your Thought Process. Words Like Arrows Fly Straight And True. Use Our Data Driven 3D Column Chart For Business Project Powerpoint slides Power Point Templates To Make Them Hit Bulls eye Every time.
-
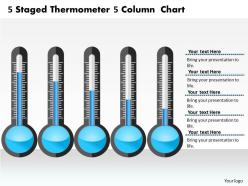 0414 5 staged thermometer 5 column chart powerpoint graph
We are proud to present our 0414 5 staged thermometer 5 column chart powerpoint graph. Hit the right notes with our 5 Staged Thermometer 5 Column Chart PowerPoint Graph Powerpoint Templates. Watch your audience start singing to your tune. Walk your team through your plans using our 5 Staged Thermometer 5 Column Chart PowerPoint Graph Powerpoint Templates. See their energy levels rise as you show them the way.
-
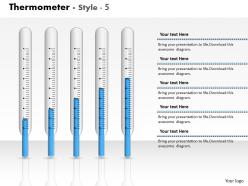 0414 column chart thermometer graph powerpoint graph
Impressive visuals of high quality. Good quality resolution. No issue of blurred images when projected on wide screen. Compatible with multiple number of online and offline software options. Ease of personalization and customization. Add the data and figures with ease. For assistance refer to the editing guidance provided in the presentation itself. Effectively downloaded and used by entrepreneurs, strategists, marketers, students and teachers.
-
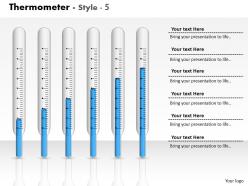 0414 data display with thermometer column chart powerpoint graph
We are proud to present our 0414 data display with thermometer column chart powerpoint graph. You have a driving passion to excel in your field. Our 0414 Data Display With Thermometer Column Chart Powerpoint Graph Powerpoint Templates will prove ideal vehicles for your ideas. You are well armed with penetrative ideas. Our 0414 Data Display With Thermometer Column Chart Powerpoint Graph Powerpoint Templates will provide the gunpowder you need.
-
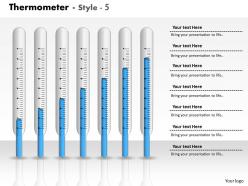 0414 thermometer graph column chart powerpoint graph
Can be viewed in 4: 3 standard screen size or 16:9 wide screen size. PPT design has many supporting actions like write, erase, correct, clean and select. Internet based click facilities like image search, oxford dictionary and others can be added with. ease and gives professional look to the PPT slide. Enables real time edition or collaboration with auto saving options.
-
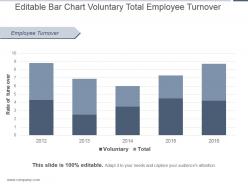 Editable bar chart voluntary total employee turnover ppt icon
Presenting editable bar chart voluntary total employee turnover ppt icon. This is a editable bar chart voluntary total employee turnover ppt icon. This is a five stage process. The stages in this process are employee turnover, rate of turn over, voluntary, total.
-
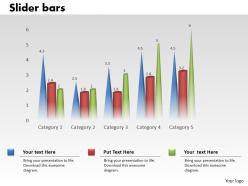 0414 data sets column chart illustration powerpoint graph
We are proud to present our 0414 data sets column chart illustration powerpoint graph. Our 0414 Data Sets Column Chart Illustration Powerpoint Graph Powerpoint Templates are like the strings of a tennis racquet. Well strung to help you serve aces. Aesthetically crafted by artistic young minds. Our 0414 Data Sets Column Chart Illustration Powerpoint Graph Powerpoint Templates are designed to display your dexterity.
-
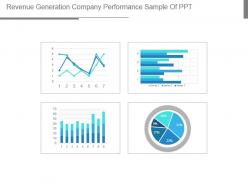 Revenue generation company performance sample of ppt
Presenting revenue generation company performance sample of ppt. This is a revenue generation company performance sample of ppt. This is a four stage process. The stages in this process are business, marketing, graph, percentage, success.
-
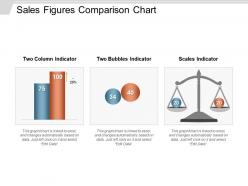 Sales figures comparison chart powerpoint slide deck
PPT design allows full editing. Excel linked charts and graphs have been used in design. Just add your numbers and information to these already visually impactful PPT slides and quickly prepare your presentation. Design is instantly downloadable into JPEG and PDF formats. PPT design can be accessed on both standard and full screen design views. Design template is fully compatible with Google Slides and MS PowerPoint software.
-
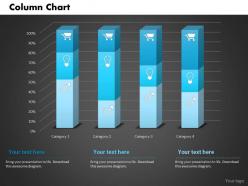 0514 data driven chart for shopping powerpoint slides
We are proud to present our 0514 data driven chart for shopping powerpoint slides. To display shopping related analyses in any business presentation use our creative Business Power Point template with data driven techniques.
-
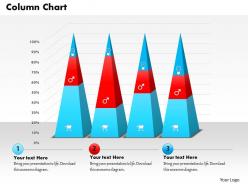 0514 data driven triangular bar graph powerpoint slides
We are proud to present our 0514 data driven triangular bar graph powerpoint slides. A triangular shape data driven bar graph is used in this Business power Point template. Use this template for sequential data flow in any presentation.
-
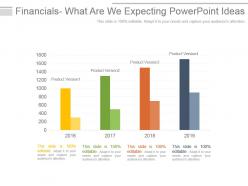 Year based financial analysis powerpoint ideas
Presenting year based financial analysis powerpoint ideas. This is a year based financial analysis powerpoint ideas. This is a four stage process. The stages in this process are product version, business, marketing, process, success.
-
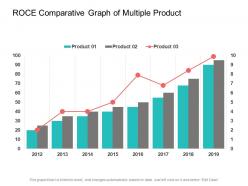 Roce comparative graph of multiple product
Presenting this set of slides with name - Roce Comparative Graph Of Multiple Product. This is a three stages process. The stages in this process are ROCE, Return On Capital Employed, Accounting Ratio.
-
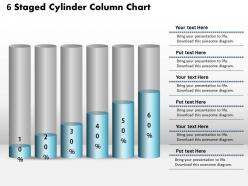 0414 6 staged cylinder column chart powerpoint graph
We are proud to present our 0414 6 staged cylinder column chart powerpoint graph. Our 6 Staged Cylinder Column Chart PowerPoint Graph Powerpoint Templates are created with admirable insight. Use them and give your group a sense of your logical mind. Use our 6 Staged Cylinder Column Chart PowerPoint Graph Powerpoint Templates to bullet point your ideas. See them fall into place one by one.
-
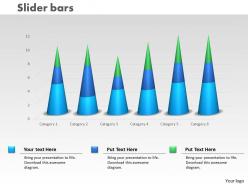 0414 slider column chart for business trends powerpoint graph
We are proud to present our 0414 slider column chart for business trends powerpoint graph. Our Slider Column Chart For Business Trends Powerpoint Graph Powerpoint Templates offer you the needful to organize your thoughts. Use them to list out your views in a logical sequence. Our Slider Column Chart For Business Trends Powerpoint Graph Powerpoint Templates are created by a hardworking bunch of busy bees. Always flitting around with solutions guaranteed to please.
-
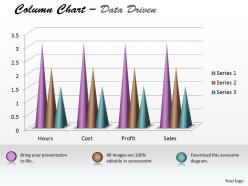 Data driven 3d chart shows data sets in order powerpoint slides
We are proud to present our data driven 3d chart shows data sets in order powerpoint slides. Our Data Driven 3D Chart Shows Data Sets In Order Powerpoint Slides Power Point Templates Are Topically Designed To Provide An Attractive Backdrop To Any Subject. Use Them To Look Like A Presentation Pro. Use Our Data Driven 3D Chart Shows Data Sets In Order Powerpoint Slides Power Point Templates To Effectively Help You Save Your Valuable Time. They Are Readymade To Fit Into Any Presentation Structure.
-
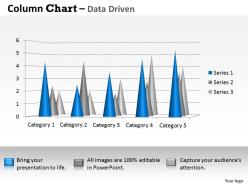 Data driven 3d distribution of data in sets powerpoint slides
We are proud to present our data driven 3d distribution of data in sets powerpoint slides. Let Our Data Driven 3D Data In Segments Pie Chart Powerpoint Slides Power Point Templates Be The Vehicle Of Your Successful Journey. Ride The Bus To Glory With Your Grand Ideas. Our Data Driven 3D Data In Segments Pie Chart Powerpoint Slides Power Point Templates Are Like A Basic Christmas Tree. Decorate It With Your Beautiful Thoughts And Spread Joy And Happiness.
-
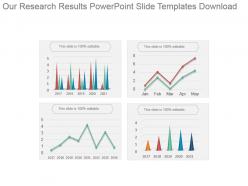 Our research results powerpoint slide templates download
Presenting our research results powerpoint slide templates download. This is a our research results powerpoint slide templates download. This is a four stage process. The stages in this process are business, management, presentation, finance, marketing.
-
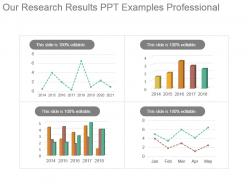 Our research results ppt examples professional
Presenting our research results ppt examples professional. This is a our research results ppt examples professional. This is a four stage process. The stages in this process are business, management, presentation, finance, marketing.
-
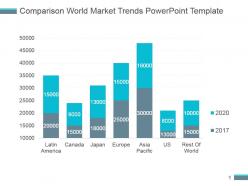 Comparison world market trends powerpoint template
Presenting comparison world market trends powerpoint template. This is a comparison world market trends powerpoint template. This is a seven stage process. The stages in this process are latin america, canada, japan, europe, asia pacific, us, rest of world.
-
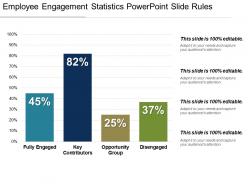 Employee engagement statistics powerpoint slide rules
Presenting our employee engagement statistics PowerPoint slide rules. This PPT slide offers you plenty of space to put in titles and subtitles. High resolution based presentation layout, does not change the image even after resizing. This presentation icon is data driven and template can be downloaded via excel file to incorporate data. Quick downloading speed and simple editing options in color text and fonts.PPT icons can easily be changed into JPEG and PDF applications.
-
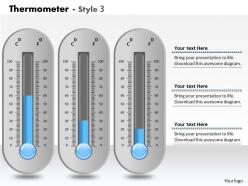 0414 layout of thermometer column chart powerpoint graph
We are proud to present our 0414 layout of thermometer column chart powerpoint graph. Our Layout of Thermometer Column Chart Powerpoint Graph Powerpoint Templates give you that extra zing. Add your views and make your audience sing. Our pretty Layout of Thermometer Column Chart Powerpoint Graph Powerpoint Templates are like snowflakes that fall. Gather them together and have a ball. Put your wondrously glowing ideas into them. Bind them together and create mayhem.
-
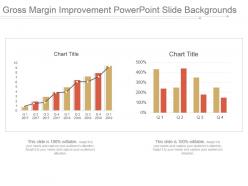 Gross margin improvement powerpoint slide backgrounds
Presenting gross margin improvement powerpoint slide backgrounds. Presenting gross margin improvement powerpoint slide backgrounds. Presenting gross margin improvement powerpoint slide backgrounds. This is a gross margin improvement powerpoint slide backgrounds. This is two stage process. The stages in this process are chart title, gross margin, improvement, business, success.
-
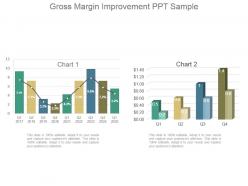 Gross margin improvement ppt sample
Presenting gross margin improvement ppt sample. Presenting gross margin improvement ppt sample. Presenting gross margin improvement ppt sample. This is a gross margin improvement ppt sample. This is two stage process. The stages in this process are gross margin, improvement, strategy, business, success, finance.
-
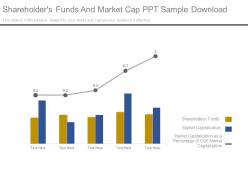 Shareholders funds and market cap ppt sample download
Presenting shareholders funds and market cap ppt sample download. This is a shareholders funds and market cap ppt sample download. This is a five stage process. The stages in this process are shareholders funds, market capitalization, market capitalization as a percentage of cse market capitalization.
-
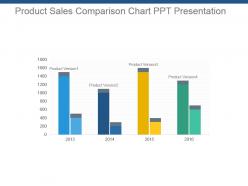 Product sales comparison chart ppt presentation
Presenting product sales comparison chart ppt presentation. This is a product sales comparison chart ppt presentation. This is a four stage process. The stages in this process are product, sales, comparison chart, timeline, strategy.
-
 0414 graphics of thermometer column chart powerpoint graph
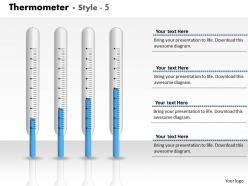
We are proud to present our 0414 graphics of thermometer column chart powerpoint graph. Stamp the authority of your intellect with our Graphics Of Thermometer Column Chart Powerpoint Graph Powerpoint Templates. Your superior ideas will hit the target always and everytime. Use our Graphics Of Thermometer Column Chart Powerpoint Graph Powerpoint Templates to embellish your thoughts. See them provide the desired motivation to your team.
-
 0414 thermometer column chart data illustration powerpoint graph
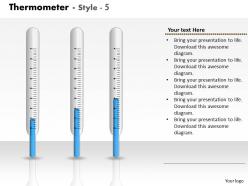
We are proud to present our 0414 thermometer column chart data illustration powerpoint graph. Our Thermometer Column Chart Data Illustration Powerpoint Graph Powerpoint Templates give you that extra zing. Add your views and make your audience sing. Our pretty Thermometer Column Chart Data Illustration Powerpoint Graph Powerpoint Templates are like snowflakes that fall. Gather them together and have a ball. Put your wondrously glowing ideas into them. Bind them together and create mayhem.
-
 Market growth and development bar graph ppt images
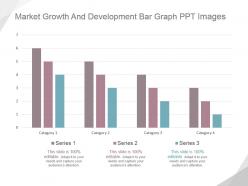
Presenting market growth and development bar graph ppt images. This is a market growth and development bar graph ppt images. This is a four stage process. The stages in this process are category, series.
-
 Real estate sales growth ppt templates
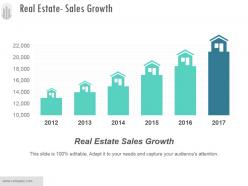
Presenting real estate sales growth ppt templates. This is a real estate sales growth ppt templates. This is a six stage process. The stages in this process are business, marketing, growth, management, sales.
-
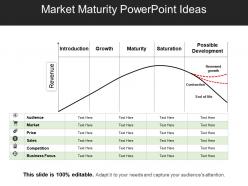 Market maturity powerpoint ideas
Presenting Market Maturity PowerPoint Ideas. It is a professionally designed PowerPoint template with relevant visuals and content. You can change the color, text and font size as per your need. You can add or delete the content wherever required. This slide is available in both standard and widescreen size. Its compatibility with Google Slides makes it easily available. Convert and save this PPT slide in both PDF and JPG format.
-
 Data driven 3d process variation column chart powerpoint slides
We are proud to present our data driven 3d process variation column chart powerpoint slides. Bubbling And Bursting With Ideas Are You. Let Our Data Driven 3D Process Variation Column Chart Powerpoint Slides Power Point Templates Give Them The Shape For You. You Have Gained Great Respect For Your Brilliant Ideas. Use Our Data Driven 3D Process Variation Column Chart Powerpoint Slides Power Point Templates To Strengthen And Enhance Your Reputation.
-
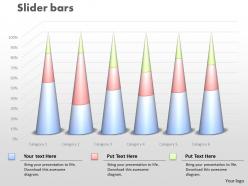 0414 slider column chart for comparing data powerpoint graph
We are proud to present our 0414 slider column chart for comparing data powerpoint graph. Clear and concise is the credo of our Slider Column Chart For Comparing Data Powerpoint Graph Powerpoint Templates. Use them and dispel any doubts your team may have. Effective communication is what our Slider Column Chart For Comparing Data Powerpoint Graph Powerpoint Templates ensure. They help you put across your views with precision and clarity.
-
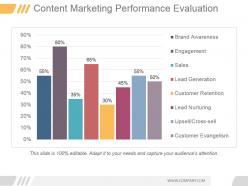 Content marketing performance evaluation ppt sample
Presenting content marketing performance evaluation ppt sample. This is a content marketing performance evaluation ppt sample. This is a eight stage process. The stages in this process are brand awareness, engagement, sales, lead generation, customer retention, lead nurturing, upsell cross sell, customer evangelism.
-
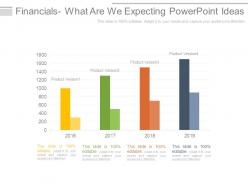 Financials what are we expecting powerpoint ideas
Presenting financials what are we expecting powerpoint ideas. This is a financials what are we expecting powerpoint ideas. This is a four stage process. The stages in this process are business, years, process, analysis, strategy, management.
-
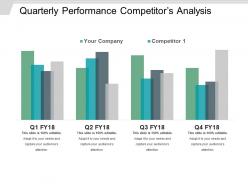 Quarterly performance competitors analysis powerpoint graphics
Presenting Quarterly performance competitors analysis PowerPoint slide. They are informational and adorned PPT formats useful for the business experts. They remain its high caliber even when anticipated on the wide screen .These PowerPoint designs can be effectively exportable into PDF or JPG file frames. They can be effectively utilized with Google Slides and different applications. They have amend able highlights like shading, content, images, and more.
-
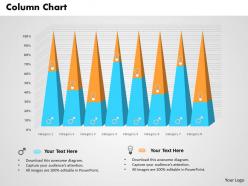 0514 triangular data driven chart for analysis powerpoint slides
We are proud to present our 0514 triangular data driven chart for analysis powerpoint slides. A triangular shape data driven chart is used in this Business power Point template. Use this template for sequential data flow in any presentation.
-
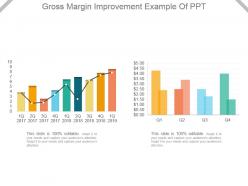 Gross margin improvement example of ppt
Presenting gross margin improvement example of ppt. Presenting gross margin improvement example of ppt. Presenting gross margin improvement example of ppt. This is a gross margin improvement example of ppt. This is two stage process. The stages in this process are business, growth, marketing, strategy, success.
-
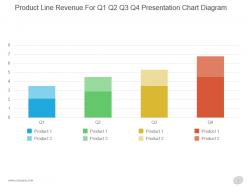 Product line revenue for q1 q2 q3 q4 presentation chart diagram
Presenting product line revenue for q1 q2 q3 q4 presentation chart diagram. This is a product line revenue for q1 q2 q3 q4 presentation chart diagram. This is a four stage process. The stages in this process are product, q.
-
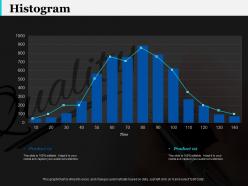 Histogram finance ppt infographic template infographic template
This is a two stage process. The stages in this process are Finance, Analysis, Business, Investment, Marketing.
-
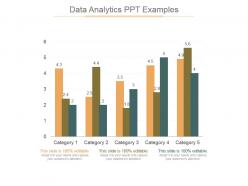 Data analytics ppt examples
Presenting data analytics ppt examples. This is a data analytics ppt examples. This is a five stage process. The stages in this process are data analytics, strategy, marketing, management.
-
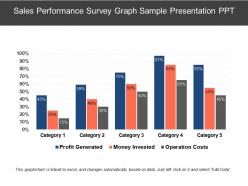 Sales performance survey graph sample presentation ppt
Presenting sales performance survey graph sample presentation PPT diagram. This fully featured PPT template can easily be updated by anyone. Change the font type, color, size, shape, style, background and other important components. Easy and quick downloading is available. Design can be downloaded into JPEG and PDF formats. You can open PPT design with Google Slides and PowerPoint. Both standard and wide screen views are available.
-
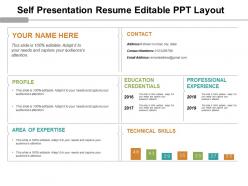 Self presentation resume editable ppt layout
Presenting self presentation resume editable PPT layout presentation template. You can download this template and save into another format such as JPG and PDF and can also display in standard and widescreen view. You can alter the slide such as color, text, font type, font size and aspect ratio. The template gets synced with Google Slides and customizable in PowerPoint. You may share this slide with large segment because it has great pixel quality. You can insert the relevant content in text placeholder of this template.
-
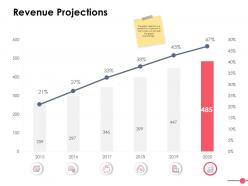 Revenue projections ppt powerpoint presentation file graphics download
Presenting this set of slides with name - Revenue Projections Ppt Powerpoint Presentation File Graphics Download. This is a six stage process. The stages in this process are Finance, Analysis, Business, Investment, Marketing.
-
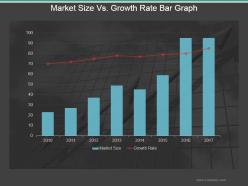 Market size vs growth rate bar graph powerpoint slide images
Presenting market size vs growth rate bar graph powerpoint slide images. This is a market size vs growth rate bar graph powerpoint slide images. This is a eight stage process. The stages in this process are business, marketing, growth, timeline, bar graph.
-
 Prospect org charts ppt powerpoint presentation show example introduction cpb
Presenting this set of slides with name - Prospect Org Charts Ppt Powerpoint Presentation Show Example Introduction Cpb. This is an editable four stages graphic that deals with topics like Prospect Org Charts to help convey your message better graphically. This product is a premium product available for immediate download, and is 100 percent editable in Powerpoint. Download this now and use it in your presentations to impress your audience.
-
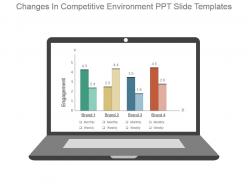 Changes in competitive environment ppt slide templates
Presenting changes in competitive environment ppt slide templates. Presenting changes in competitive environment ppt slide templates. Presenting changes in competitive environment ppt slide templates. This is a changes in competitive environment ppt slide templates. This is four stage process. The stages in this process are engagement, monthly, brand, weekly.
-
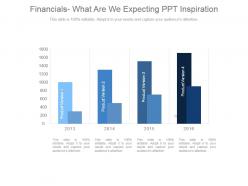 Financials expectations for our company ppt inspiration
Presenting financials expectations for our company ppt inspiration. This is a financials expectations for our company ppt inspiration. This is a four stage process. The stages in this process are product version, product version, product version, product version.
-
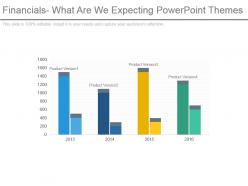 Financials what are we expecting powerpoint themes
Presenting financials what are we expecting powerpoint themes. This is a financials what are we expecting powerpoint themes. This is a four stage process. The stages in this process are product version, business, marketing, financials, success.
-
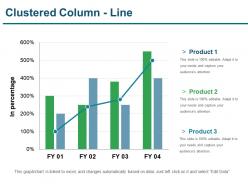 Clustered column line presentation portfolio
Presenting clustered column line presentation portfolio. This is a clustered column line presentation portfolio . This is a four stage process. The stages in this process are financial, clustered column line, analysis, strategy, business.
-
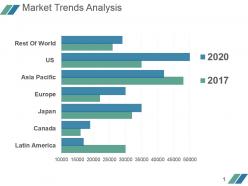 Market trends analysis powerpoint slide design templates
Presenting market trends analysis powerpoint slide design templates. This is a market trends analysis powerpoint slide design templates. This is a seven stage process. The stages in this process are rest of word, us, asia pacific, europe, japan, canada, latin america.
-
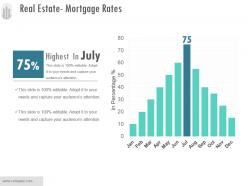 Real estate mortgage rates ppt design templates
Presenting real estate mortgage rates ppt design templates. This is a real estate mortgage rates ppt design templates. This is a twelve stage process. The stages in this process are business, marketing, percentage, management, graph.
-
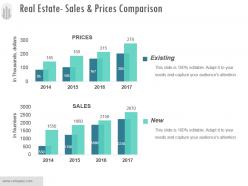 Real estate sales and prices comparison ppt slide
Presenting real estate sales and prices comparison ppt slide. This is a real estate sales and prices comparison ppt slide. This is a two stage process. The stages in this process are prices, sales, existing, new.
-
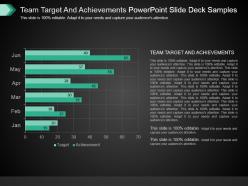 Team target and achievements powerpoint slide deck samples
Presenting team target and achievements powerpoint slide deck samples. This is a team target and achievements powerpoint slide deck samples. This is a six stage process. The stages in this process are team, target, achievements, business, marketing, management, strategy, presentation.


