Data Driven Miscellaneous Measuring Graphics diagrams slides and templates
- Sub Categories
-
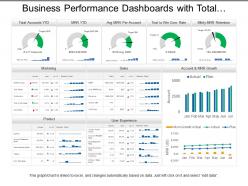 Business performance dashboards with total accounts marketing and product
Presenting, business performance dashboards with total accounts marketing and product PowerPoint template. High-resolution PPT slide to reflect on business performance. The content is accurate and ready to use. Modifiable framework, layout, and font type, font size, and color schemes. Can be quickly transformed into PDF and JPG format. Appealing graphs for illustration and captivating figures to illustrate the idea. Can be extended to widescreen without loss of quality. Compatible with Google Slides and widescreens.
-
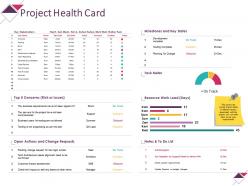 Project health card powerpoint slide information
Presenting this set of slides with name - Project Health Card Powerpoint Slide Information. This is a six stage process. The stages in this process are Task Meter, Resource Work Load, Open Actions And Change, Dashboard, Business.
-
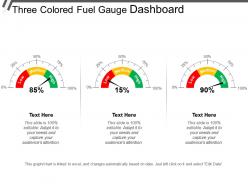 Three colored fuel gauge dashboard
Presenting this set of slides with name - Three Colored Fuel Gauge Dashboard. This is a three stage process. The stages in this process are Fuel Gauge, Gas Gauge, Fuel Containers.
-
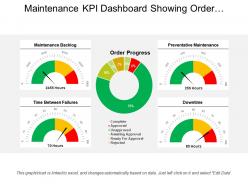 Maintenance kpi dashboard showing order progress and backlog
Presenting our maintenance KPI dashboard showing order progress and backlog. This PPT slide offers you plenty of space to put in titles and sub titles. High resolution-based presentation layout, does not change the image even after resizing. This presentation icon is data driven and template can be downloaded via excel file to incorporate data. Quick downloading speed and simple editing options in color text and fonts.PPT icons can easily be changed into JPEG and PDF applications.
-
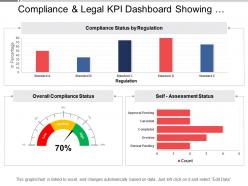 Compliance and legal kpi dashboard showing overall compliance status
Presenting this set of slides with name - Compliance And Legal Kpi Dashboard Showing Overall Compliance Status. This is a three stage process. The stages in this process are Compliance And Legal, Legal Governance, Risk Management.
-
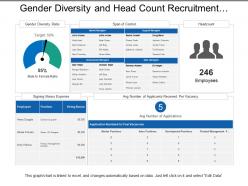 Gender diversity and head count recruitment dashboard
Presenting this set of slides with name - Gender Diversity And Head Count Recruitment Dashboard. This is a two stage process. The stages in this process are Staffing Plan, Recruitment, Staff Management.
-
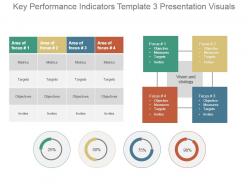 Key performance indicators template 3 presentation visuals
Presenting key performance indicators template 3 presentation visuals. This is a key performance indicators template 3 presentation visuals. This is a four stage process. The stages in this process are metrics, targets, objectives, invites.
-
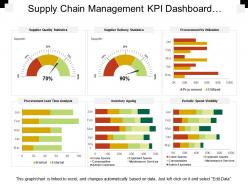 Supply chain management kpi dashboard showing procurement vs utilization
Presenting this set of slides with name - Supply Chain Management Kpi Dashboard Showing Procurement Vs Utilization. This is a six stage process. The stages in this process are Demand Forecasting, Predicting Future Demand, Supply Chain Management.
-
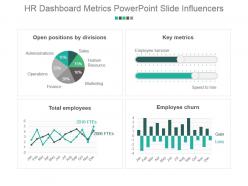 Hr dashboard snapshot metrics powerpoint slide influencers
Presenting hr dashboard snapshot metrics powerpoint slide influencers. This is a hr dashboard metrics powerpoint slide influencers. This is a four stage process. The stages in this process are open positions by divisions, key metrics, total employees, employee churn.
-
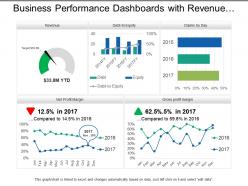 Business performance dashboards with revenue and ratios
Presenting, our business performance dashboards with revenue and ratios PPT deck. Pre-designed chart sheet directed PowerPoint Presentation template. Administration of high-resolution images, graphs, and comparison diagrams. Filled with methods and effects to create an impact. Can be quickly converted into JPEG/JPG or PDF formats as per the requirements. Congenial with Google Slides for ease. Project to widescreen without cringing about pixelating, after downloading explore these characteristics.
-
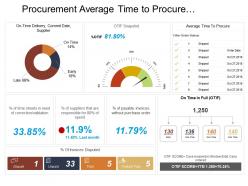 Procurement average time to procure dashboard
Presenting this set of slides with name - Procurement Average Time To Procure Dashboard. This is a seven stage process. The stages in this process are Purchase, Procurement, Buy.
-
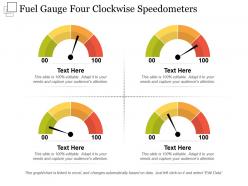 Fuel gauge four clockwise speedometers
Presenting this set of slides with name - Fuel Gauge Four Clockwise Speedometers. This is a four stage process. The stages in this process are Fuel Gauge, Gas Gauge, Fuel Containers.
-
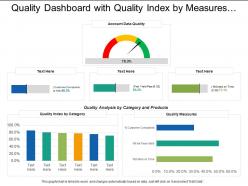 Quality dashboard with quality index by measures and quality index
Presenting this set of slides with name - Quality Dashboard With Quality Index By Measures And Quality Index. This is a three stage process. The stages in this process are Quality Dashboard, Quality Kpi, Quality Metircs.
-
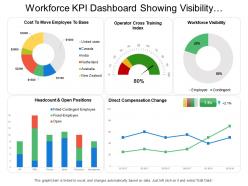 Workforce kpi dashboard showing visibility headcount and direct compensation change
Presenting this set of slides with name - Workforce Kpi Dashboard Showing Visibility Headcount And Direct Compensation Change. This is a five stage process. The stages in this process are Staff, Personnel, Workforce.
-
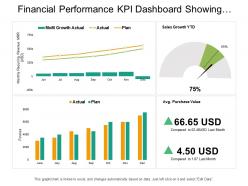 Financial performance kpi dashboard showing sales growth average purchase value
Presenting this set of slides with name - Financial Performance Kpi Dashboard Showing Sales Growth Average Purchase Value. This is a three stage process. The stages in this process are Financial Performance, Financial Report, Financial Review.
-
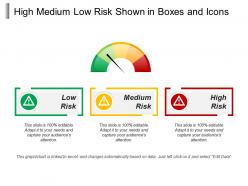 High medium low risk shown in boxes and icons
Presenting this set of slides with name - High Medium Low Risk Shown In Boxes And Icons. This is a three stage process. The stages in this process are High Medium Low, High Moderate Low, Top Medium Low.
-
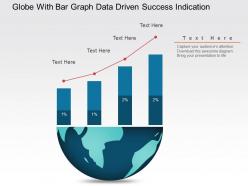 Globe with bar graph data driven success indication powerpoint slides
We are proud to present our globe with bar graph data driven success indication powerpoint slides. Explain the global success indication with this power point template diagram. This PPT diagram contains the graphic of globe with bar graph. Use this PPT diagram for global marketing and business related presentations.
-
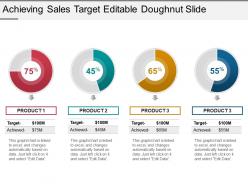 Achieving sales target editable doughnut slide powerpoint slides
The biggest advantage of downloading this sales target achievement doughnut PPT diagram is the use of excel linked chart. Include your business related statistics over linked excel sheet and get it directly updated in the PPT design. Design allows full editing. PPT can be quickly downloaded into JPEG and PDF formats. You can open the design with Google Slides and Microsoft PowerPoint software.
-
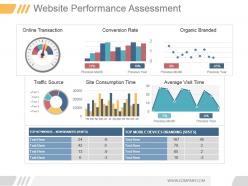 Website performance assessment powerpoint ideas
Presenting website performance assessment powerpoint ideas. This is a website performance assessment powerpoint ideas. This is a three stage process. The stages in this process are online transaction, conversion rate, organic branded, traffic, source, site consumption time, average visit time, previous month, previous year, top keywords non branded visits, top mobile devices branding visits.
-
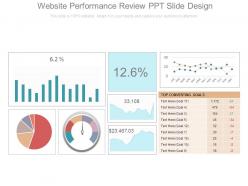 Website performance review ppt slide design
Presenting website performance review ppt slide design. This is a website performance review ppt slide design. This is a four stage process. The stages in this process are business, strategy, finance, management, marketing.
-
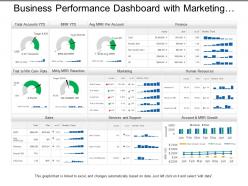 Business performance dashboard with marketing human resource and sales
Presenting, business performance dashboard with marketing human resource and sales PPT deck. This PPT deck focuses on one of the aspects of business marketing with content broadly researched by our business research team. Quickly editable color combinations, layout, text boxes, and font. Alluring graphs for illustration with relatable images to explain the concept. Transform into PDF and JPG format at ease. Predesigned content is adaptable and can be projected to widescreen for business meetings.
-
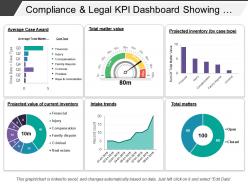 Compliance and legal kpi dashboard showing total matter value
Presenting this set of slides with name - Compliance And Legal Kpi Dashboard Showing Total Matter Value. This is a six stage process. The stages in this process are Compliance And Legal, Legal Governance, Risk Management.
-
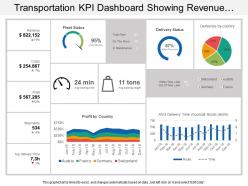 Transportation kpi dashboard snapshot showing revenue costs profit fleet status
Presenting KPI dashboard snapshot showing revenue costs profit fleet status slideshow. Change PowerPoint structure, font, text, color and design as per your requirements. Easy to input data with excel linked charts, just right to click to input data. This presentation theme is totally attuned with Google slides. Easy conversion to other software’s like JPG and PDF formats. Image quality of these PPT diagram remains the unchanged even when you resize the image or portray on large screens.
-
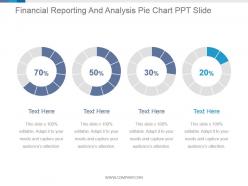 Financial reporting and analysis pie chart ppt slide
Presenting financial reporting and analysis pie chart ppt slide. This is a financial reporting and analysis pie chart ppt slide. This is a four stage process. The stages in this process are finance, marketing, percentage, process, success.
-
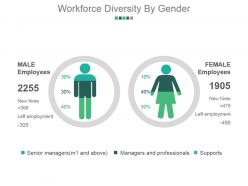 Workforce diversity by gender powerpoint slide design ideas
Presenting workforce diversity by gender powerpoint slide design ideas. This is a workforce diversity by gender powerpoint slide design ideas. This is a two stage process. The stages in this process are male employees, female employees, new hires, left employment.
-
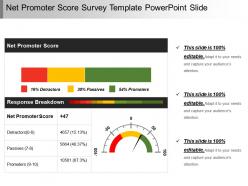 Net promoter score survey template powerpoint slide
Presenting Net Promoter Score Survey Template PowerPoint Slide. Made up of high-resolution graphics. Easy to download and can be saved in a variety of formats. Access to open on a widescreen preview. Compatible with the Google Slides and PowerPoint software. Edit the style, size, and the background of the slide icons as per your needs. Useful for business owners, students, and managers. Can be viewed on standard screen and widescreen without any fear of pixelation.
-
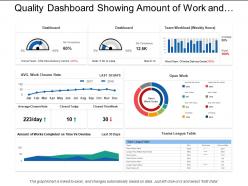 Quality dashboard showing amount of work and the percentage charts
SlideTeam presents to you its quality dashboard showing amount of work and the percentage charts.You can also alter the font size, font color and font style of the text so used in the slides. The business template can be saved in format of PDF or JPG as per your requirements. So download this slideshow and make most of it.
-
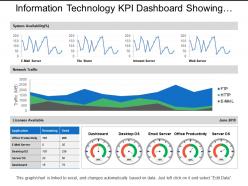 Information technology kpi dashboard showing network traffic system availability
Presenting information technology KPI dashboard showing network traffic system PowerPoint template. Choice to view PowerPoint design in standard and widescreen view. Fully editable Presentation dashboards that can be edited as needed. Easy to download and insert in the ongoing presentation. Convertible into Jpeg and Pdf document. Suitable for managers, leaders, sales and marketing people, analysts, etc. Slides are designed using latest management tools and techniques. The high-resolution view is altogether an experience with a brilliant impact.
-
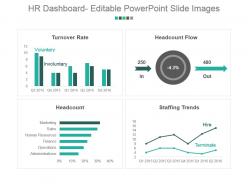 Hr dashboard editable powerpoint slide images
Stunning HR dashboard editable PPT slideshow. Loaded with incomparable benefits. Readymade PPT graphic helps in saving time and effort. Can be personalized by adding company trademark, logo, brand and symbols. Can be utilized for displaying both simple and complex information. Include or exclude slide content as per your individual need. Colors and text can be easily changed as the PPT slide is completely editable. Useful for every business leader and professional, project management team, business analysts, etc.
-
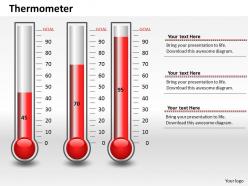 0414 thermometer column chart graphics powerpoint graph
All images are 100% editable in the presentation design. Presentation slide supports changing the color, size and orientation of any icon to your liking. PPT design supports the best graphic features; objects can be re arranged according to the requirement. Smooth animations, transitions and movement of objects across the slide. PPT slide is beneficial in business, academics, science, weather and science projections.
-
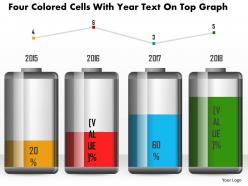 1214 four colored cells with year text on top graph powerpoint slide
We are proud to present our 1214 four colored cells with year text on top graph powerpoint slide. This Power Point template slide has been crafted with graphic of four colored cells and year text on top with graph. This PPT slide is usable for power technology and energy conservation related presentations.
-
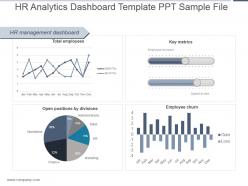 Hr analytics dashboard template ppt sample file
Presenting hr analytics dashboard template ppt sample file. This is a hr analytics dashboard template ppt sample file. This is a four stage process. The stages in this process are hr management dashboard, total employees, key metrics, employee turnover, speed to hire, ftes, jan, feb, mar, apr, may, june, july, aug, sep, oct, nov, dec, open positions by divisions, operations, administrations, sales, hr, marketing, finance, gain, loss, employee churn.
-
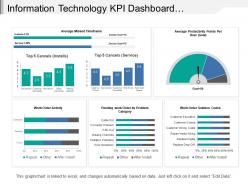 Information technology kpi dashboard showing work order activity
Presenting this set of slides with name - Information Technology Kpi Dashboard Showing Work Order Activity. This is a six stage process. The stages in this process are Information Technology, It, Iot.
-
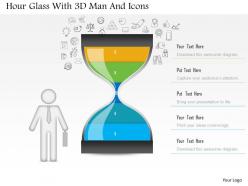 1214 hour glass with 3d man and icons powerpoint slide
We are proud to present our 1214 hour glass with 3d man and icons powerpoint slide. Graphic of hour glass and 3d man with icons are used to craft this power point template slide. This PPT slide contains the concept of time management. Use this PPT slide for all your time related presentations.
-
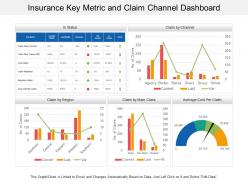 Insurance key metric and claim channel dashboard
• Easy to customize. • Easy to replace any words, picture or number provided in the template with your own content and use it for presentation. • Freedom to incorporate your own company’s name and logo in the presentation for personalization. • The PPT visuals used are of high resolution. • No issue of image pixilation if projected on wide screen. • Compatibility with numerous format and software options. • Widely used by marketers, businessmen, insurance managers and educators.
-
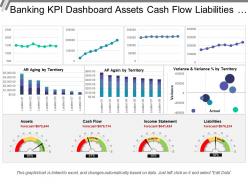 Banking kpi dashboard assets cash flow liabilities income statement
Presenting this set of slides with name - Banking Kpi Dashboard Assets Cash Flow Liabilities Income Statement. This is a three stage process. The stages in this process are Banking, Finance, Money.
-
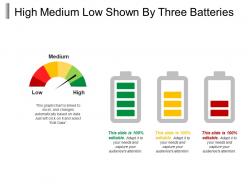 High medium low shown by three batteries
Presenting this set of slides with name - High Medium Low Shown By Three Batteries. This is a two stage process. The stages in this process are High Medium Low, High Moderate Low, Top Medium Low.
-
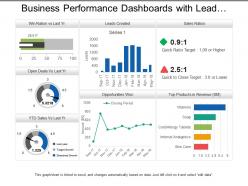 Business performance dashboards with lead creation and sales ratios
Presenting, business performance dashboards with lead creation and sales ratios for cost efficiency and performance indication PPT presentation. Bright and informative PowerPoint presentation slides. Gives regulations to achieve business success and targets. Produces error-free execution. Acts as a model for planning future assignments for marketing capabilities. Fully editable by any user at any point in time. Performs a clarity of marketing and presentation objectives without creating any confusions and misconceptions. Simple to be projected to widescreen without degradation in quality.
-
 Performance metrics icon powerpoint images
Presenting performance metrics icon PowerPoint images PPT slide. This performance metrics slide is easily downloadable and export it into JPEG or PDF format. A presenter can display this performance metrics icon slide in the standard or widescreen view. You can even amend the color, text, font type & font size, aspect ratio, etc. of performance metrics icon slide. The performance metrics icon template gets 100% synced with Google Slides and fully editable in PowerPoint. You can share this performance metrics icon slide easily with large segment due to its tremendous pixel quality. The performance metrics icon slide gets linked with the excel sheet.
-
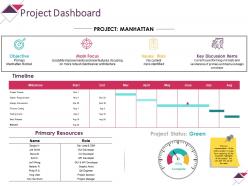 Project dashboard powerpoint slide influencers
Presenting this set of slides with name - Project Dashboard Powerpoint Slide Influencers. This is a four stage process. The stages in this process are Main Focus, Objective, Issues Risks, Key Discussion Items, Dashboard.
-
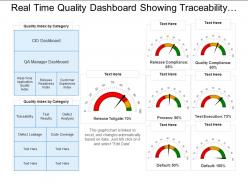 Real time quality dashboard showing traceability test results defects analysis
Presenting this set of slides with name - Real Time Quality Dashboard Showing Traceability Test Results Defects Analysis. This is a three stage process. The stages in this process are Quality Dashboard, Quality Kpi, Quality Metircs.
-
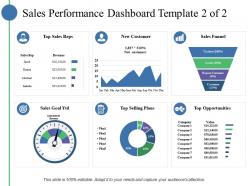 Sales performance dashboard top sales reps new customer
Introducing sales performance dashboard top sales reps new customer PowerPoint template. Presentation slides are crafted with high quality resolution designs. PPT templates comes in standard and widescreen view. Instant download and can be converted into other formats i.e. JPEG and PDF. Perfect for business management experts and research development team. Replace the watermark with your company’s logo. Possess time saving qualities. Presentation slides are well-matched with Google slides. Fast download and effortlessly inclusion in your presentation.
-
 1214 battery with empty sign for power generation powerpoint slide
We are proud to present our 1214 battery with empty sign for power generation powerpoint slide. This Power point template slide has been crafted with graphic of battery with empty sign. This PPT slide contains the concept of power generation. This PPT slide is usable for power related presentations.
-
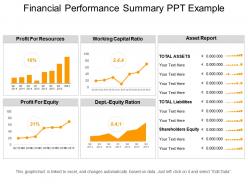 Financial performance summary ppt example
Presenting Financial Performance Summary PPT Example. It is professionally designed and 100% editable. You can alter the color, font, font size and font types of the slide. This template is easily adaptable with Google Slides which makes it easily accessible at once. Can be converted into various formats like JPG, PDF and PNG. It is available in both standard and widescreen.
-
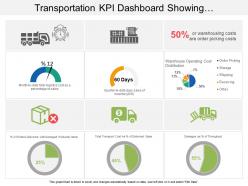 Transportation kpi dashboard snapshot showing warehouse operating cost distribution
Presenting transportation KPI dashboard snapshot showing warehouse operating cost distribution PPT slide. Simple data input like company logo, name or trademark. User can edit the data in linked excel sheet and graphs and charts gets customized accordingly. Picture quality of these slides does not change even when project on large screen. Fast downloading speed and formats can be easily changed to JPEG and PDF applications. This template is suitable for marketing, sales persons, business managers and entrepreneurs.
-
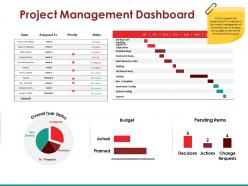 Project management dashboard powerpoint slide ideas
Presenting this set of slides with name - Project Management Dashboard Powerpoint Slide Ideas. This is a four stage process. The stages in this process are Overall Task Status, Budget, Pending Items, Decisions.
-
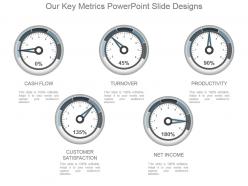 Our key metrics powerpoint slide designs
Presenting our key metrics PowerPoint slide designs. This power point slide offers you plenty of space to put in titles and sub titles. High resolution-based presentation layout does not change the image even after resizing. This presentation icon is fully compatible with Google slides. Quick downloading speed and simple editing options in color text and fonts.PPT icons can easily be changed into JPEG and PDF applications. This diagram has been designed for entrepreneurs, corporate and business managers.
-
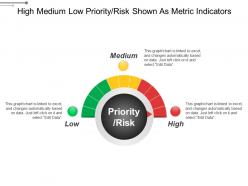 High medium low priority risk shown as metric indicators
Presenting this set of slides with name - High Medium Low Priority Risk Shown As Metric Indicators. This is a three stage process. The stages in this process are High Medium Low, High Moderate Low, Top Medium Low.
-
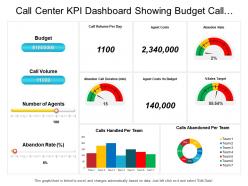 Call center kpi dashboard showing budget call volume agent costs percentage sales target
Presenting this set of slides with name - Call Center Kpi Dashboard Showing Budget Call Volume Agent Costs Percentage Sales Target. This is a four stage process. The stages in this process are Call Center Agent, Customer Care, Client Support.
-
 Data visualization
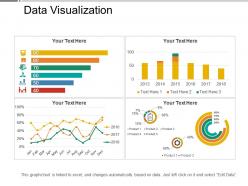
Presenting this Data Visualization PowerPoint slide. This PPT presentation is Google Slides compatible hence it is easily accessible. You can download and save this PowerPoint layout in different formats like PDF, PNG, and JPG. This PPT theme is available in both 4:3 and 16:9 aspect ratios. As this PowerPoint template is 100% editable, you can modify color, font size, font type, and shapes as per your requirements.
-
 Red blue green three colored fuel gauge dashboard
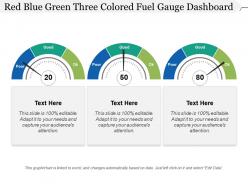
Presenting this set of slides with name - Red Blue Green Three Colored Fuel Gauge Dashboard. This is a three stage process. The stages in this process are Fuel Gauge, Gas Gauge, Fuel Containers.
-
 1214 green battery cell with full charging symbol powerpoint slide
We are proud to present our 1214 green battery cell with full charging symbol powerpoint slide. This power point template slide has been designed with graphic of green battery cell with full charging symbol. This PPT slide contains the concept of power technology and energy conservation. Use this PPT slide for your technology related presentations.
-
 Call center kpi dashboard showing satisfaction index customer retention
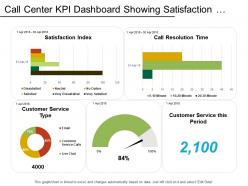
Presenting this set of slides with name - Call Center Kpi Dashboard Showing Satisfaction Index Customer Retention. This is a five stage process. The stages in this process are Call Center Agent, Customer Care, Client Support.
-
 Inventory and logistics warehouse operating costs dashboard
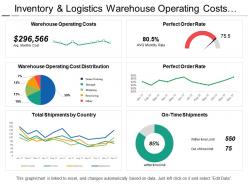
Presenting inventory and logistics warehouse operating costs dashboard PPT slideshow. Editable charts, visuals, colors and text. Presentable and easy to comprehend info graphic format. The presentation template can be downloaded and saved in any desired format. Privilege of insertion of logo and trademarks for more personalization. Adaptable to wide screen view without the problem of pixilation. Can be used with Google slides. Easy to edit and customize as per your needs. Beneficial for industry professionals, managers, executives, researchers, sales people, etc.
-
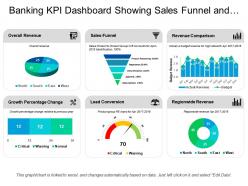 Banking kpi dashboard showing sales funnel and overall revenue
Presenting this set of slides with name - Banking Kpi Dashboard Showing Sales Funnel And Overall Revenue. This is a six stage process. The stages in this process are Banking, Finance, Money.
-
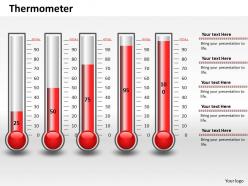 0414 percentage data thermomete column chart powerpoint graph
The PPT images offer compatibility with Google templates. High resolution icons for clear message delivery. An easy access to make the desired changes or edit it anyways. Wide screen view of the slides. Easy conversion into JPG or PDF format. Unique and informational content. Valuable for health and care professionals.
-
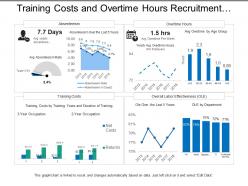 Training costs and overtime hours recruitment dashboard
Presenting this set of slides with name - Training Costs And Overtime Hours Recruitment Dashboard. This is a four stage process. The stages in this process are Staffing Plan, Recruitment, Staff Management.
-
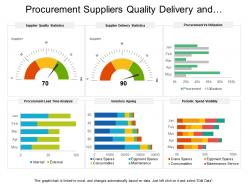 Procurement suppliers quality delivery and utilization dashboard
Presenting this set of slides with name - Procurement Suppliers Quality Delivery And Utilization Dashboard. This is a six stage process. The stages in this process are Purchase, Procurement, Buy.
-
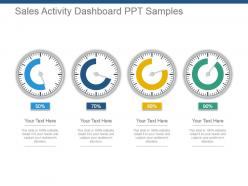 Sales activity dashboard snapshot ppt samples
Presenting sales activity dashboard snapshot ppt samples. This is a sales activity dashboard ppt samples. This is a four stage process. The stages in this process are sales, activity, dashboard, financial, strategy.
-
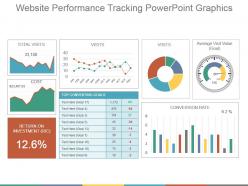 Website performance tracking powerpoint graphics
Presenting website performance tracking powerpoint graphics. This is a website performance tracking powerpoint graphics. This is a three stage process. The stages in this process are total visits, conversion rate, return on investment, average visit value.


