Data Driven Miscellaneous Measuring Graphics diagrams slides and templates
- Sub Categories
-
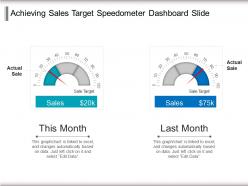 Achieving sales target speedometer dashboard slide ppt inspiration
Presenting achieving sales target speedometer dashboard slide PPT inspiration presentation template. The dashboard slide is compatible with Google Slides. A user may add his organization's logo and alter template according to his organization’s brand. Since the template is 100% editable in PowerPoint and all the graphics which include background, themes, font size, font type, aspect ratios, and shapes are fully customizable. Template's quality remains the same, even after doing changes in it. The excel linked template is also compatible with other formats such as JPEG and PDF.
-
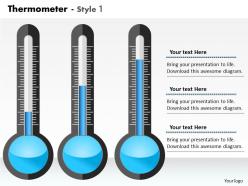 0414 thermometer design column chart powerpoint graph
PPT slide supports resize, recolor and reverse the images. Good quality images can be used to compliment and reinforce message. Works well in Windows 7, 8, 10, XP, Vista and Citrix. Editing in presentation slide show can be done from anywhere by any device. PDF integrated features help to convert PPT to PDF. Supports to work offline and later upload the changes.
-
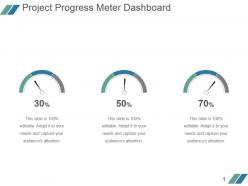 Project progress meter dashboard powerpoint slide designs download
Presenting project progress meter dashboard powerpoint slide designs download. This is a project progress meter dashboard powerpoint slide designs download. This is a three stage process. The stages in this process are business, marketing, dashboard, percentage.
-
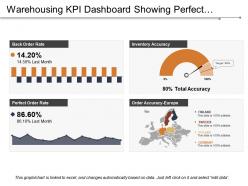 Warehousing kpi dashboard showing perfect order rate and inventory accuracy
PPT design can instantly be downloaded as JPEG and PDF formats. Design template is easily editable, the best advantage of this business oriented PPT design is the use of excel linked charts, where charts in PPT design will automatically get changed when you update storage related figures on linked excel sheet. The PPT design is fully compatible with Google Slides and MS PowerPoint software. Design can be viewed both in standard and full screen view.
-
 Performance meter 4 stages gauges
Get a chance to explore, the performance meter PowerPoint Presentation Slide. This Presentation has been designed by professionals and is fully editable. You can reshape the font size, font type, colors, and even the background. This Template is attainable with Google Slide and can be saved in JPG or PDF format without any nuisance created. Fast download at the click of the button.
-
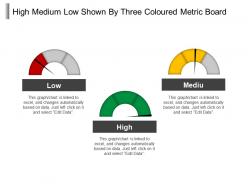 High medium low shown by three coloured metric board
Presenting this set of slides with name - High Medium Low Shown By Three Coloured Metric Board. This is a three stage process. The stages in this process are High Medium Low, High Moderate Low, Top Medium Low.
-
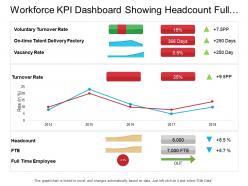 Workforce kpi dashboard showing headcount full time employee and turnover rate
Presenting this set of slides with name - Workforce Kpi Dashboard Showing Headcount Full Time Employee And Turnover Rate. This is a three stage process. The stages in this process are Staff, Personnel, Workforce.
-
 0414 thermometer 4 staged column chart powerpoint graph
We are proud to present our 0414 thermometer 4 staged column chart powerpoint graph. Our Thermometer 4 Staged Column Chart Powerpoint Graph Powerpoint Templates are the layers of your gourmet cake. Provide the icing of your ideas and produce a masterpiece. Use our Thermometer 4 Staged Column Chart Powerpoint Graph Powerpoint Templates and and feel the difference. Right off they generate a surge of interest.
-
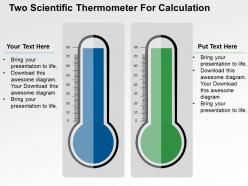 Two scientific thermometer for calculation powerpoint slides
They act as a perfect mode for the transfer of information from organisation to the viewers. An error free environment can be created with these designs. True and Accurate information is delivered to the spectators. Simple steps are need to be followed in order to download or edit them. They display professionalism. They are technology and result oriented.
-
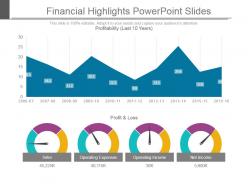 Financial highlights powerpoint slides
Presenting financial highlights powerpoint slides. This is a financial highlights powerpoint slides. This is a four stage process. The stages in this process are profit and loss, sales, operating expenses, operating income, net income.
-
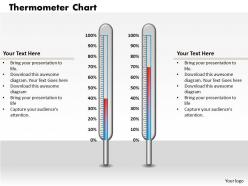 0414 thermometer column chart to compare data powerpoint graph
We are proud to present our 0414 thermometer column chart to compare data powerpoint graph. Timeline crunches are a fact of life. Meet all deadlines using our Thermometer Column Chart To Compare Data Powerpoint Graph Powerpoint Templates. Connect the dots using our Thermometer Column Chart To Compare Data Powerpoint Graph Powerpoint Templates. Fan expectations as the whole picture emerges.
-
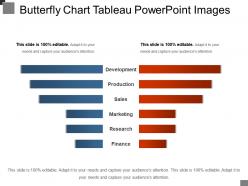 Butterfly chart tableau powerpoint images
Presenting Butterfly Chart Table. This template is Excel-linked and data driven. Edit the excel sheet as per your data and the chart will customize automatically. You can also make alterations in the font type, font size, and background colors as per your requirements. This template is completely compatible with Google Slides and can be transformed into JPG and PDF formats. Download this butterfly template in standard screen (4:3) and widescreen (16:9)
-
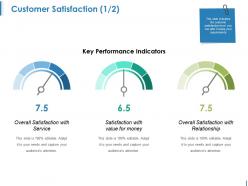 Customer satisfaction ppt background
Presenting this set of slides with name - Customer Satisfaction Ppt Background. This is a three stage process. The stages in this process are Overall Satisfaction With Service, Satisfaction With Value For Money, Overall Satisfaction With Relationship.
-
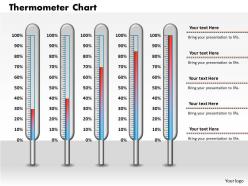 0414 thermometer column chart design powerpoint graph
Educate your team with the knowledge you have gained. Professionals can use this slide for health and column chart graph representation. All the colors used in the PPT slide is editable. Use this template in full screen for the best experience, get rid of the watermark and use it with google slides, just click download and follow the steps.
-
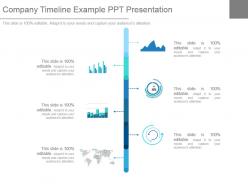 Company timeline example ppt presentation
Presenting company timeline example ppt presentation. This is a company timeline example ppt presentation. This is a six stage process. The stages in this process are business, marketing, icons, strategy, timeline.
-
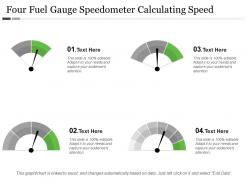 Four fuel gauge speedometer calculating speed
Presenting this set of slides with name - Four Fuel Gauge Speedometer Calculating Speed. This is a four stage process. The stages in this process are Fuel Gauge, Gas Gauge, Fuel Containers.
-
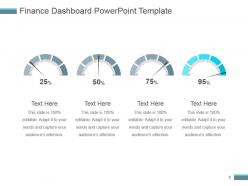 Finance dashboard snapshot powerpoint template
Presenting finance dashboard powerpoint template. This is a finance dashboard snapshot powerpoint template. This is a four stage process. The stages in this process are dashboard, finance, percentage, business, marketing.
-
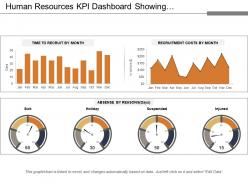 Human resources kpi dashboard showing recruitment costs and absence by reason
Presenting this set of slides with name - Human Resources Kpi Dashboard Showing Recruitment Costs And Absence By Reason. This is a three stage process. The stages in this process are Human Resource, Hrm, Human Capital.
-
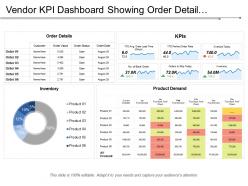 Vendor kpi dashboard showing order detail inventory and orders to ship today
Presenting this set of slides with name - Vendor Kpi Dashboard Showing Order Detail Inventory And Orders To Ship Today. This is a four stage process. The stages in this process are Vendor, Supplier, Retailer.
-
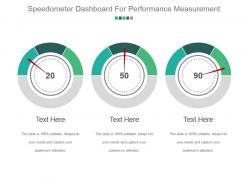 Speedometer dashboard for performance measurement powerpoint slide backgrounds
Presenting speedometer dashboard for performance measurement powerpoint slide backgrounds. This is a speedometer dashboard for performance measurement powerpoint slide backgrounds. This is a three stage process. The stages in this process are measure, meter, dashboard, speedometer, needle.
-
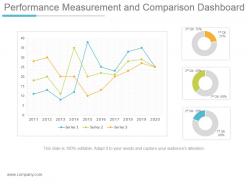 Performance measurement and comparison dashboard snapshot ppt design
Presenting performance measurement and comparison dashboard snapshot ppt design. This is a performance measurement and comparison dashboard ppt design. This is a three stage process. The stages in this process are series, qtr.
-
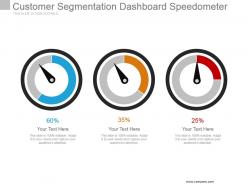 Customer segmentation dashboard speedometer powerpoint slide
Presenting customer segmentation dashboard speedometer powerpoint slide. This is a customer segmentation dashboard speedometer powerpoint slide. This is a three stage process. The stages in this process are dashboard, measurement, business, strategy, success.
-
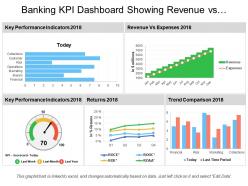 Banking kpi dashboard showing revenue vs expenses and returns
Presenting this set of slides with name - Banking Kpi Dashboard Showing Revenue Vs Expenses And Returns. This is a five stage process. The stages in this process are Banking, Finance, Money.
-
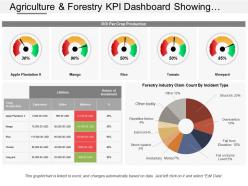 Agriculture and forestry kpi dashboard showing roi per crop production and industry claim count
Presenting agriculture and forestry KPI dashboard showing ROI per crop production and industry claim count PowerPoint slide. Unaffected high-resolution PowerPoint slide. Include or exclude slide content as per your individual need. Personalize the presentation with individual company name and logo. Beneficial for industry professionals, managers, executives, researchers, sales people, etc. This template is available in both Standard and Widescreen slide size. Easy and quick downloading process. Flexible option for conversion in PDF or JPG formats. Compatible with Google slides.
-
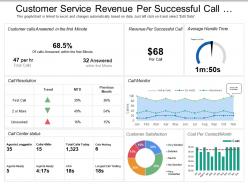 Customer service revenue per successful call dashboard
Presenting this set of slides with name - Customer Service Revenue Per Successful Call Dashboard. This is a three stage process. The stages in this process are Customer Base, Recurring Customers, Customer Services.
-
 Transportation kpi dashboard snapshot showing fleet delivery status loading time and weight
Presenting transportation KPI dashboard snapshot showing fleet delivery status loading time and weight PPT slide. Simple data input with linked Excel chart, just right click to input values. This PowerPoint theme is fully supported by Google slides. Picture quality of these slides does not change even when project on large screen. Fast downloading speed and formats can be easily changed to JPEG and PDF applications. This template is suitable for marketing, sales persons, business managers and entrepreneurs.
-
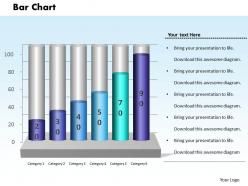 0414 percentage growth column chart powerpoint graph
Presentation slide supports changing the color, size and orientation of any icon to your liking. It’s easy for the PPT design to run smoothly on any software. All images are 100% editable in the presentation visual. Best feature being the conversion of presentation slide show to PDF or JPG format. Can be used by businesses of all sizes. Offers high resolution without compromising on pixels quality in PPT layout when viewed on a larger screen. Compatible with Google slides.
-
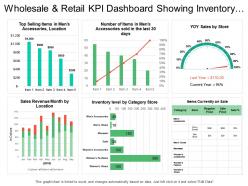 Wholesale and retail kpi dashboard showing inventory level by category sales revenue month
Presenting the retail business slide for PowerPoint. This presentation template is 100% modifiable in PowerPoint and is designed by professionals. You can edit the objects in the slide like font size and font color very easily. This presentation slide is fully compatible with Google Slide and can be saved in JPG or PDF file format without any fuss. Click on the download button to download this template in no time.
-
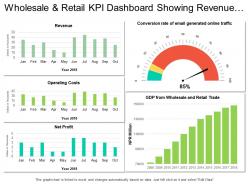 Wholesale and retail kpi dashboard showing revenue operating costs net profit
Presenting the KPI dashboard presentation template. This PowerPoint slide is fully editable in PowerPoint and is professionally designed. The user can bring changes to edit the objects in the slide like font size and font color without going through any hassle. This presentation slide is 100% compatible with Google Slide and can be saved in JPG or PDF file format without any fuss. Fast download this at the click of the button.
-
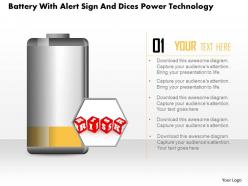 1214 battery with alert sign and dices power technology powerpoint slide
We are proud to present our 1214 battery with alert sign and dices power technology powerpoint slide. Graphic of battery with alert sign and dices are used to craft this power point template. This PPT contains the concept of energy conservation and power technology. Use this PPT for your energy and technology related presentations.
-
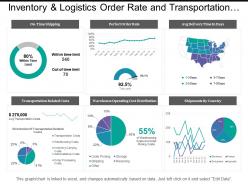 Inventory and logistics order rate and transportation costs dashboards
Presenting this set of slides with name - Inventory And Logistics Order Rate And Transportation Costs Dashboards. This is a three stage process. The stages in this process are Inventory And Logistics, Inventory Management, Warehousing And Inventory Management.
-
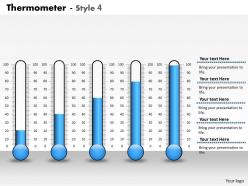 0414 thermometer column chart for growth powerpoint graph
We are proud to present our 0414 thermometer column chart for growth powerpoint graph. Our Thermometer Column Chart For Growth Powerpoint Graph Powerpoint Templates are building a great reputation. Of being the driving force of a good presentation. Use our Thermometer Column Chart For Growth Powerpoint Graph Powerpoint Templates and surely win the game. As a presenter gain great name and fame.
-
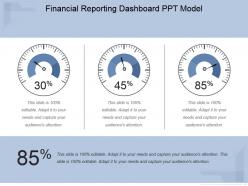 Financial reporting dashboard snapshot ppt model
Presenting financial reporting dashboard ppt model. This is a financial reporting dashboard snapshot ppt model. This is a three stage process. The stages in this process are business, dashboard, financial, measuring, meter.
-
 Lead scoring powerpoint slide
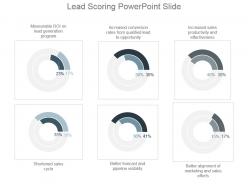
Presenting lead scoring powerpoint slide. This is a lead scoring powerpoint slide. This is a six stage process. The stages in this process are measurable roi on lead generation program, increased conversion rates from qualified lead to opportunity, increased sales productivity and effectiveness, shortened sales cycle, better forecast and pipeline visibility, better alignment of marketing and sales efforts.
-
 Employee performance result slide powerpoint slide influencers
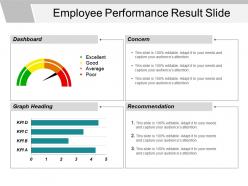
Presenting Employee Performance Result Slide PowerPoint Slide Influencers. Download this slide and save this in JPG and PDF formats along with the various other formats. A user can display this employee performance result template on either standard or wide screen. The infographic performance slide design is completely compatible with Google Slides and fully customizable in PowerPoint. Sharing of employee performance slide with large segment is easy due to its superb pixel quality. You can modify the color, text, font style & font size and aspect ratio of this infographic employee performance slide.
-
 Fuel gauge six center arrow center oil machine
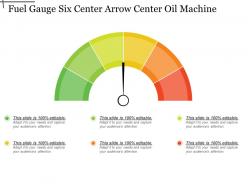
Presenting this set of slides with name - Fuel Gauge Six Center Arrow Center Oil Machine. This is a one stage process. The stages in this process are Fuel Gauge, Gas Gauge, Fuel Containers.
-
 Comparison powerpoint templates
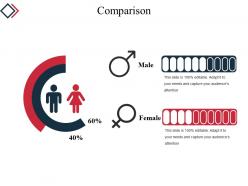
Presenting Comparison PowerPoint Templates presentation. This template is designed by experts. The slideshow is compatible with Google Slides and customizable in PowerPoint and other office suites. Modify the slide an innumerable number of times. You can add your company name or logo to the slide. The template can be converted into various image and document formats such as JPG, PDF, etc. with ease.
-
 Dashboard snapshot powerpoint guide
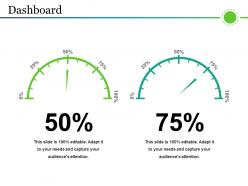
Presenting the Dashboard Snapshot PowerPoint Guide template. The can be downloaded and saved in general image or document formats such as JPEG and PDF. Slideshow supports both the standard(4:3) and widescreen(16:9) sizes. Further, it is compatible with Google Slides and MS PowerPoint. You are free to alter the style, size, background and other attributes of the layout. High-quality graphics will ensure that the quality remains the same even you increase their size.
-
 0414 thermometer column chart style graphics powerpoint graph
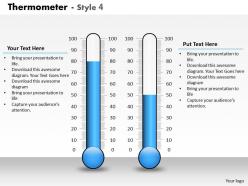
We are proud to present our 0414 thermometer column chart style graphics powerpoint graph. Put the wind in your sails with our Thermometer Column Chart Style Graphics Powerpoint Graph Powerpoint Templates. Skim smoothly over the choppy waters of the market. Let our Thermometer Column Chart Style Graphics Powerpoint Graph Powerpoint Templates give the updraft to your ideas. See them soar to great heights with ease.
-
 0414 thermometer column chart with 10 stages powerpoint graph
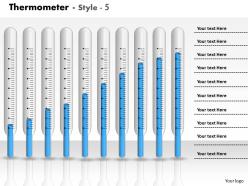
We are proud to present our 0414 thermometer column chart with 10 stages powerpoint graph. Bubbling and bursting with ideas are you. Let our Thermometer Column Chart With 10 Stages Powerpoint Graph Powerpoint Templates give them the shape for you. You have gained great respect for your brilliant ideas. Use our Thermometer Column Chart With 10 Stages Powerpoint Graph Powerpoint Templates to strengthen and enhance your reputation.
-
 3 harvey balls for result analysis example of ppt
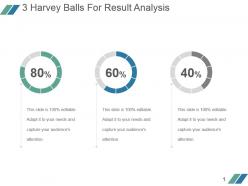
Presenting 3 harvey balls for result analysis example of ppt. This is a 3 harvey balls for result analysis example of ppt. This is a three stage process. The stages in this process are finance, process, business, marketing, percentage.
-
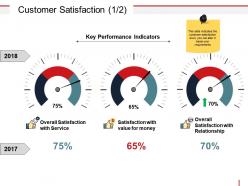 Customer satisfaction powerpoint images
Presenting customer satisfaction powerpoint images. This is a customer satisfaction powerpoint images. This is a three stage process. The stages in this process are key performance indicators, percentage, year, measurement, dashboard.
-
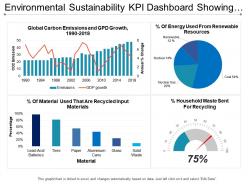 Environmental sustainability kpi dashboard showing global carbon emission and gdp growth
Presenting this set of slides with name - Environmental Sustainability Kpi Dashboard Showing Global Carbon Emission And Gdp Growth. This is a four stage process. The stages in this process are Environment Sustainability, Environment Continual, Environment Feasibility.
-
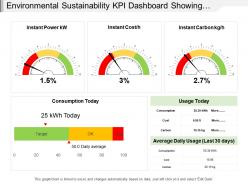 Environmental sustainability kpi dashboard showing instant power cost carbon and consumption
Presenting this set of slides with name - Environmental Sustainability Kpi Dashboard Showing Instant Power Cost Carbon And Consumption. This is a three stage process. The stages in this process are Environment Sustainability, Environment Continual, Environment Feasibility.
-
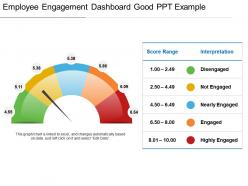 Employee engagement dashboard snapshot good ppt example
Presenting employee engagement dashboard snapshot good PPT example presentation slides. Simple data input like company logo, name or trademark. This PowerPoint template is fully supported by Google Slides. User can edit the data in linked excel sheet and graphs and charts gets customized accordingly. This layout offers fast downloading speed and formats can be easily changed to JPEG and PDF applications. This template is suitable for marketing, sales persons, business managers and entrepreneurs. Adjust PPT layout, font, text and color as per your necessity.
-
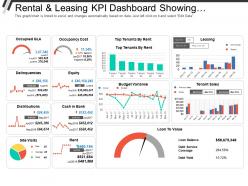 Rental and leasing kpi dashboard showing occupancy cost equity loan to value
Presenting this set of slides with name - Rental And Leasing Kpi Dashboard Showing Occupancy Cost Equity Loan To Value. This is a three stage process. The stages in this process are Rental And Leasing, Dealing And Leasing, Rental And Engage.
-
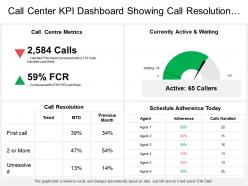 Call center kpi dashboard showing call resolution currently active and waiting
Presenting this set of slides with name - Call Center Kpi Dashboard Showing Call Resolution Currently Active And Waiting. This is a one stage process. The stages in this process are Call Center Agent, Customer Care, Client Support.
-
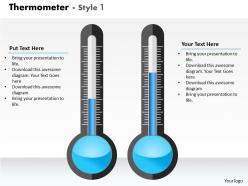 0414 thermometer column chart to display data powerpoint graph
We are proud to present our 0414 thermometer column chart to display data powerpoint graph. Let our Thermometer Column Chart To Display Data Powerpoint Graph Powerpoint Templates mark the footprints of your journey. Illustrate how they will lead you to your desired destination. Conjure up grand ideas with our magical Thermometer Column Chart To Display Data Powerpoint Graph Powerpoint Templates. Leave everyone awestruck by the end of your presentation.
-
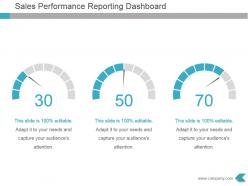 Sales performance reporting dashboard powerpoint template
Presenting sales performance reporting dashboard powerpoint template. This is a sales performance reporting dashboard powerpoint template. This is a three stage process. The stages in this process are dashboard, management, process, strategy, analysis.
-
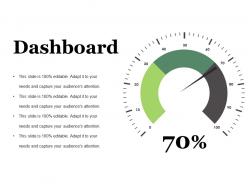 Dashboard snapshot ppt summary maker
Presenting this set of slides with name - Dashboard Snapshot Ppt Summary Maker. This is a one stage process. The stages in this process are Dashboard, Meter, Speed, Measure, Planning.
-
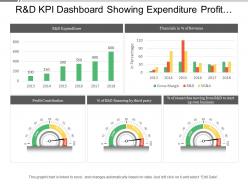 R and d kpi dashboard showing expenditure profit contribution and financial in percentage of revenue
Presenting this set of slides with name - R And D Kpi Dashboard Showing Expenditure Profit Contribution And Financial In Percentage Of Revenue. This is a five stage process. The stages in this process are R And D, Research And Development, Research And Technological Development.
-
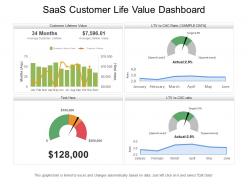 Saas customer life value dashboard
Introducing Saas customer life value dashboard PPT template. An easy access to make the desired changes or edit it anyways. Wide screen view of the slides. Easy conversion into Jpeg or Pdf format. The PPT images offer compatibility with Google templates. High resolution icons for clear message delivery. Unique and informational content. Valuable for business professionals, sales representatives, marketing professionals, students and selling investigators. High quality charts and visuals used in the designing process. They enhance the performance of the presentation.
-
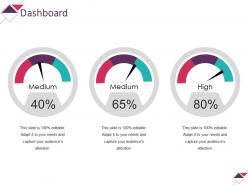 Dashboard powerpoint slide
Presenting this set of slides with name - Dashboard Powerpoint Slide. This is a three stage process. The stages in this process are Medium, Medium, High, Dashboard, Business, Percentage.
-
 0514 unique design thermometer graphic powerpoint slides
We are proud to present our 0514 unique design thermometer graphic powerpoint slides. Unique design scientific thermometer is used in this Business Power Point template. To display various reading in any science related presentation use this graphic masterpiece and get noticed.
-
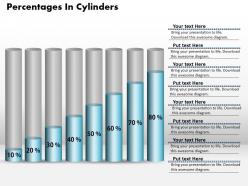 0414 cylinders column chart of percentage growth powerpoint graph
PPT example works perfectly with Google slides. Fluently download and variable into JPEG and PDF document. Smoothly editable PowerPoint clipart as color, text and font are editable. Alternate of insertion of trade representation and pictograph for personalization. Presentation slide template can be exhibited in both standard and widescreen view. Convenience to download identical designs with different nodes and stages. Perfect for business entrepreneurs, event management team, project management team, industry professionals etc.
-
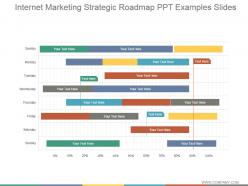 Internet marketing strategic roadmap ppt examples slides
Presenting internet marketing strategic roadmap ppt examples slides. This is a internet marketing strategic roadmap ppt examples slides. This is a seven stage process. The stages in this process are business, marketing, management, strategy, success.
-
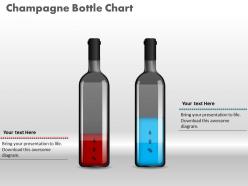 0414 percentage data champagne bottle column chart powerpoint graph
Picture quality does not deter when opened on a big screen display. Trouble-free incorporation of customized content or graphics. Provided guidance to modify the graphical content. Save the presentation visual in JPG or PDF format. Compatible with the online as well as offline PowerPoint softwares. Effectively useful for the Marketing professionals, interpreters and the strategy designers.
-
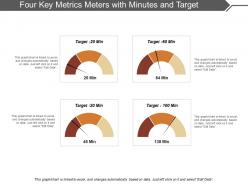 Four key metrics meters with minutes and target
This highly professional PPT design is completely customizable; you can modify and personalize the design according to your business requirements. You can include business name, logo, and trademark into the design to make it personalized design. The design slides are easily downloadable on a single click into JPEG and PDF formats and can be opened with Google Slides and Microsoft PowerPoint software.
-
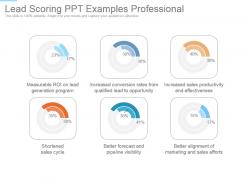 Lead scoring ppt examples professional
Presenting lead scoring ppt examples professional. This is a lead scoring ppt examples professional. This is a six stage process. The stages in this process are measurable roi on lead generation program, increased conversion rates from qualified lead to opportunity, increased sales productivity and effectiveness, shortened sales.
-
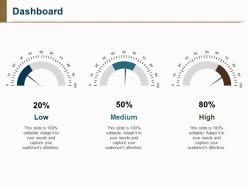 Dashboard Snapshot ppt slide templates
Presenting dashboard snapshot PPT slide templates PPT slide. The speedometer dashboard excel presentation template designed by the designers of SlideTeam to give presentation on various subjects. The speedometer icon dashboard PPT slide is 100% editable in PowerPoint. The speedometer dashboard excel template is compatible with Google Slide and the template gets linked with Excel data sheet. You can make changes in the font size, font type, color as well as dimensions of the circular icons in the dashboard speedometer slide as per the requirement.


