Data Driven Miscellaneous Measuring Graphics diagrams slides and templates
- Sub Categories
-
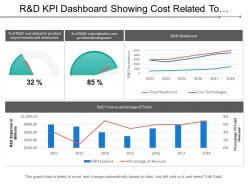 R and d kpi dashboard showing cost related to product improvements and extensions
Presenting this set of slides with name - R And D Kpi Dashboard Showing Cost Related To Product Improvements And Extensions. This is a four stage process. The stages in this process are R And D, Research And Development, Research And Technological Development.
-
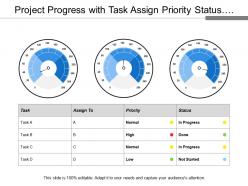 Project progress with task assign priority status and meter with different rating
Presenting this set of slides with name - Project Progress With Task Assign Priority Status And Meter With Different Rating. This is a three stage process. The stages in this process are Project Progress, Project Growth, Project Management.
-
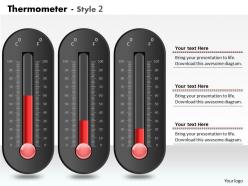 0414 thermometer designed column chart powerpoint graph
PPT slide is compatible with Google slide. High resolution. PPT visual is useful to businessmen, academicians, for science, weather and science projections. Presentation slide show helps to insert links of stored files and can be used t create animated GIF if required. PPT graphic can be optimized and viewed in tablets, phone, widescreen monitors and projector screens.
-
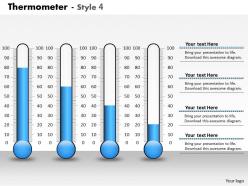 0414 increasing flow thermometer column chart powerpoint graph
We are proud to present our 0414 increasing flow thermometer column chart powerpoint graph. Our Increasing Flow Thermometer Column Chart Powerpoint Graph Powerpoint Templates are the layers of your gourmet cake. Provide the icing of your ideas and produce a masterpiece. Use our Increasing Flow Thermometer Column Chart Powerpoint Graph Powerpoint Templates and and feel the difference. Right off they generate a surge of interest.
-
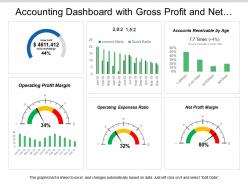 Accounting dashboard with gross profit and net profit margin
Introducing accounting dashboard with gross profit and net profit margin PPT slideshow. Loaded with incomparable benefits. Readymade PPT graphic helps in saving time and effort. Can be personalized by adding company trademark, logo, brand and symbols. Can be utilized for displaying both simple and complex information. Include or exclude slide content as per your individual need. Colors and text can be easily changed as the PPT slide is completely editable. Useful for every business leader and professional, project management team, business analysts, etc.
-
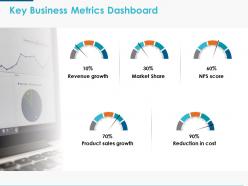 Key business metrics dashboard ppt powerpoint presentation icon clipart
Presenting this set of slides with name Key Business Metrics Dashboard Ppt Powerpoint Presentation Icon Clipart. This is a five process. The stages in this process are Finance, Analysis, Business, Investment, Marketing. This is a completely editable PowerPoint presentation and is available for immediate download. Download now and impress your audience.
-
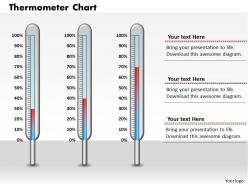 0414 three thermometers column chart powerpoint graph
We are proud to present our 0414 three thermometers column chart powerpoint graph. Our Three Thermometers Column Chart Powerpoint Graph Powerpoint Templates provide you the cutting edge. Slice through the doubts in the minds of your listeners. You aspire to touch the sky with glory. Let our Three Thermometers Column Chart Powerpoint Graph Powerpoint Templates provide the fuel for your ascent.
-
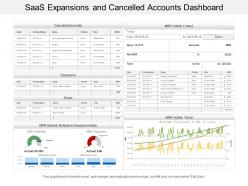 Saas expansions and cancelled accounts dashboard
Presenting Saas expansions and cancellation accounts dashboard PPT template. Download is quick and can be easily shared. Conveys a sense of change over time. Suitable for corporate leaders and business associates. Flexible PPT slide as can be used whenever required. PowerPoint design can be shared in Standard and Widescreen view. High quality graphics and visuals used in the PPT. Option to include business content i.e. name, logo and text. Effortless conversion into PDF/ JPG format. Can be easily merged with your ongoing presentation slides.
-
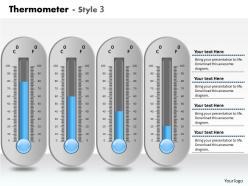 0414 thermometer column chart for business growth powerpoint graph
We are proud to present our 0414 thermometer column chart for business growth powerpoint graph. Our Thermometer Column Chart For Business Growth Powerpoint Graph Powerpoint Templates are creatively constructed and eye catching. Focus attention on the key issues of your presentation. Use our Thermometer Column Chart For Business Growth Powerpoint Graph Powerpoint Templates and nail the day. Lead your team show them the way.
-
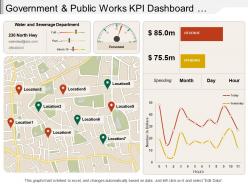 Government and public works kpi dashboard showing water sewerage department
Presenting the KPI dashboard PPT template. This KPI presentation layout is 100% modifiable and is designed professionally. You can edit the objects in this slide like font color and font size without going through any fuss. This presentation template is 100% compatible with Google Slide and can be saved in JPG or PDF file format hassle-free. To download this, click on the button below.
-
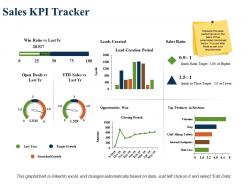 Sales kpi tracker lead creation period sales ratio
Presenting this set of slides with name - Sales Kpi Tracker Lead Creation Period Sales Ratio. This is a three stage process. The stages in this process are Leads Created, Sales Ratio, Top Products In Revenue, Opportunities Won, Stretched Growth.
-
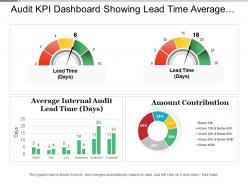 Audit kpi dashboard showing lead time average entry variance and amount contribution
Presenting this set of slides with name - Audit Kpi Dashboard Showing Lead Time Average Entry Variance And Amount Contribution. This is a four stage process. The stages in this process are Audit, Examine, Survey.
-
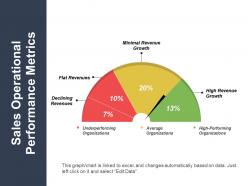 Sales operational performance metrics sample ppt files
Presenting sales operational performance metrics sample PPT files PPT slide. This sales performance template has designed by professionals while sharing the sales strategies and you can also easily edit this template in PowerPoint. You are enabled to edit the font type, size & color, diagram color, and background color as well according to the requirement. You can insert the organization name, trademark, and tagline in this template. You can even use icons of own choice by simply replacing the previous icon as thousands of editable icons available on this webpage.
-
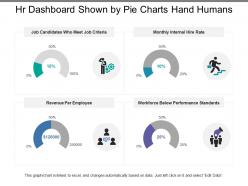 Hr dashboard shown by pie charts hand humans
Presenting this set of slides with name - Hr Dashboard Shown By Pie Charts Hand Humans. This is a four stage process. The stages in this process are Hr Dashboard, Human Resource Dashboard, Hr Kpi.
-
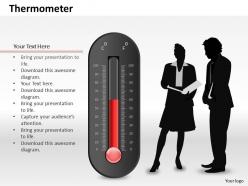 0514 data driven thermometer diagram powerpoint slides
We are proud to present our 0514 data driven thermometer diagram powerpoint slides. Unique design data driven thermometer is used in this Business Power Point template. To display various reading in any science related presentation use this graphic masterpiece and get noticed.
-
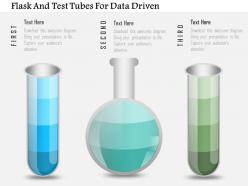 1214 flask and test tubes for data driven powerpoint slide
We are proud to present our 1214 flask and test tubes for data driven powerpoint slide. Graphic of flask and test tubes are used to craft this power point template slide. This PPT slide can be used for data driven measurement and analysis. Use this PPT slide for your science and math related presentation.
-
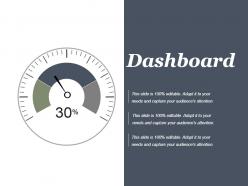 Dashboard powerpoint slide background
Presenting dashboard powerpoint slide background. This is a dashboard powerpoint slide background. This is a one stage process. The stages in this process are dashboard, meter, measure, speed, percentage.
-
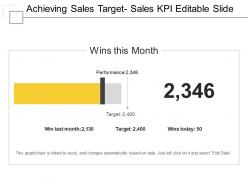 Achieving sales target sales kpi editable slide ppt example
The best advantage of downloading this sales target KPI PPT is that it is fully editable. You can change the font type, color, size, shape, style, background according to your business preferences. You can download and convert design template into JPEG and PDF formats. Design is fully compatible with Google Slides and Microsoft Office versions 2010 and 13. Use of high quality icons makes the design look more attractive.
-
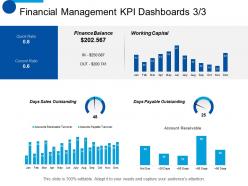 Financial management kpi dashboards business ppt summary smartart
Presenting this set of slides with name - Financial Management KPI Dashboards Business Ppt Summary Smartart. This is a six stage process. The stages in this process are Finance, Analysis, Business, Investment, Marketing.
-
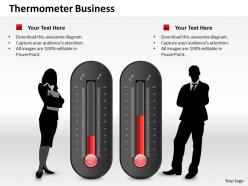 0514 two business use thermometer graphic powerpoint slides
We are proud to present our 0514 two business use thermometer graphic powerpoint slides. Graphic of two business use thermometer is used in this Business Power Point template. To display various reading in any science related presentation use this graphic masterpiece and get noticed.
-
 Dashboard snapshot ppt summary samples
Presenting this set of slides with name - Dashboard Snapshot Ppt Summary Samples. This is a three stage process. The stages in this process are Low, Medium, High, Dashboard, Business, Percentage.
-
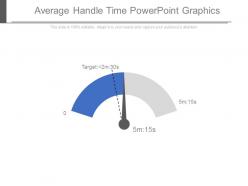 Average handle time powerpoint graphics
Presenting average handle time powerpoint graphics. This is a average handle time powerpoint graphics. This is a two stage process. The stages in this process are target, measuring, dashboard, management.
-
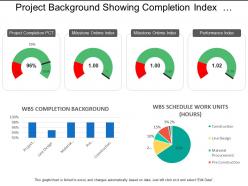 Project background showing completion index and pie chart
Presenting this set of slides with name - Project Background Showing Completion Index And Pie Chart. This is a four stage process. The stages in this process are Project Background, Project Management, Project Description.
-
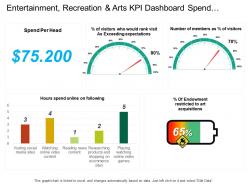 Entertainment recreation and arts kpi dashboard spend per head and hour spend online on social media
Presenting this set of slides with name - Entertainment Recreation And Arts Kpi Dashboard Spend Per Head And Hour Spend Online On Social Media. This is a four stage process. The stages in this process are Entertainment, Recreation And Arts, Attractions, Culture, Entertainment.
-
 0414 progress thermometer column chart powerpoint graph
We are proud to present our 0414 progress thermometer column chart powerpoint graph. Our Progress Thermometer Column Chart Powerpoint Graph Power Point Templates Will Provide Weight To Your Words. They Will Bring Out The Depth Of Your Thought Process. Words Like Arrows Fly Straight And True. Use Our Progress Thermometer Column Chart Powerpoint Graph Power Point Templates To Make Them Hit Bulls eye Every time.
-
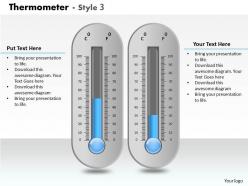 0414 thermometer column chart layout powerpoint graph
We are proud to present our 0414 thermometer column chart layout powerpoint graph. Our Thermometer Column Chart Layout Powerpoint Graph Powerpoint Templates give good value for money. They also have respect for the value of your time. Take a leap off the starting blocks with our Thermometer Column Chart Layout Powerpoint Graph Powerpoint Templates. They will put you ahead of the competition in quick time.
-
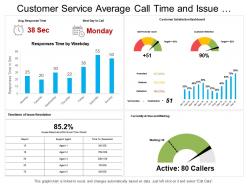 Customer service average call time and issue resolution timeline dashboard
Introducing customer service average call time and issue resolution timeline dashboard PPT slide. This format slide is totally adaptable with Google Slide. You can adjust the tints, content style, text dimension of the slide information according to require. The slide rushes to download and can be spared in PDF, and JPEG designs. For direction, extra instructive slides are given. Best quality designs are used. The nature of the slide illustrations does not obscure when shown on an expansive screen. You can customize the slide by including your association name, and mark.
-
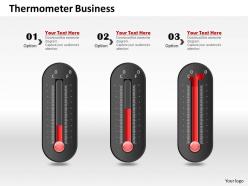 0514 three business use thermometer graphic powerpoint slides
We are proud to present our 0514 three business use thermometer graphic powerpoint slides. Graphic of three business thermometer is used in this Business Power Point template. To display various reading in any science related presentation use this graphic masterpiece and get noticed.
-
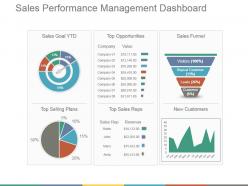 Sales performance management dashboard snapshot ppt background images
Presenting sales performance management dashboard ppt background images. This is a sales performance management dashboard snapshot ppt background images. This is a four stage process. The stages in this process are sales goal ytd, top opportunities, sales funnel, top selling plans, top sales reps, new customers.
-
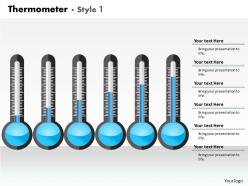 0414 thermometer column chart business layout powerpoint graph
We are proud to present our 0414 thermometer column chart business layout powerpoint graph. Our Thermometer Column Chart Business Layout Powerpoint Graph Powerpoint Templates provide the links in your chain of thought. Once intertwined they enhance the strength of your words. Our Thermometer Column Chart Business Layout Powerpoint Graph Powerpoint Templates are like ingredients in your recipe of sucess. Stir them together and get people licking their lips.
-
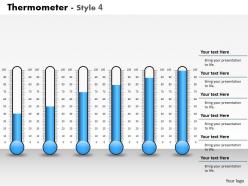 0414 display of thermometer column chart powerpoint graph
We are proud to present our 0414 display of thermometer column chart powerpoint graph. You are an avid believer in ethical practices. Highlight the benefits that accrue with our 0414 Display of Thermometer Column Chart Powerpoint Graph Powerpoint Templates. Set your controls for the heart of the sun. Our 0414 Display of Thermometer Column Chart Powerpoint Graph Powerpoint Templates will be the propellant to get you there.
-
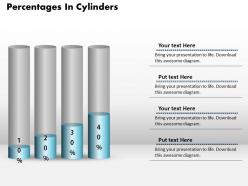 0414 percentage growth cylinders column chart powerpoint graph
We are proud to present our 0414 percentage growth cylinders column chart powerpoint graph. Bet on your luck with our Percentage Growth Cylinders Column Chart Powerpoint Graph Powerpoint Templates. Be assured that you will hit the jackpot. Let our Percentage Growth Cylinders Column Chart Powerpoint Graph Powerpoint Templates be the string of your bow. Fire of your ideas and conquer the podium.
-
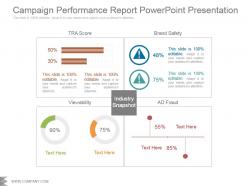 Campaign performance report powerpoint presentation
Presenting campaign performance report powerpoint presentation. This is a campaign performance report powerpoint presentation. This is a four stage process. The stages in this process are industry snapshot, viewability, ad fraud, brand safety, tra score.
-
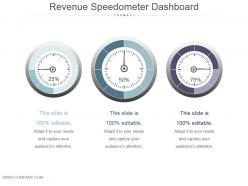 Revenue speedometer dashboard snapshot ppt diagrams
Presenting revenue speedometer dashboard Snapshot ppt diagrams. This is a revenue speedometer dashboard ppt diagrams. This is a three stage process. The stages in this process are business, marketing, success, dashboard, percentage.
-
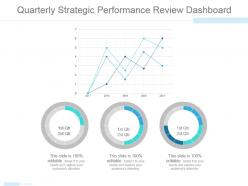 Quarterly strategic performance review dashboard ppt icon
Presenting quarterly strategic performance review dashboard ppt icon. This is a quarterly strategic performance review dashboard ppt icon. This is a three stage process. The stages in this process are finance, business, marketing, dashboard, process.
-
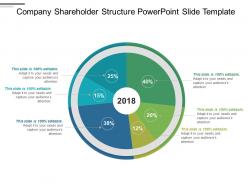 Company shareholder structure powerpoint slide template
Presenting company shareholder structure PowerPoint slide template. This layout is fully compatible with Google slides and data driven. User can edit the data in linked excel sheet and graphs and charts gets customized accordingly. Easy to put in company logo, trademark or name; accommodate words to support the key points. Images do no distort out even when they are projected on large screen. Adjust colors, text and fonts as per your business requirements. Fast downloading speed and formats can be easily changed to JPEG and PDF applications.
-
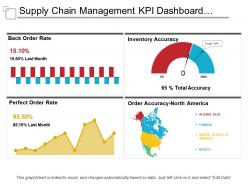 Supply chain management kpi dashboard showing back order rate and order accuracy
Presenting this set of slides with name - Supply Chain Management Kpi Dashboard Showing Back Order Rate And Order Accuracy. This is a four stage process. The stages in this process are Demand Forecasting, Predicting Future Demand, Supply Chain Management.
-
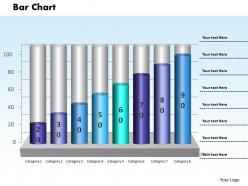 0414 inreasing profit ratio column chart powerpoint graph
We are proud to present our 0414 inreasing profit ratio column chart powerpoint graph. Let our Inreasing Profit Ratio Column Chart Powerpoint Graph Powerpoint Templates be the vehicle of your sucessful journey. Ride the bus to glory with your grand ideas. Our Inreasing Profit Ratio Column Chart Powerpoint Graph Powerpoint Templates are like a basic christmas tree. Decorate it with your beautiful thoughts and spread joy and happiness.
-
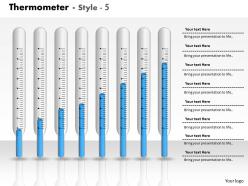 0414 thermometer business graph column chart powerpoint graph
We are proud to present our 0414 thermometer business graph column chart powerpoint graph. Let our Thermometer Business Graph Column Chart Powerpoint Graph Powerpoint Templates be the vehicle of your sucessful journey. Ride the bus to glory with your grand ideas. Our Thermometer Business Graph Column Chart Powerpoint Graph Powerpoint Templates are like a basic christmas tree. Decorate it with your beautiful thoughts and spread joy and happiness.
-
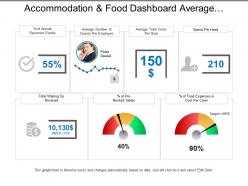 Accommodation and food dashboard average number of guests per employee
Presenting this set of slides with name - Accommodation And Food Dashboard Average Number Of Guests Per Employee. This is a six stage process. The stages in this process are Accommodation And Food, Shelter And Food, Accommodation And Beverages.
-
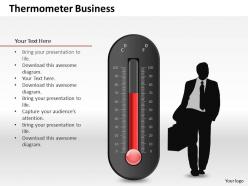 0514 use good quality scientific thermometer powerpoint slides
We are proud to present our 0514 use good quality scientific thermometer powerpoint slides. Graphic of scientific thermometer is used in this Business Power Point template. To display various reading in any science related presentation use this graphic masterpiece and get noticed.
-
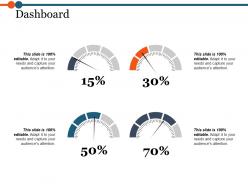 Dashboard snapshot ppt examples slides
Presenting this set of slides with name - Dashboard Ppt Examples Slides. This is a three stage process. The stages in this process are Dashboard, Strategy, Finance, Planning, Measure.
-
 High medium low shown by circles and metric icon
Presenting this set of slides with name - High Medium Low Shown By Circles And Metric Icon. This is a three stage process. The stages in this process are High Medium Low, High Moderate Low, Top Medium Low.
-
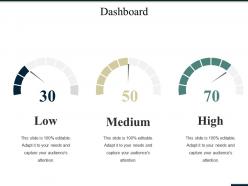 Dashboard snapshot ppt summary portrait
Presenting this set of slides with name - Dashboard Snapshot Ppt Summary Portrait. This is a three stage process. The stages in this process are Low, Medium, High, Dashboard, Business.
-
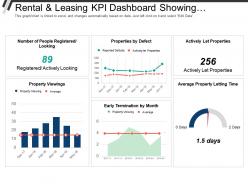 Rental and leasing kpi dashboard showing properties by defect and actively let properties
Presenting this set of slides with name - Rental And Leasing Kpi Dashboard Showing Properties By Defect And Actively Let Properties. This is a six stage process. The stages in this process are Rental And Leasing, Dealing And Leasing, Rental And Engage.
-
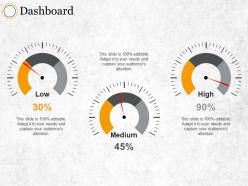 Dashboard Snapshot ppt summary example introduction
Presenting this set of slides with name - Dashboard Snapshot Ppt Summary Example Introduction. This is a three stage process. The stages in this process are Dashboard, Strategy, Business, Marketing, Management.
-
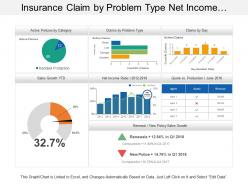 Insurance claim by problem type net income ratio dashboard
Presenting this set of slides with name - Insurance Claim By Problem Type Net Income Ratio Dashboard. This is a five stage process. The stages in this process are Assurance, Surety, Insurance.
-
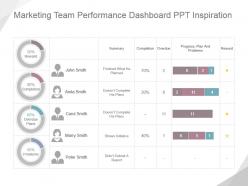 Marketing team performance dashboard ppt inspiration
Presenting marketing team performance dashboard ppt inspiration. This is a marketing team performance dashboard ppt inspiration. This is a four stage process. The stages in this process are peter smith, marry smith, carol smith, anita smith, peter smith, reward, completion, overdue plans, problems, summary, finished what he planned, doesnt complete his plans, shows initiative, didnt submit a report, overdue, progress, plan and problems, reward.
-
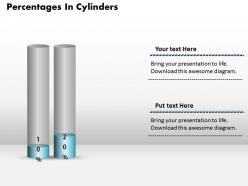 0414 percentage cylinders column chart 2 stages powerpoint graph
We are proud to present our 0414 percentage cylinders column chart 2 stages powerpoint graph. Put your wonderful verbal artistry on display. Our Percentage Cylinders Column Chart 2 Stages Powerpoint Graph Powerpoint Templates will provide you the necessary glam and glitter. You have the co-ordinates for your destination of sucess. Let our Percentage Cylinders Column Chart 2 Stages Powerpoint Graph Powerpoint Templates map out your journey.
-
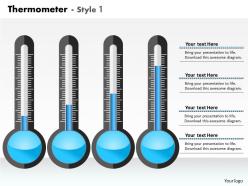 0414 thermometer layout column chart powerpoint graph
Beneficial for sales, marketing and productivity business by entrepreneurs. All images are 100% editable in the presentation slide. Presentation icon supports changing the color, size and orientation of any icon to your liking. Internet based click facilities like image search, oxford dictionary and others can be added with. ease and gives professional look to the PPT slide. Supports sharing and co-authoring of slide.
-
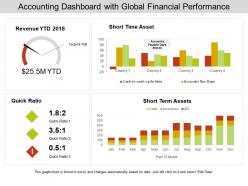 Accounting dashboard with global financial performance
Pre-designed accounting dashboard with global financial performance PPT template. High-resolution PowerPoint presentation backgrounds for better clarity of the information displayed. Offers wide variety of options and colors to alter the appearance. Allows adding of enterprise personal details such as brand name, logo and much more. Enough space available to enter text and its related points in the PPT table. This slide is available in both Standard and Widescreen slide size. Compatible with multiple formats like JPEG, PDF and Google slides.
-
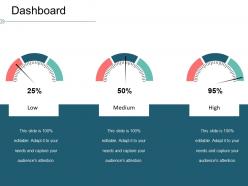 Dashboard snapshot ppt icon
Presenting this set of slides with name - Dashboard Snapshot Ppt Icon. This is a three stage process. The stages in this process are Low, Medium, High, Dashboard, Business, Percentage.
-
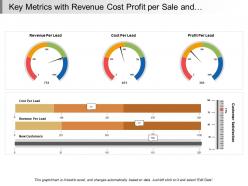 Key metrics with revenue cost profit per sale and customer satisfaction
Presenting this set of slides with name - Key Metrics With Revenue Cost Profit Per Sale And Customer Satisfaction. This is a three stage process. The stages in this process are Key Metrics, Key Performance Indicator, Kpi.
-
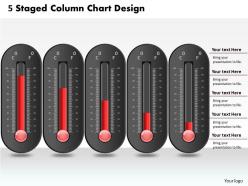 0414 5 staged column chart design powerpoint graph
We are proud to present our 0414 5 staged column chart design powerpoint graph. Hit the ground running with our 5 Staged Column Chart Design PowerPoint Graph Powerpoint Templates. Go the full distance with ease and elan. Leave a lasting impression with our 5 Staged Column Chart Design PowerPoint Graph Powerpoint Templates. They possess an inherent longstanding recall factor.
-
 0414 design of thermometer column chart powerpoint graph
We are proud to present our 0414 design of thermometer column chart powerpoint graph. Our 0414 Design Of Thermometer Column Chart Powerpoint Graph Powerpoint Templates provide you the cutting edge. Slice through the doubts in the minds of your listeners. You aspire to touch the sky with glory. Let our 0414 Design Of Thermometer Column Chart Powerpoint Graph Powerpoint Templates provide the fuel for your ascent.
-
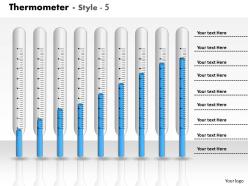 0414 thermometer business design column chart powerpoint graph
We are proud to present our 0414 thermometer business design column chart powerpoint graph. Whatever the nuance you want to project. We have a Thermometer Business Design Column Chart Powerpoint Graph Powerpoint Templates that will get it across. Create a connection with your audience using our Thermometer Business Design Column Chart Powerpoint Graph Powerpoint Templates. Transfer your depth of knowledge clearly across to them.
-
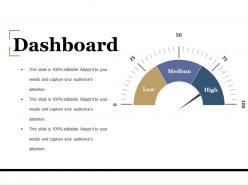 Dashboard powerpoint slide rules
Presenting dashboard powerpoint slide rules. This is a dashboard powerpoint slide rules. This is a three stage process. The stages in this process are business, marketing, strategy, planning, dashboard.
-
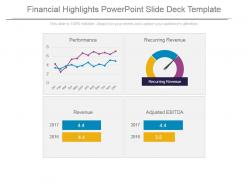 Financial highlights powerpoint slide deck template
Presenting financial highlights powerpoint slide deck template. This is a financial highlights powerpoint slide deck template. This is a four stage process. The stages in this process are performance, recurring revenue, revenue, adjusted ebitda.
-
 Dashboard presentation examples
Presenting Dashboard Presentation Examples which is completely editable. You can easily download this template into various formats like PDF, PNG, and JPEG. This slide is compatible with Google Slides. You can make as many changes as you want on the slide without any complications. Access this slide in both 4:9 and 16:9 ratio.
-
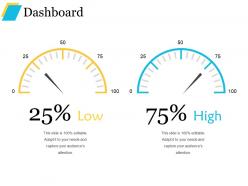 Dashboard powerpoint presentation templates
Presenting dashboard powerpoint presentation templates. This is a dashboard powerpoint presentation templates. This is a two stage process. The stages in this process are low, high, dashboard, technology, business.


