Data Driven Sliding Bars and and other powerpoint diagrams and templates
- Sub Categories
-
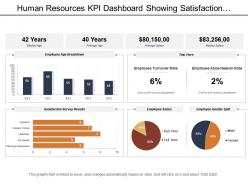 Human resources kpi dashboard showing satisfaction survey result age breakdown
Presenting human resources KPI dashboard showing satisfaction survey result age breakdown data driven PowerPoint slide. Fit to be used with the Google slides. Replace the visuals, text and the content in the slide design. Change the size, style and orientation of the slides. Use your company’s name or brand name to make it your own presentation template. Beneficial for managers, professors, marketers, etc. Flexible option for conversion in PDF or JPG formats. Available in Widescreen format also. Useful for making business plan and strategies.
-
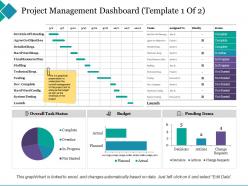 Project management dashboard agree on objectives
Presenting this set of slides with name - Project Management Dashboard Agree On Objectives. This is a three stage process. The stages in this process are Final Resource Plan, Agree On Objectives, System Testing.
-
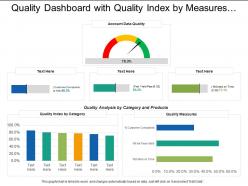 Quality dashboard with quality index by measures and quality index
Presenting this set of slides with name - Quality Dashboard With Quality Index By Measures And Quality Index. This is a three stage process. The stages in this process are Quality Dashboard, Quality Kpi, Quality Metircs.
-
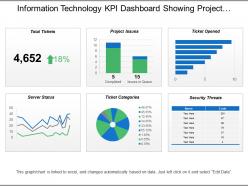 Information technology kpi dashboard showing project issues server status
Presenting this set of slides with name - Information Technology Kpi Dashboard Showing Project Issues Server Status. This is a six stage process. The stages in this process are Information Technology, It, Iot.
-
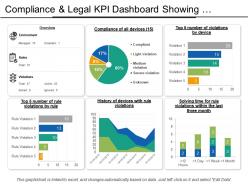 Compliance and legal kpi dashboard showing violations by devices
Presenting this set of slides with name - Compliance And Legal Kpi Dashboard Showing Violations By Devices. This is a six stage process. The stages in this process are Compliance And Legal, Legal Governance, Risk Management.
-
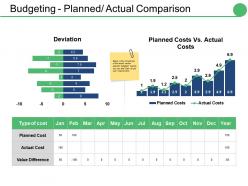 Budgeting planned actual comparison ppt portfolio ideas
Presenting this set of slides with name - Budgeting Planned Actual Comparison Ppt Portfolio Ideas. The topics discussed in this diagram are Deviation, Planned Cost, Actual Cost, Value Difference, Type Of Cost. This is a completely editable PowerPoint presentation and is available for immediate download.
-
 Project Management Dashboard Budget By Employee
Presenting this set of slides with name - Project Management Dashboard Budget By Employee. This is a one stage process. The stages in this process are Percentage, Product, Marketing, Management, Business.
-
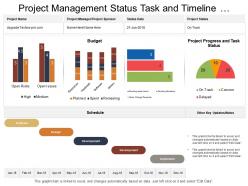 Project management status task and timeline dashboard
PPT design comes with access to include or exclude content as per the business need. Presentation template is available in both standard as well as in widescreen slide. PowerPoint slide provides a professional perspective to presentation. Harmonious with various formats like JPEG and PDF as well as with Google slides. Entirely editable and personalization of PPT graphic is enabled for your use. Matching PowerPoint slides are available with different nodes and stages.
-
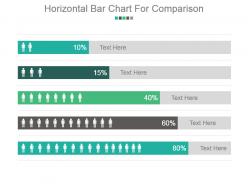 Horizontal bar chart for comparison powerpoint slide ideas
Presenting horizontal bar chart for comparison PPT slide. This presentation graph chart is fully editable in PowerPoint. You can customize the font type, font size, colors of the chart and background color as per your requirement. The slide is fully compatible with Google slides and can be saved in JPG or PDF format without any hassle. High quality graphics and icons ensure that there is no deteriorating in quality on enlarging their size. Have the tendency to boost the overall impression of your presentation.
-
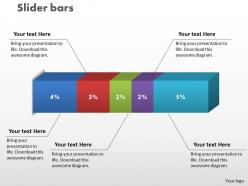 0414 slider bar chart data driven graphics powerpoint graph
We are proud to present our 0414 slider bar chart data driven graphics powerpoint graph. Our Slider Bar Chart Data Driven Graphics Powerpoint Graph Powerpoint Templates will generate and maintain the level of interest you desire. They will create the impression you want to imprint on your audience. Our Slider Bar Chart Data Driven Graphics Powerpoint Graph Powerpoint Templates are effectively colour coded to priorities your plans. They automatically highlight the sequence of events you desire.
-
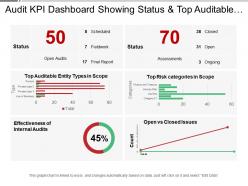 Audit kpi dashboard showing status and top auditable entity types
Presenting this set of slides with name - Audit Kpi Dashboard Showing Status And Top Auditable Entity Types. This is a six stage process. The stages in this process are Audit, Examine, Survey.
-
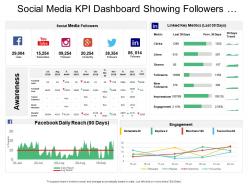 Social media kpi dashboard showing followers facebook daily reach
SlideTeam presents the Social media KPI dashboard showing followers Facebook daily reach This slideshow is modifiable according to your needs as you can make all the required changes to it whenever you feel like. You can edit the font size and font style. These slides are fully compatible with Google Slides. You can view the presentation on both 16:9 widescreen side as well as the 4:3 standard screen size. You can save them in either JPG or PDF format.
-
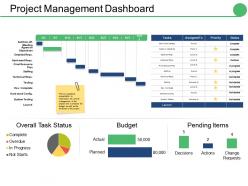 Project management dashboard snapshot ppt show graphics
Presenting this set of slides with name - Project Management Dashboard Snapshot Ppt Show Graphics. This is a four stage process. The stages in this process are Actual, Planned, Budget, Pending Items, Overdue.
-
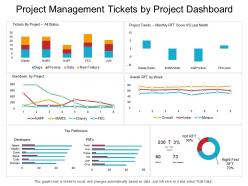 Project management tickets by project dashboard
Presenting this set of slides with name - Project Management Tickets By Project Dashboard. This is a six stage process. The stages in this process are Project Proposal, Project Plan, Project Management.
-
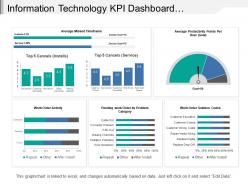 Information technology kpi dashboard showing work order activity
Presenting this set of slides with name - Information Technology Kpi Dashboard Showing Work Order Activity. This is a six stage process. The stages in this process are Information Technology, It, Iot.
-
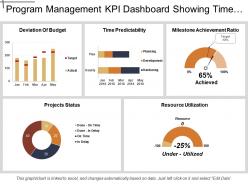 Program management kpi dashboard showing time predictability and resource utilization
Presenting Program Management KPI Dashboard Showing Time Predictability And Resource Utilization PPT slide. The graphical Program Management dashboard PowerPoint template designed by the professional team of SlideTeam to present the different parameters that are essential for any project. The different charts such as line and pie chart, along with that the text in the KPI dashboard slide are editable in PowerPoint. Moreover, this slide is compatible with Google Slide. An individual can edit the font size, font type, color and dimensions of the different figures according to the requirement.
-
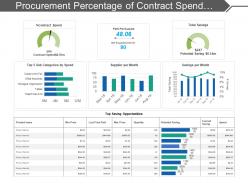 Procurement percentage of contract spend dashboard
Presenting this set of slides with name - Procurement Percentage Of Contract Spend Dashboard. This is a seven stage process. The stages in this process are Purchase, Procurement, Buy.
-
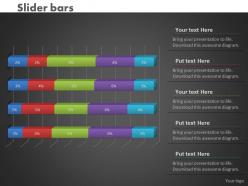 0414 slider bar chart for visual analysis powerpoint graph
We are proud to present our 0414 slider bar chart for visual analysis powerpoint graph. Our great team has conjured up a web of Slider Bar Chart For Visual Analysis Powerpoint Graph Powerpoint Templates. Use them to string together your glistening ideas. Think of it and be sure we have it. Our Slider Bar Chart For Visual Analysis Powerpoint Graph Powerpoint Templates offer you the widest possible range of options.
-
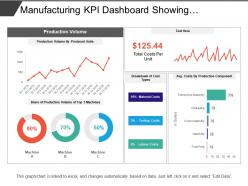 Manufacturing kpi dashboard showing production volume and cost breakdown
Presenting this set of slides with name - Manufacturing Kpi Dashboard Showing Production Volume And Cost Breakdown. This is a four stage process. The stages in this process are Manufacturing, Production, Manufacture.
-
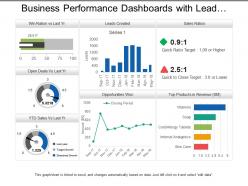 Business performance dashboards with lead creation and sales ratios
Presenting, business performance dashboards with lead creation and sales ratios for cost efficiency and performance indication PPT presentation. Bright and informative PowerPoint presentation slides. Gives regulations to achieve business success and targets. Produces error-free execution. Acts as a model for planning future assignments for marketing capabilities. Fully editable by any user at any point in time. Performs a clarity of marketing and presentation objectives without creating any confusions and misconceptions. Simple to be projected to widescreen without degradation in quality.
-
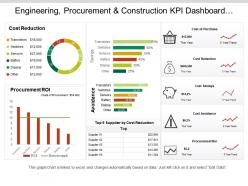 Engineering procurement and construction kpi dashboard showing cost of purchase order and cost reduction
You can use this PPT slideshow very easily as it is fully customizable. You can effortlessly insert or remove any diagrammatic representation from the given template. The font size, font color and font style can be easily edited. This graph PPT is linked to excel and changes automatically based on the data you enter. You can save the deck in either PDF or JPG format. To make any changes in the PPT slideshow, simply follow the instructions given in the sample slides. The size, color and orientation of all shapes are 100% customizable, so don’t waste any further time and download this presentation.
-
 Budget forecast showing income of the various months and savings
Presenting this set of slides with name - Budget Forecast Showing Income Of The Various Months And Savings. This is a three stage process. The stages in this process are Budget Forecast, Forecast Vs Actual Budget, Plan Vs Forecast.
-
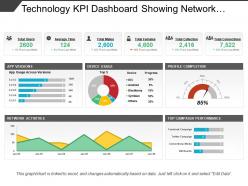 Technology kpi dashboard showing network activities and device usage
Introducing Technology KPI dashboard showing network activities PPT design. Quick download and simple to convert into JPEG and PDF document. High quality presentation slide comes with editing options as color, text and font can be edited at any stage. Preference to display PowerPoint template in standard and widescreen display view. Presentation graphic is accessible with different nodes and stages. Easy to present with large audience. Amend the design with corporate name and icon.
-
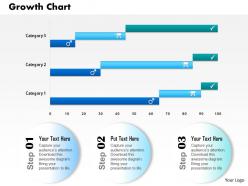 0514 3d financial growth updation chart powerpoint slides
Picture quality does not deter when opened on a big screen display. Trouble-free incorporation of customized content or graphics. Provided guidance to modify the graphical content. Save the presentation visual in JPG or PDF format. Compatible with the online as well as offline PowerPoint softwares. Effectively useful for the Marketing professionals, finance and account professionals.
-
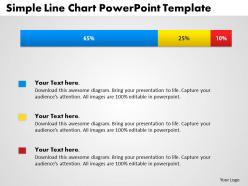 0414 simple bar chart with percentage powerpoint graph
Absolutely editable color scheme and values of PPT graphs. Add your company name, logo, brand-name etc. to personalize. Modify the size and orientation of presentation visuals to suit your requirement. Quick and simple download at your convenience. Original resolution of PPT visuals unaffected after editing. Presentation slide accessible in Standard 4:3 and Widescreen 16:9 view.
-
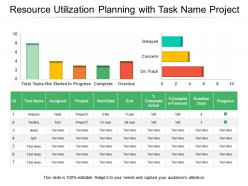 Resource utilization planning with task name project
Presenting this set of slides with name - Resource Utilization Planning With Task Name Project. This is a three stage process. The stages in this process are Resource Management, Resource Utilization, Resource Allocation.
-
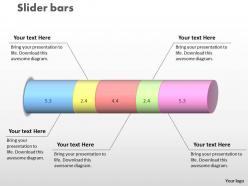 0414 interactive data driven bar chart powerpoint graph
We are proud to present our 0414 interactive data driven bar chart powerpoint graph. Our Interactive Data Driven Bar Chart Powerpoint Graph Powerpoint Templates provide the links in your chain of thought. Once intertwined they enhance the strength of your words. Our Interactive Data Driven Bar Chart Powerpoint Graph Powerpoint Templates are like ingredients in your recipe of sucess. Stir them together and get people licking their lips.
-
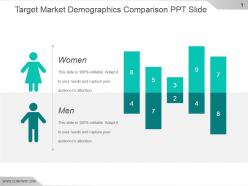 Target market demographics comparison ppt slide
Presenting target market demographics comparison ppt slide. This is a target market demographics comparison ppt slide. This is a two stage process. The stages in this process are women, men.
-
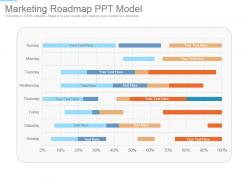 Marketing roadmap ppt model
Presenting, marketing roadmap PPT model PowerPoint Presentation. This is an appealing plan for data presentation and analysis related PowerPoint presentation. This PPT layout can be practiced by professionals from diverse background to present their ideas in a smart way. This slide is compatible with Google slides and can be saved in JPG/PDF formats, after downloading you can use it in full version and incorporate your company's logo for your best experience.
-
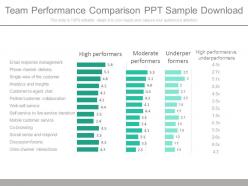 Team performance comparison ppt sample download
Presenting team performance comparison PPT slide. Access to download and save in the JPG or PDF format. Convenient to be used on a wide screen view. No effect on the picture quality whatever be the size of your screen. Useful for industry professionals, managers, executives, researchers, sales people, etc. Edit the size, style and orientation of the visuals and shapes. Follow given instructions to modify the slide template. The slide offers easy and effortless modification. Compatible with Google slides also.
-
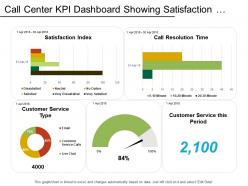 Call center kpi dashboard showing satisfaction index customer retention
Presenting this set of slides with name - Call Center Kpi Dashboard Showing Satisfaction Index Customer Retention. This is a five stage process. The stages in this process are Call Center Agent, Customer Care, Client Support.
-
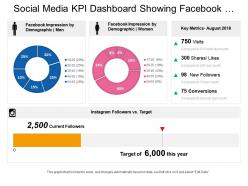 Social media kpi dashboard showing facebook impression by demographic instagram key metrics
Presenting this set of slides with name - Social Media Kpi Dashboard Showing Facebook Impression By Demographic Instagram Key Metrics. This is a four stage process. The stages in this process are Social Media, Digital Marketing, Social Marketing.
-
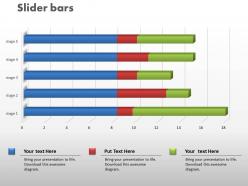 0414 slider time series bar chart powerpoint graph
We are proud to present our 0414 slider time series bar chart powerpoint graph. Our Slider Time Series Bar Chart Powerpoint Graph Powerpoint Templates give you the basic framework of your talk. Give it the shape you desire with your wonderful views. Our Slider Time Series Bar Chart Powerpoint Graph Powerpoint Templates are the lungs of your talk. Fill them with the oxygen of your indepth thought process.
-
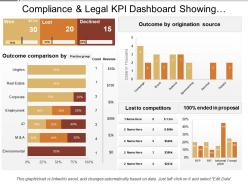 Compliance and legal kpi dashboard showing outcome comparison
Presenting this set of slides with name - Compliance And Legal Kpi Dashboard Showing Outcome Comparison. This is a three stage process. The stages in this process are Compliance And Legal, Legal Governance, Risk Management.
-
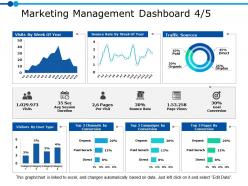 Marketing management dashboard 4 5 ppt powerpoint presentation gallery example
Presenting this set of slides with name - Marketing Management Dashboard 4 5 Ppt Powerpoint Presentation Gallery Example. This is a three stage process. The stages in this process are Business, Management, Strategy, Analysis, Marketing.
-
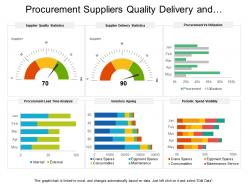 Procurement suppliers quality delivery and utilization dashboard
Presenting this set of slides with name - Procurement Suppliers Quality Delivery And Utilization Dashboard. This is a six stage process. The stages in this process are Purchase, Procurement, Buy.
-
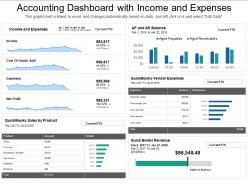 Accounting dashboard with income and expenses
Presenting accounting dashboard with income and expenses PPT slideshow. Loaded with incomparable benefits. Readymade PPT graphic helps in saving time and effort. Can be personalized by adding company trademark, logo, brand and symbols. Can be utilized for displaying both simple and complex information. Include or exclude slide content as per your individual need. Colors and text can be easily changed as the PPT slide is completely editable. Useful for every business leader and professional, project management team, business analysts, etc.
-
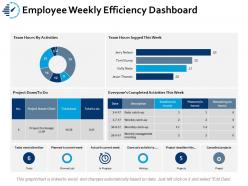 Employee weekly efficiency dashboard snapshot ppt portfolio brochure
Presenting this set of slides with name - Employee Weekly Efficiency Dashboard Snapshot Ppt Portfolio Brochure. This is a two stage process. The stages in this process are Business, Management, Strategy, Sales, Marketing.
-
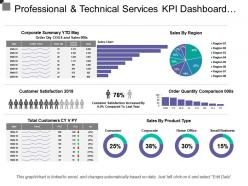 Professional and technical services kpi dashboard showing sales by region
Presenting this set of slides with name - Professional And Technical Services Kpi Dashboard Showing Sales By Region. This is a three stage process. The stages in this process are Professional And Technical Services, Services Management, Technical Management.
-
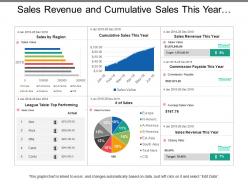 Sales revenue and cumulative sales this year dashboards
Presenting this set of slides with name - Sales Revenue And Cumulative Sales This Year Dashboards. Completely amendable presentation design as some elements are editable. Ease to personalize the slide with your company name, logo and even tag line. PowerPoint slide can be downloaded easily and transform into JPG and PDF format. More designs can be accessed with different nodes and stages. PPT diagram can be projected in standard and widescreen view. Great use of colors and innovatively designed. PPT template is compatible with Google slides.
-
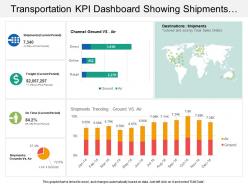 Transportation kpi dashboard snapshot showing shipments ground vs air channel
Presenting our transportation KPI dashboard snapshot showing shipments ground vs. air channel PPT slide. This layout is compatible with Google slides and data can be updated with excel linked file. This template is Excel linked just right click to input your information. Images do no blur out even when they are projected on large screen.PPT template can be utilized by sales and marketing teams and business managers. Instantly downloadable slide and supports formats like JPEG and PDF.
-
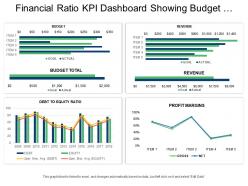 Financial ratio kpi dashboard snapshot showing budget revenue and profit margins
Presenting this set of slides with name - Financial Ratio Kpi Dashboard Snapshot Showing Budget Revenue And Profit Margins. This is a four stage process. The stages in this process are Accounting Ratio, Financial Statement, Financial Ratio.
-
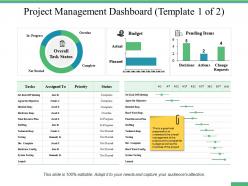 Project management dashboard snapshot ppt professional example introduction
Presenting this set of slides with name - Project Management Dashboard Snapshot Ppt Professional Example Introduction. This is a three stage process. The stages in this process are Percentage, Product, Management, Marketing, Business.
-
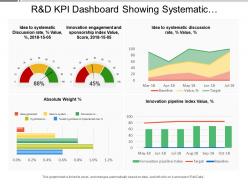 R and d kpi dashboard showing systematic discussion rate innovation engagement and sponsorship index
Presenting this set of slides with name - R And D Kpi Dashboard Showing Systematic Discussion Rate Innovation Engagement And Sponsorship Index. This is a four stage process. The stages in this process are R And D, Research And Development, Research And Technological Development.
-
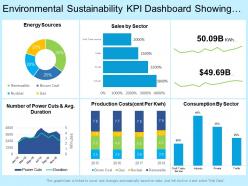 Environmental sustainability kpi dashboard showing total consumption sales energy sources
Presenting this set of slides with name - Environmental Sustainability Kpi Dashboard Showing Total Consumption Sales Energy Sources. This is a six stage process. The stages in this process are Environment Sustainability, Environment Continual, Environment Feasibility.
-
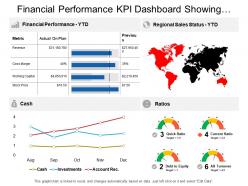 Financial performance kpi dashboard showing regional sales status cash and ratios
Presenting this set of slides with name - Financial Performance Kpi Dashboard Showing Regional Sales Status Cash And Ratios. This is a four stage process. The stages in this process are Financial Performance, Financial Report, Financial Review.
-
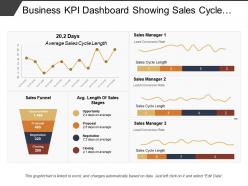 Business kpi dashboard showing sales cycle length and sales funnel
Presenting this set of slides with name - Business Kpi Dashboard Showing Sales Cycle Length And Sales Funnel. This is a three stage process. The stages in this process are Business Dashboard, Business Kpi, Business Performance.
-
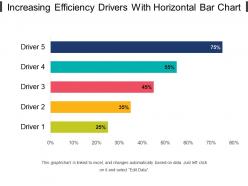 Increasing efficiency drivers with horizontal bar chart
Presenting increasing efficiency drivers with horizontal bar chart. This is a increasing efficiency drivers with horizontal bar chart. This is a five stage process. The stages in this process are increasing efficiency, increasing effectiveness, improving efficiency.
-
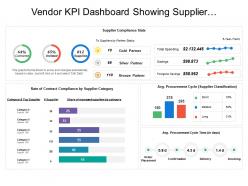 Vendor kpi dashboard showing supplier compliance stats and procurement cycle time
Presenting this set of slides with name - Vendor Kpi Dashboard Showing Supplier Compliance Stats And Procurement Cycle Time. This is a four stage process. The stages in this process are Vendor, Supplier, Retailer.
-
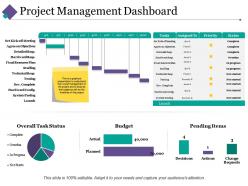 Project management dashboard snapshot ppt pictures infographic template
Displaying project management dashboard snapshot PPT picture infographic template. Alter the design with trade components like name and picture. Presentation slide is well-harmonized with Google slides. Colors and text can be replaced as the PowerPoint graphic comes with easy editing options. Rapid and easy download with saving options. PPT diagram can be viewed in both standard and widescreen display view. Flexible with other software options such as PDF or JPG formats.
-
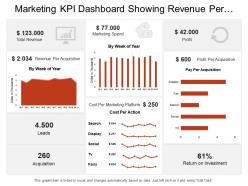 Marketing kpi dashboard showing revenue per acquisition leads speed profit
Presenting this set of slides with name - Marketing Kpi Dashboard Showing Revenue Per Acquisition Leads Speed Profit. This is a three stage process. The stages in this process are Marketing, Branding, Promoting.
-
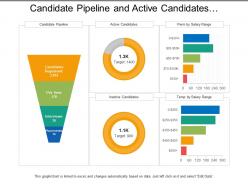 Candidate pipeline and active candidates recruitment dashboard
Presenting this set of slides with name - Candidate Pipeline And Active Candidates Recruitment Dashboard. This is a three stage process. The stages in this process are Staffing Plan, Recruitment, Staff Management.
-
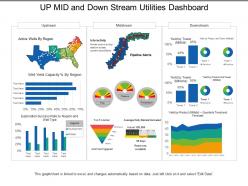 Up mid and down stream utilities dashboard
Presenting this set of slides with name - Up Mid And Down Stream Utilities Dashboard. This is a three stage process. The stages in this process are Utilities, Use, Advantage.
-
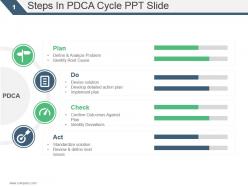 Steps in pdca cycle ppt slide
Presenting steps in pdca cycle ppt slide. This is a steps in pdca cycle ppt slide. This is a four stage process. The stages in this process are plan, do, check, act, pdca.
-
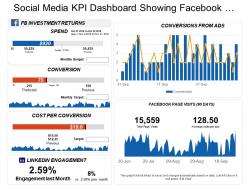 Social media kpi dashboard showing facebook investment returns conversion from ads
Presenting this set of slides with name - Social Media Kpi Dashboard Showing Facebook Investment Returns Conversion From Ads. This is a five stage process. The stages in this process are Social Media, Digital Marketing, Social Marketing.
-
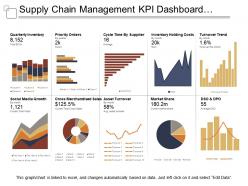 Supply chain management kpi dashboard showing quarterly inventory and asset turnover
Presenting this set of slides with name - Supply Chain Management Kpi Dashboard Showing Quarterly Inventory And Asset Turnover. This is a ten stage process. The stages in this process are Demand Forecasting, Predicting Future Demand, Supply Chain Management.
-
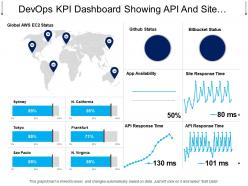 Devops kpi dashboard showing api and site response time
Presenting this set of slides with name - Devops Kpi Dashboard Showing Api And Site Response Time. This is a four stage process. The stages in this process are Development And Operations, Devops.
-
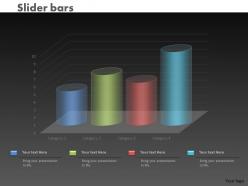 0414 slider column chart data illustration powerpoint graph
Amendable presentation design with amazing picture quality. Modification is possible with color, text, font and shape. Excel linked design so you can make changes in the excel sheet and the design will change accordingly. Prompt download and can be changed in JPEG and PDF format. Gives a specialized effect to your Presentation template. Alternate to customize the design by adding business badge, icon and symbol. PowerPoint slide exhibited in standard and widescreen view. Useful for marketing people, corporate managers, revenue department and human resource teams.
-
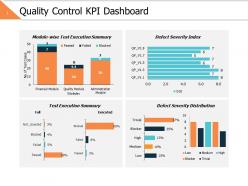 Quality control kpi dashboard ppt powerpoint presentation gallery diagrams
Presenting this set of slides with name - Quality Control Kpi Dashboard Ppt Powerpoint Presentation Gallery Diagrams. This is a four stage process. The stages in this process are Business, Management, Strategy, Analysis, Finance.
-
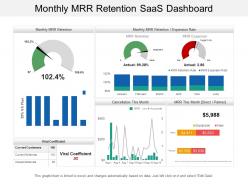 Monthly mrr retention saas dashboard
Offering monthly MRR retention Saas dashboard PPT template. Access to convert the presentation design into JPG and PDF. Offer 100% access to change the values, size and style of the slides once downloaded and saved in the desired format. High quality charts, images and visuals used in the designing process. Choice to get presentation slide in standard or in widescreen view. Easy to convert in JPEG and PDF document. Compatible with Google slides. Easy and hassle free downloading process.


