- Sub Categories
-
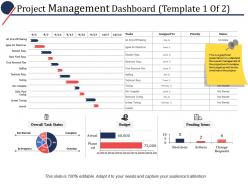 Project management dashboard ppt powerpoint presentation file example introduction
Presenting this set of slides with name - Project Management Dashboard Ppt Powerpoint Presentation File Example Introduction. This is a three stage process. The stages in this process are Business, Management, Marketing, Percentage, Product.
-
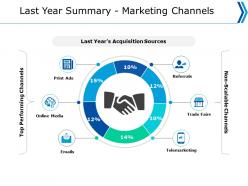 Last year summary marketing channels online media ppt powerpoint presentation portfolio graphics example
Presenting this set of slides with name - Last Year Summary Marketing Channels Online Media Ppt Powerpoint Presentation Portfolio Graphics Example. This is a six stage process. The stages in this process are Online Media, Telemarketing, Trade Fairs, Referrals, Print Ads.
-
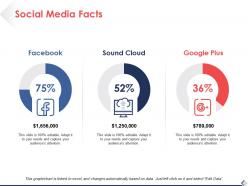 Social media facts finance ppt pictures background designs
Presenting this set of slides with name - Social Media Facts Finance Ppt Pictures Background Designs. This is a three stage process. The stages in this process are Finance, Analysis, Business, Investment, Marketing.
-
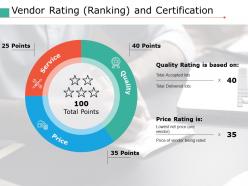 Vendor rating ranking and certification ppt portfolio files
Presenting this set of slides with name - Vendor Rating Ranking And Certification Ppt Portfolio Files. This is a three stage process. The stages in this process are Business, Management, Strategy, Analysis, Icons.
-
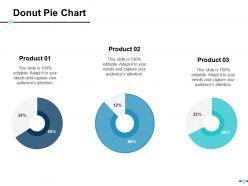 Donut pie chart ppt show templates
Presenting this set of slides with name - Donut Pie Chart Ppt Show Templates. This is a three stage process. The stages in this process are Business, Management, Strategy, Analysis, Marketing.
-
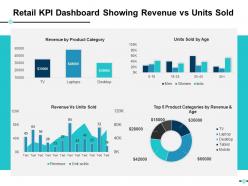 Retail kpi dashboard showing revenue vs units sold ppt slides example file
Presenting this set of slides with name - Retail Kpi Dashboard Showing Revenue Vs Units Sold Ppt Slides Example File. This is a four stage process. The stages in this process are Business, Management, Strategy, Analysis, Marketing.
-
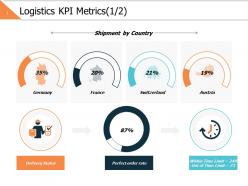 Logistics kpi metrics 1 2 ppt powerpoint presentation file example topics
Presenting this set of slides with name - Logistics Kpi Metrics 1 2 Ppt Powerpoint Presentation File Example Topics. This is a four stage process. The stages in this process are Business, Management, Strategy, Analysis, Finance.
-
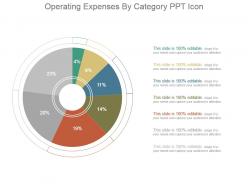 Operating expenses by category ppt icon
Presenting operating expenses by category ppt icon. This is a operating expenses by category ppt icon. This is a seven stage process. The stages in this process are business, management, marketing, finance, operating.
-
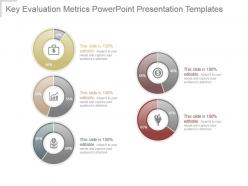 Key evaluation metrics powerpoint presentation templates
Presenting key evaluation metrics powerpoint presentation templates. This is a key evaluation metrics powerpoint presentation templates. This is a five stage process. The stages in this process are icons, planning, business, finance, marketing.
-
 Comparison ppt background images template 1
Presenting comparison ppt background images template 1. This is a comparison ppt background images template 1. This is a two stage process. The stages in this process are male, female, percentage, compare, business.
-
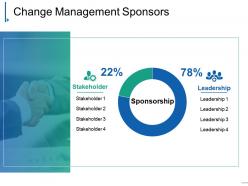 Change management sponsors powerpoint slide introduction
Presenting change management sponsors powerpoint slide introduction. This is a change management sponsors powerpoint slide introduction. This is a two stage process. The stages in this process are stakeholder, sponsorship, leadership, percentage, donut.
-
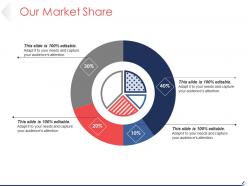 Our market share ppt background images
Presenting our market share ppt background images. This is a our market share ppt background images. This is a four stage process. The stages in this process are percentage, finance, business, marketing, donut.
-
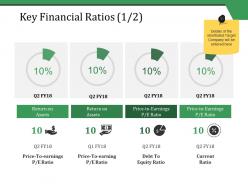 Key financial ratios ppt styles templates
Presenting this set of slides with name - Key Financial Ratios Ppt Styles Templates. This is a four stage process. The stages in this process are Finance, Current Ratio, Debt To Equity Ratio, Return On Assets, Business.
-
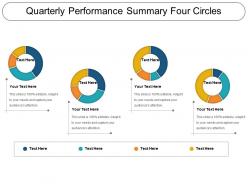 Quarterly performance summary four circles ppt sample
Presenting Quarterly Performance Summary Four Circles PPT Sample. The template is completely customizable. You are free to make any change in the slide as per your wants. This template allows you to resize it and make changes in the fonts, colors, images, icons as per your needs. The slide is compatible with Google Slides and other formats such as PDF, JPG, and PNG. The slide designs are available in both the sizes- standard(4:3) and widescreen(16:9). Project it in front of a large segment because of its splendid pixel quality.
-
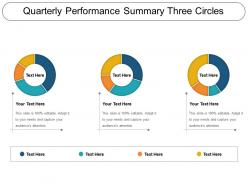 Quarterly performance summary three circles ppt samples
Presenting Quarterly Performance Summary Six Circles PPT Sample File. Customize the slide as per your needs. The template can be downloaded quickly. Our templates are 100% editable. The colors, texts, fonts, images can be altered according to the theme of the organization. You can easily save the PPT in any format like PDF, JPG and PNG. It is Google Slides friendly. It is available in both the slide design sizes- 4:3 and 16:9. Does not pixelate when viewed on widescreen.
-
 Red push button icon with play button in center
Presenting red push button icon with play button in center. This is a red push button icon with play button in center. This is a two stage process. The stages in this process are push button, switch button, press button.
-
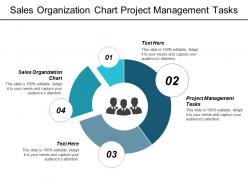 Sales organization chart project management tasks sales displays cpb
This is an editable four stages graphic that deals with topics like Sales Organization Chart, Project Management Tasks, Sales Displays to help convey your message better graphically. This product is a premium product available for immediate download, and is 100 percent editable in Powerpoint. Download this now and use it in your presentations to impress your audience.
-
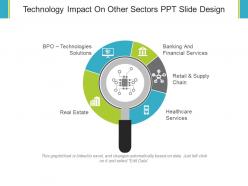 Technology impact on other sectors ppt slide design
Presenting technology impact on other sectors PPT slide with all the attributes of a perfect PowerPoint embedded in it. This PPT has made use of high-resolution visuals. Since the slide is thoroughly editable, all you need to do is simply click on the download link provided and then save the PPT for further customization. Make use of company-specific details like brand name, logo or trademark for more personalized impact. The slide can be accessed by using any of the following - Google Slides, Mac, Microsoft PowerPoint. Also, it's formatting can be done using JPG, JPEG or PDF.
-
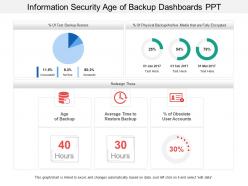 Information security age of backup dashboards snapshot ppt
Presenting this set of slides with name - Information Security Age Of Backup Dashboards Snapshot Ppt. This is a two stage process. The stages in this process are Information Security Strategy, Information Security Plan, Information Protection Strategy.
-
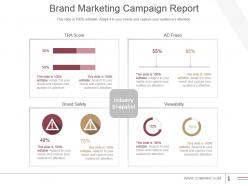 Brand marketing campaign report powerpoint guide
Presenting brand marketing campaign report powerpoint guide. This is a brand marketing campaign report powerpoint guide. This is a four stage process. The stages in this process are brand safety, industry snapshot, viewability, tra score, ad fraud.
-
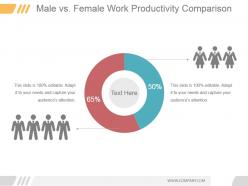 Male vs female work productivity comparison ppt infographics
Presenting male vs female work productivity comparison ppt infographics. This is a male vs female work productivity comparison ppt infographics. This is a two stage process. The stages in this process are finance, business, percentage, compare, marketing.
-
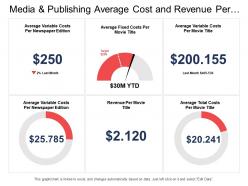 Media and publishing average cost and revenue per movie title dashboard
Presenting this set of slides with name - Media And Publishing Average Cost And Revenue Per Movie Title Dashboard. This is a six stage process. The stages in this process are Media And Publishing, Media Communication.
-
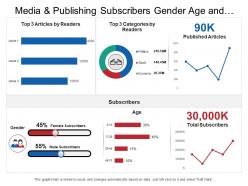 Media and publishing subscribers gender age and categories dashboard
Presenting this set of slides with name - Media And Publishing Subscribers Gender Age And Categories Dashboard. This is a six stage process. The stages in this process are Media And Publishing, Media Communication.
-
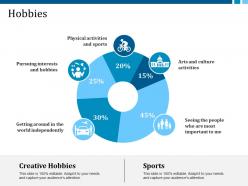 Hobbies pursuing interests and hobbies physical activities and sports
Presenting hobbies and sports PPT template. This is an astounding PowerPoint graphic which also has an immensely delineated PPT design visual narrative. All the contents, symbols, formats, and PowerPoint Image etc. are fully alterable. The PPT design is descriptive with an elasticity to restore the statistics. This PPT template is also advantageous for Human resource managers, physiologists. This is also well conversant with Google Slides.
-
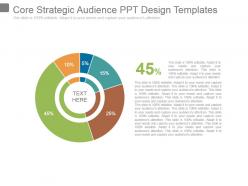 Core strategic audience ppt design templates
Presenting core strategic audience ppt design templates. This is a core strategic audience ppt design templates. This is a five stage process. The stages in this process are business, marketing, finance, management, strategy.
-
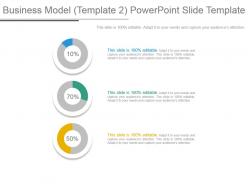 Business model template 2 powerpoint slide template
Presenting business model template 2 powerpoint slide template. This is a business model template 2 powerpoint slide template. This is a three stage process. The stages in this process are percentage, process, business, marketing, strategy, success.
-
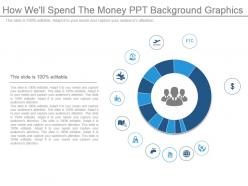 How well spend the money ppt background graphics
Presenting how well spend the money ppt background graphics. This is a how well spend the money ppt background graphics. This is a one stage process. The stages in this process are business, marketing, strategy, success, management.
-
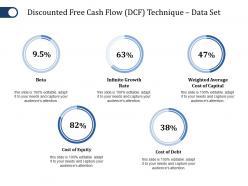 Discounted free cash flow technique data set ppt file introduction
Presenting this set of slides with name - Discounted Free Cash Flow Technique Data Set Ppt File Introduction. This is a five stage process. The stages in this process are Beta, Cost Of Equity, Cost Of Debt, Infinite Growth Rate, Weighted Average Cost Of Capital.
-
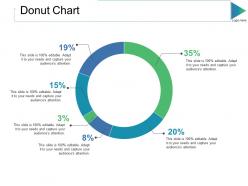 Donut chart ppt slides portrait
Presenting this set of slides with name - Donut Chart Ppt Slides Portrait. This is a six stage process. The stages in this process are Business, Marketing, Strategy, Percentage, Process.
-
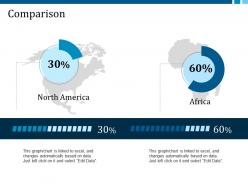 Comparison ppt model format ideas
Presenting this set of slides with name - Comparison Ppt Model Format Ideas. This is a two stage process. The stages in this process are Financial, North America, Africa, Business, Percentage.
-
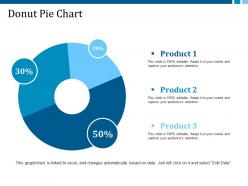 Donut pie chart ppt model clipart
Presenting this set of slides with name - Donut Pie Chart Ppt Model Clipart. This is a three stage process. The stages in this process are Product, Business, Percentage, Finance, Donut.
-
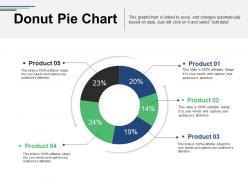 Donut pie chart example of great ppt
Presenting this set of slides with name - Donut Pie Chart Example Of Great Ppt. This is a five stage process. The stages in this process are Donut, Marketing, Strategy, Planning, Finance.
-
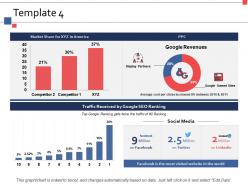 Template 4 ppt inspiration design ideas
Presenting this set of slides with name - Template 4 Ppt Inspiration Design Ideas. This is a four stage process. The stages in this process are Business, Management, Strategy, Analysis, Marketing.
-
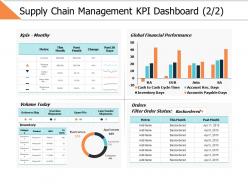 Supply chain management kpi dashboard 2 2 ppt powerpoint presentation gallery visuals
Presenting this set of slides with name - Supply Chain Management Kpi Dashboard 2 2 Ppt Powerpoint Presentation Gallery Visuals. This is a two stage process. The stages in this process are Business, Management, Strategy, Analysis, Finance.
-
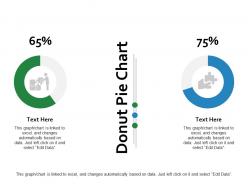 Donut pie chart investment ppt powerpoint presentation inspiration model
Presenting this set of slides with name - Donut Pie Chart Investment Ppt Powerpoint Presentation Inspiration Model. This is a two stages process. The stages in this process are Donut Pie Chart, Finance, Marketing, Management, Investment.
-
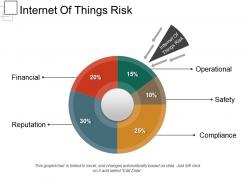 Internet of things risk
Presenting the Internet Of Things Risk PowerPoint slide. This PPT theme is compatible with Google slides hence is easily accessible. You can easily download this PowerPoint template in various formats like PDF, JPG and PNG. This PPT template can be modified as per your needs. You can alter the font, font size and color easily. This ready to use PPT layout is available in both 4:3 and 16:9 aspect ratios.
-
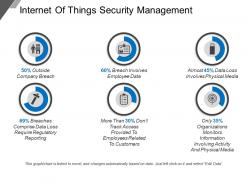 Internet of things security management
Presenting the Internet Of Things Security Management PowerPoint slide. This PPT layout is easy to download and save in different formats like PDF, JPG and PNG. You can modify the font size, font type, color as our PPT theme is completely editable. This PowerPoint presentation is available in 4:3 and 16:9 aspect ratios. The template is adaptable to Google Slides.
-
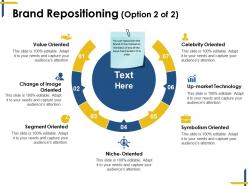 Brand repositioning ppt example file
Presenting this set of slides with name - Brand Repositioning Ppt Example File. This is a seven stage process. The stages in this process are Value Oriented, Segment Oriented, Niche Oriented, Celebrity Oriented, Symbolism Oriented.
-
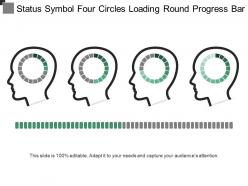 Status symbol four circles loading round progress bar 2
Presenting status symbol four circles loading round progress bar 2. This is a status symbol four circles loading round progress bar 2. This is a four stage process. The stages in this process are status symbol, status icon.
-
 Social media facts presentation diagrams
Presenting this set of slides with name - Social Media Facts Presentation Diagrams. This is a three stage process. The stages in this process are Facebook, Sound Cloud, Google Plus.
-
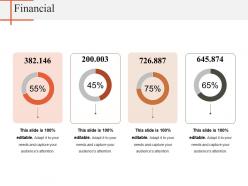 Financial powerpoint slide themes
Presenting this set of slides with name - Financial Powerpoint Slide Themes. This is a three stage process. The stages in this process are Donut, Strategy, Finance, Planning, Marketing.
-
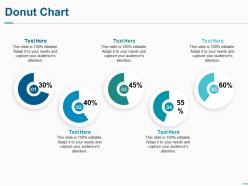 Donut chart ppt visual aids background images
Presenting this set of slides with name - Donut Chart Ppt Visual Aids Background Images. This is a five stage process. The stages in this process are Percentage, Product, Business, Management, Marketing.
-
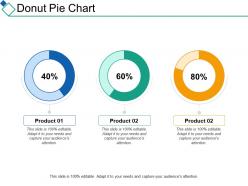 Donut pie chart marketing finance ppt summary designs download
Presenting this set of slides with name - Donut Pie Chart Marketing Finance Ppt Summary Designs Download. This is a three stage process. The stages in this process are Finance, Analysis, Business, Investment, marketing.
-
 Financial business planning ppt summary infographic template
Presenting this set of slides with name - Financial Business Planning Ppt Summary Infographic Template. This is a three stage process. The stages in this process are Financial, Maximum, Medium, Minimum, Marketing.
-
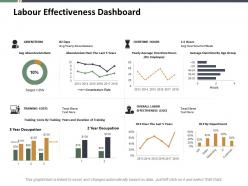 Labour effectiveness dashboard snapshot ppt slides graphics download
Presenting this set of slides with name - Labour Effectiveness Dashboard Snapshot Ppt Slides Graphics Download. This is a four stage process. The stages in this process are Percentage, Product, Business, Management, Marketing.
-
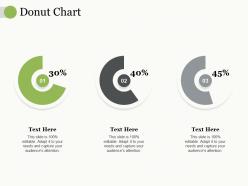 Donut chart ppt portfolio example introduction
Presenting this set of slides with name - Donut Chart Ppt Portfolio Example Introduction. This is a three stage process. The stages in this process are Business, Marketing, Percentage, Product.
-
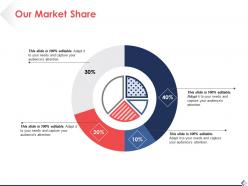 Our market share ppt pictures background designs
Presenting this set of slides with name - Our Market Share Ppt Pictures Background Designs. This is a four stage process. The stages in this process are Finance, Analysis, Business, Investment, Marketing.
-
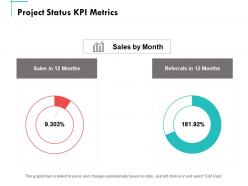 Project status kpi metrics ppt powerpoint presentation summary brochure
Presenting this set of slides with name - Project Status Kpi Metrics Ppt Powerpoint Presentation Summary Brochure. This is a two stages process. The stages in this process are Finance, Marketing, Management, Investment, Analysis.
-
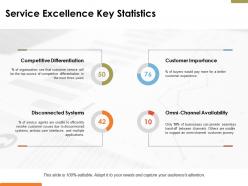 Service excellence key statistics ppt powerpoint presentation file infographics
Presenting this set of slides with name - Service Excellence Key Statistics Ppt Powerpoint Presentation File Infographics. This is a four stage process. The stages in this process are Donut, Competitive Differentiation, Customer Importance, Disconnected Systems, Omni-Channel Availability.
-
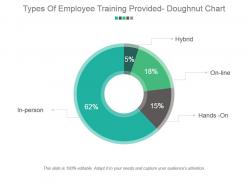 Types of employee training provided doughnut chart powerpoint slide clipart
Presenting types of employee training provided doughnut chart powerpoint slide clipart. This is a types of employee training provided doughnut chart powerpoint slide clipart. This is a four stage process. The stages in this process are in person, hybrid, on-line, hands on.
-
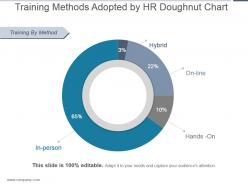 Training methods adopted by hr doughnut chart good ppt example
Presenting training methods adopted by hr doughnut chart good ppt example. This is a training methods adopted by hr doughnut chart good ppt example. This is a four stage process. The stages in this process are training by method, in person, hybrid, online, hands on.
-
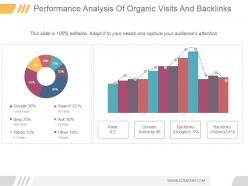 Performance analysis of organic visits and backlinks powerpoint guide
Presenting performance analysis of organic visits and backlinks powerpoint guide. This is a performance analysis of organic visits and backlinks powerpoint guide. This is a two stage process. The stages in this process are rank, domain authority, backlinks google, backlinks yahoo, google, bing, yahoo, search, ask, other.
-
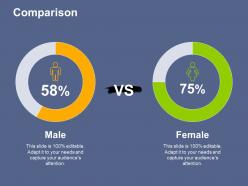 Comparison business value alignment ppt file background images
Presenting this set of slides with name - Comparison Business Value Alignment Ppt File Background Images. This is two stage process. The stages in this process are Comparison, Male, Female, Strategy, Business.
-
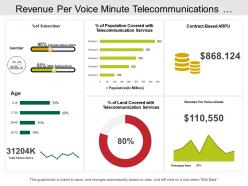 Revenue per voice minute telecommunications dashboard
Presenting this set of slides with name - Revenue Per Voice Minute Telecommunications Dashboard. Innovatively crafted Presentation design as it comes with amazing picture quality. Editing is possible with color, text, font and shape. Fast download and can be convert in JPEG and PDF format. PPT slide gives a specialized effect to your Presentation template. Preference customizes the PowerPoint template adding business name and icon. PPT diagram can be shared in standard and widescreen view. PPT graphic can be downloaded with different nodes and stages as required.
-
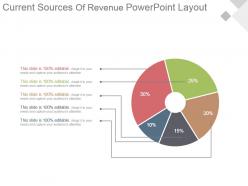 Current sources of revenue powerpoint layout
Presenting current sources of revenue powerpoint layout. Presenting current sources of revenue powerpoint layout. Presenting current sources of revenue powerpoint layout. This is a current sources of revenue powerpoint layout. This is five stage process. The stages in this process are business, percentage, finance, strategy, success.
-
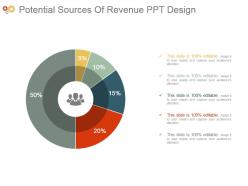 Potential sources of revenue ppt designs
Presenting potential sources of revenue ppt designs. This is a potential sources of revenue ppt designs. This is a five stage process. The stages in this process are business, management, marketing, finance, operating.
-
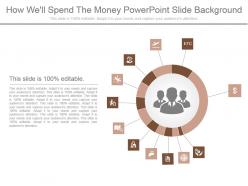 How well spend the money powerpoint slide background
Presenting how well spend the money powerpoint slide background. This is a how well spend the money powerpoint slide background. This is a one stage process. The stages in this process are icons, process, business, marketing, strategy, success, management.
-
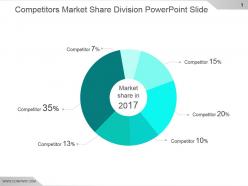 Competitors market share division powerpoint slide
Presenting competitors market share division powerpoint slide. This is a competitors market share division powerpoint slide. This is a six stage process. The stages in this process are competitor, percentage, marketing, strategy, business, success.
-
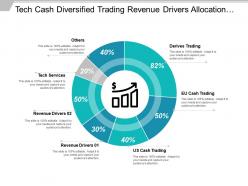 Tech cash diversified trading revenue drivers allocation chart with icons
Presenting this set of slides with name - Tech Cash Diversified Trading Revenue Drivers Allocation Chart With Icons. This is a seven stage process. The stages in this process are Revenue Drivers, Income Drivers, Earning Drivers.
-
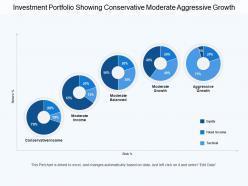 Investment portfolio showing conservative moderate aggressive growth
Presenting this set of slides with name - Investment Portfolio Showing Conservative Moderate Aggressive Growth. This is a five stage process. The stages in this process are Investment Portfolio, Funding Portfolio, Expenditure Portfolio.


