- Sub Categories
-
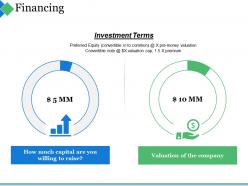 Financing ppt styles structure
Presenting this set of slides with name - Financing Ppt Styles Structure. This is a two stage process. The stages in this process are How Much Capital Are You Willing To Raise, Valuation Of The Company, Investment Terms, Financing.
-
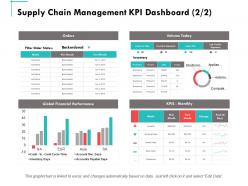 Supply chain management kpi dashboard business ppt powerpoint presentation summary maker
Presenting this set of slides with name - Supply Chain Management Kpi Dashboard Business Ppt Powerpoint Presentation Summary Maker. This is a four stages process. The stages in this process are Finance, Marketing, Management, Investment, Analysis.
-
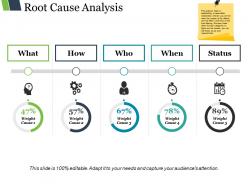 Root cause analysis good ppt example
Presenting Root Cause Analysis Good PPT Example which is designed professionally for your convenience. Change the color, fonts, font size, and font types of the template as per the requirements. The model is readily available in both 4:3 and 16:9 aspect ratio. It is compatible with Google Slides which makes it accessible at once. Can be converted into formats like PDF, JPG, and PNG.
-
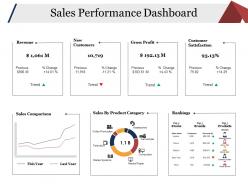 Sales performance dashboard ppt slide examples
Presenting this set of slides with name - Sales Performance Dashboard Ppt Slide Examples. This is a seven stage process. The stages in this process are Revenue, New Customers, Gross Profit, Customer Satisfaction, Sales Comparison.
-
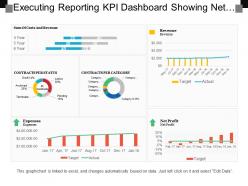 Executing reporting kpi dashboard showing net profit expenses contracts per category
Presenting this set of slides with name - Executing Reporting Kpi Dashboard Showing Net Profit Expenses Contracts Per Category. This is a six stage process. The stages in this process are Executive Reporting, Executive Analysis, Executive Performance.
-
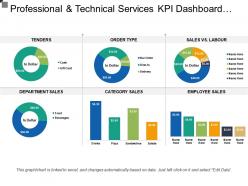 Professional and technical services kpi dashboard showing department sales
Presenting this set of slides with name - Professional And Technical Services Kpi Dashboard Showing Department Sales. This is a six stage process. The stages in this process are Professional And Technical Services, Services Management, Technical Management.
-
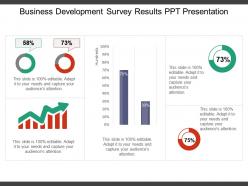 Business development survey results ppt presentation
Presenting business development survey results PPT presentation slideshow PPT which is 100% editable. This PPT template easy to customize and enables you to personalize it as per your own criteria. The presentation slide is data driven that is excel linked chart and fully compatible with Google slides, multiple format and software options. In case of any assistance, kindly take instructions from our presentation design services and it is easy to download in a very short span of time. The images, layouts, designs are of high quality and ensures quality in widescreen.
-
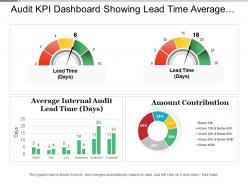 Audit kpi dashboard showing lead time average entry variance and amount contribution
Presenting this set of slides with name - Audit Kpi Dashboard Showing Lead Time Average Entry Variance And Amount Contribution. This is a four stage process. The stages in this process are Audit, Examine, Survey.
-
 Operating expenses by category powerpoint slide inspiration
Presenting operating expenses by category powerpoint slide inspiration. This is a operating expenses by category powerpoint slide inspiration. This is a five stage process. The stages in this process are business, management, marketing, finance, operating.
-
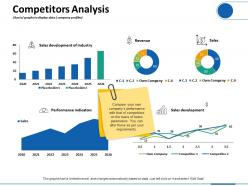 Competitors analysis charts graphs to display data company profiles
Presenting this set of slides with name - Competitors Analysis Charts Graphs To Display Data Company Profiles. This is a five stage process. The stages in this process are Revenue, Sales Development, Performance Indicators, Finance, Marketing.
-
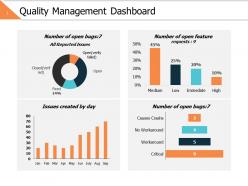 Quality management dashboard ppt powerpoint presentation gallery ideas
Presenting this set of slides with name - Quality Management Dashboard Ppt Powerpoint Presentation Gallery Ideas. This is a four stage process. The stages in this process are Business, Management, Strategy, Analysis, Finance.
-
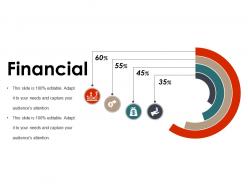 Financial ppt diagrams
Presenting the Financial PPT Diagrams PPT visual which is completely editable. The slide is readily available in both 4:3 and 16:9 aspect ratio. Customize the fonts, colors, font type, and font size of the slide as per your requirements. You can save your presentation in various formats like PDF, JPG, and PNG. The template is compatible with Google Slides, which makes it accessible at once.
-
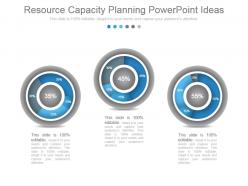 Resource capacity planning powerpoint ideas
Presenting resource capacity planning powerpoint ideas. This is a resource capacity planning powerpoint ideas. This is a three stage process. The stages in this process are percentage, business, process, marketing, management, strategy, success.
-
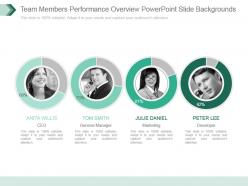 Team members performance overview powerpoint slide backgrounds
Presenting team members performance overview powerpoint slide backgrounds. This is a team members performance overview powerpoint slide backgrounds. This is a four stage process. The stages in this process are team members, performance overview, business, strategy, marketing, management, presentation.
-
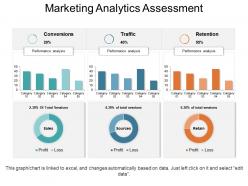 Marketing analytics assessment powerpoint templates
Presenting Marketing Analytics Assessment PowerPoint Templates.The designs are 100% editable in this PowerPoint template. The font size, font color, graphic colors, and slide background can be customized without any hassle. The users can add or remove the images according to their needs. This template includes one slide which is designed by keeping compatibility with Google Slides in mind. It is available in both standard and widescreen.
-
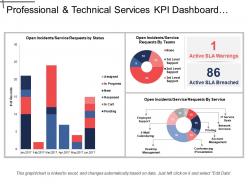 Professional and technical services kpi dashboard showing open incidents and service requests
Presenting this set of slides with name - Professional And Technical Services Kpi Dashboard Showing Open Incidents And Service Requests. This is a three stage process. The stages in this process are Professional And Technical Services, Services Management, Technical Management.
-
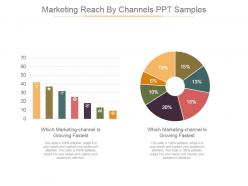 Marketing reach by channels ppt samples
Presenting marketing reach by channels ppt samples. This is a marketing reach by channels ppt samples. This is a seven stage process. The stages in this process are which marketing channel is growing fastest, strategy, financial, business, management.
-
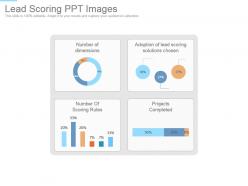 Lead scoring ppt images
Presenting lead scoring ppt images. This is a lead scoring ppt images. This is a four stage process. The stages in this process are adoption of lead scoring solutions chosen, projects completed, number of scoring rules, number of dimensions.
-
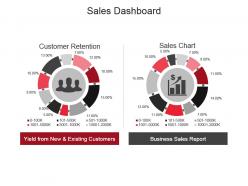 Sales dashboard powerpoint slide show
Presenting sales dashboard powerpoint slide show. This is a sales dashboard powerpoint slide show. This is a two stage process. The stages in this process are customer retention, sales chart, yield from new and existing customers, business sales report.
-
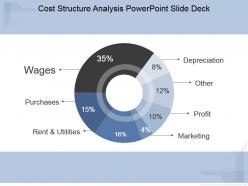 Cost structure analysis powerpoint slide deck
Presenting cost structure analysis powerpoint slide deck. This is a cost structure analysis powerpoint slide deck. This is a seven stage process. The stages in this process are wages, purchases, rent and utilities, depreciation, other, profit, marketing.
-
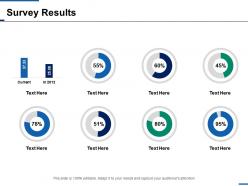 Survey results finance ppt inspiration background designs
Presenting this set of slides with name - Survey Results Finance Ppt Inspiration Background Designs. This is a eight stage process. The stages in this process are Finance, Analysis, Business, Investment, Marketing.
-
 0514 display analysis with data driven pie chart powerpoint slides
We are proud to present our 0514 display analysis with data driven pie chart powerpoint slides. This Business Power Point template is designed to display analysis of data driven result in any business presentation. Create a good impact on your viewers with our unique template collection.
-
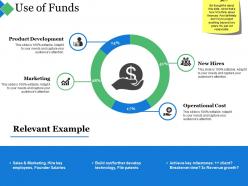 Use of funds ppt summary files
Presenting this set of slides with name - Use Of Funds Ppt Summary Files. This is a four stage process. The stages in this process are Business, Product Development, Marketing, New Hires, Operational Cost.
-
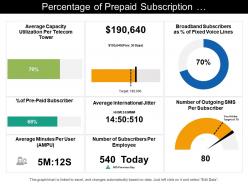 Percentage of prepaid subscription telecommunications dashboard
Presenting this set of slides with name - Percentage Of Prepaid Subscription Telecommunications Dashboard. High resolution presentation slide as pixels never break. Wide screen projection does not affect the output adversely. Easy to edit and customize colorful PPT design. Easy share information with this PowerPoint template. Increase the level of personalization with your company logo and name. Compatible with all software and can be saved in any format JPG and PDF. Presentation diagram can be downloaded within few seconds and can be saved easily.
-
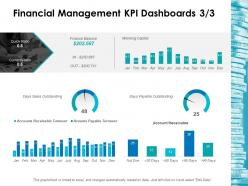 Financial management kpi dashboards 3 3 ppt layouts background images
Presenting this set of slides with name - Financial Management Kpi Dashboards 3 3 Ppt Layouts Background Images. This is a three stage process. The stages in this process are Business, Management, Strategy, Analysis, Marketing.
-
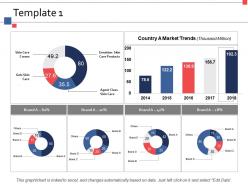 Template 1 ppt inspiration themes
Presenting this set of slides with name - Template 1 Ppt Inspiration Themes. This is a four stage process. The stages in this process are Business, Management, Strategy, Analysis, Marketing.
-
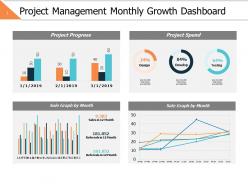 Project management monthly growth dashboard slide2 ppt powerpoint presentation file outfit
Presenting this set of slides with name - Project Management Monthly Growth Dashboard Slide2 Ppt Powerpoint Presentation File Outfit. This is a four stage process. The stages in this process are Business, Management, Strategy, Analysis, Finance.
-
 Comparison ppt slides elements
Presenting this set of slides with name - Comparison Ppt Slides Elements. This is a two stage process. The stages in this process are Business, Marketing, Percentage, Female, Male.
-
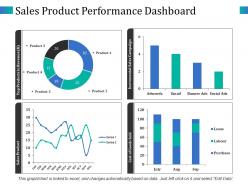 Sales product performance dashboard top products in revenue
Highlighting sales product performance dashboard top products in revenue PowerPoint slide. Easy and convenient downloading by following simple steps. No concession with the quality, once opened on wide screen. Modify and personalize the presentation by including the company name and logo. Guidance for executing the changes has been provided for assistance. Useful for sales leaders, marketers, business professionals, analysts, strategists, students, teachers, etc. Compatible with Microsoft office software and the Google Slides. Available to be saved in jpg or pdf format.
-
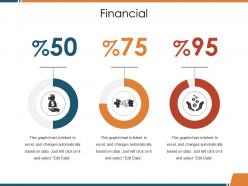 Financial ppt graphics
Presenting this set of slides with name - Financial Ppt Graphics. This is a three stage process. The stages in this process are Financial, Percentage, Business, Marketing, Strategy.
-
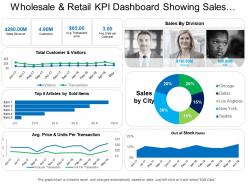 Wholesale and retail kpi dashboard showing sales revenue customers and out of stock items
Presenting the KPI dashboard presentation template. This PPT template is 100% customizable in MS PowerPoint and is designed under the strict supervision of professionals. The user can edit the objects in the slide like font size and font color without any hassle. This presentation template is 100% compatible with Google Slide and can be saved in JPG or PDF file format easily. Click on the download tab to download this presentation template.
-
 System integration ppt inspiration
Presenting this set of slides with name - System Integration Ppt Inspiration. This is a three stage process. The stages in this process are Planning, Implementation, Support, System Integration, Mobile.
-
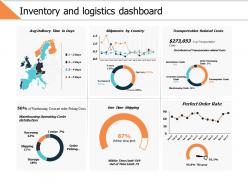 Inventory and logistics dashboard ppt powerpoint presentation file templates
Presenting this set of slides with name - Inventory And Logistics Dashboard Ppt Powerpoint Presentation File Templates. This is a six stage process. The stages in this process are Business, Management, Strategy, Analysis, Finance.
-
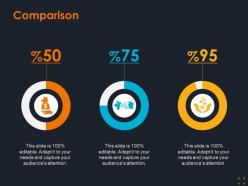 Comparison icons with percentage ppt summary graphic images
Presenting this set of slides with name - Comparison Icons With Percentage Ppt Summary Graphic Images. This is a three stage process. The stages in this process are Comparison, Marketing, Strategy, Finance, Business.
-
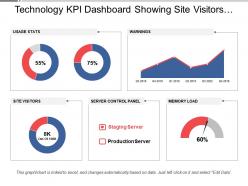 Technology kpi dashboard snapshot showing site visitors and server control panel
Showcasing technology KPI dashboard presentation slide that comes with editing options. PowerPoint design can be downloaded with different nodes and stages. Completely modifiable design as fonts, text, colors can be edited. Customize the presentation by adding trade information i.e. name, logo, icon and tagline. Simple and fast download. Easy convert into PDF or JPG formats. Works well with Google slides. PPT template is easy to share among large set of audience.
-
 Marketing expenditures pie chart powerpoint slide deck
Presenting marketing expenditures pie chart powerpoint slide deck. This is a marketing expenditures pie chart powerpoint slide deck. This is a five stage process. The stages in this process are business, finance, process, strategy, chart and graph.
-
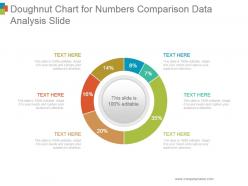 Doughnut chart for numbers comparison data analysis slide powerpoint topics
Presenting doughnut chart for numbers comparison data analysis slide powerpoint topics. This is a doughnut chart for numbers comparison data analysis slide powerpoint topics. This is a six stage process. The stages in this process are circular, process, percentage, financial, business.
-
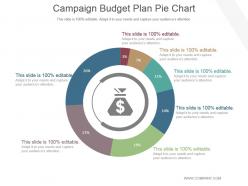 Campaign budget plan pie chart powerpoint ideas
Presenting campaign budget plan pie chart powerpoint ideas. This is a campaign budget plan pie chart powerpoint ideas. This is a seven stage process. The stages in this process are business, success, finance, strategy, management.
-
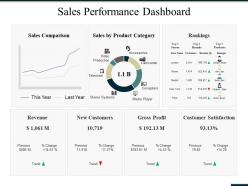 Sales performance dashboard ppt summary graphics tutorials
Presenting this set of slides with name - Sales Performance Dashboard Ppt Summary Graphics Tutorials. This is a three stage process. The stages in this process are Revenue, New Customers, Gross Profit, Customer Satisfaction, Rankings.
-
 Education and research kpi dashboard by country language and education types
Presenting education and research KPI dashboard by country language and education types PPT slide. The different language PPT template designed by the professional team of SlideTeam. The different country language report slide is fully editable in PowerPoint. The country language KPI report PowerPoint slide is compatible with Google Slide so a user can share this language dashboard slide with others. A user can make changes in the font size, font type, color as well as dimensions of the education distribution PPT template as per the requirement. You may edit the value in the new research program metric report template as the slide gets linked with the Excel sheet. .
-
 Education and research kpi dashboard showing response timeline and researcher engagement
Presenting education and research KPI dashboard showing response timeline and researcher engagement PPT slide. The education report PPT slide designed by professional team of SlideTeam. The research grant KPI dashboard presentation template is customizable in PowerPoint. The student attendance rate KPI report PowerPoint slide is also compatible with Google Slide so a user can share this template with others. A user can make changes in the font size, font type, color as well as dimensions of the education finance metric dashboard template as per the requirement. You may edit the value in the education KPI dashboard PowerPoint template as the slide gets linked with the Excel sheet. .
-
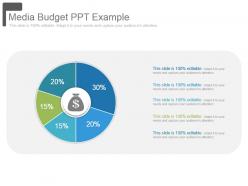 Media budget ppt example
Presenting media budget ppt example. This is a media budget ppt example. This is a five stage process. The stages in this process are finance, donut, business, success, marketing, strategy.
-
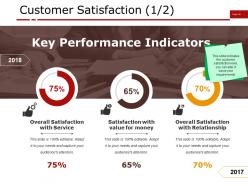 Customer satisfaction ppt examples professional
Presenting customer satisfaction ppt examples professional. Presenting customer satisfaction ppt examples professional. This is a customer satisfaction ppt examples professional. This is a three stage process. The stages in this process are overall satisfaction with service, satisfaction with value for money, overall satisfaction with relationship, percentage, business.
-
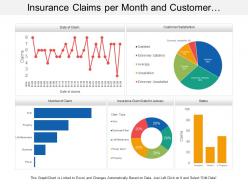 Insurance claims per month and customer satisfaction dashboard
Presenting this set of slides with name - Insurance Claims Per Month And Customer Satisfaction Dashboard. This is a five stage process. The stages in this process are Assurance, Surety, Insurance.
-
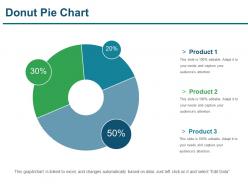 Donut pie chart presentation powerpoint
Presenting Donut Pie Chart Presentation Powerpoint. Easy to download PPT layout and can be saved in different formats like JPG, PDF, and PNG. This PowerPoint slide is completely editable so you can modify, font type, font color, shape and image according to your requirements. This Google Slides compatible PPT is available in 4:3 and 16:9 aspect ratios.
-
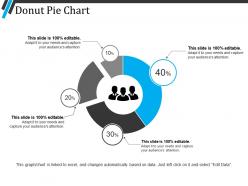 Donut pie chart example ppt presentation
Presenting donut pie chart example ppt presentation. This is a donut pie chart example ppt presentation. This is a four stage process. The stages in this process are donut pie chart, finance, marketing, strategy, analysis, business.
-
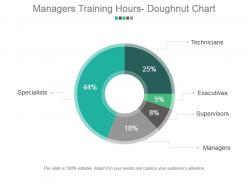 Managers training hours doughnut chart powerpoint slide
Presenting managers training hours doughnut chart powerpoint slide. This is a managers training hours doughnut chart powerpoint slide. This is a four stage process. The stages in this process are open positions by divisions, key metrics, total employees, employee churn.
-
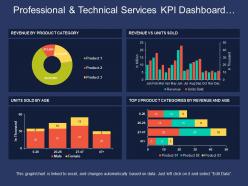 Professional and technical services kpi dashboard showing revenue vs units sold
Presenting this set of slides with name - Professional And Technical Services Kpi Dashboard Showing Revenue Vs Units Sold. This is a four stage process. The stages in this process are Professional And Technical Services, Services Management, Technical Management.
-
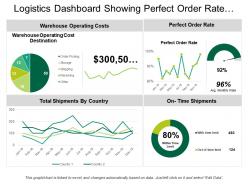 Logistics dashboard showing perfect order rate and on time shipments
Presenting Logistics Dashboard Showing Perfect Order Rate And On Time Shipments PPT slide. The on-time shipments dashboard PowerPoint template designed professionally by the team of SlideTeam to present the record of on time delivery to clients and investors. The different icons such as pie chart, ring, line chart and many other which include text in the perfect order rate dashboard slide are customizable in PowerPoint. A user can illustrate the desired values as the graphical dashboard template get linked with Excel Sheet and it is also compatible with Google Slide. A user can do alteration in the font size, font type, color and dimensions of the line and pie chart to present the desired delivery time.
-
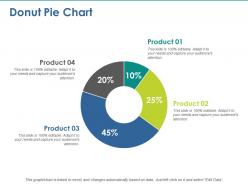 Donut pie chart with percentage ppt summary example introduction
Presenting this set of slides with name - Donut Pie Chart With Percentage Ppt Summary Example Introduction. This is a four stage process. The stages in this process are Donut Pie Chart, Finance, Analysis, Marketing, Strategy, Business.
-
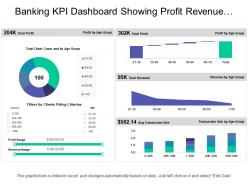 Banking kpi dashboard showing profit revenue transaction size
Presenting this set of slides with name - Banking Kpi Dashboard Showing Profit Revenue Transaction Size. This is a five stage process. The stages in this process are Banking, Finance, Money.
-
 Financial ppt summary slide download
Presenting this set of slides with name - Financial Ppt Summary Slide Download. This is a three stage process. The stages in this process are Business, Management, Strategy, Analysis, Marketing.
-
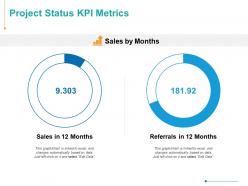 Project status kpi metrics finance ppt powerpoint presentation inspiration infographics
Presenting this set of slides with name - Project Status KPI Metrics Finance Ppt Powerpoint Presentation Inspiration Infographics. This is a two stage process. The stages in this process are Finance, Analysis, Business, Investment, Marketing.
-
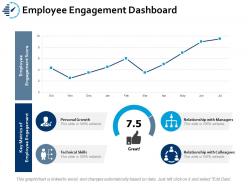 Employee engagement dashboard snapshot ppt portfolio slide download
Presenting this set of slides with name - Employee Engagement Dashboard Snapshot Ppt Portfolio Slide Download. This is a four stage process. The stages in this process are Business, Management, Strategy, Analysis, Icons.
-
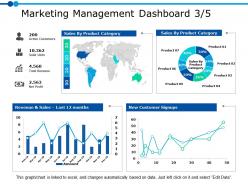 Marketing management dashboard 3 5 ppt powerpoint presentation gallery designs
Presenting this set of slides with name - Marketing Management Dashboard 3 5 Ppt Powerpoint Presentation Gallery Designs. This is a four stage process. The stages in this process are Business, Management, Strategy, Analysis, Marketing.
-
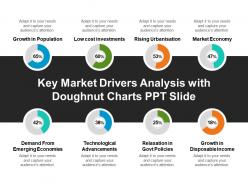 Key market drivers analysis with doughnut charts ppt slide
This highly versatile key market drivers PPT template can quickly be downloaded and converted into JPEG and PDF formats. You can change the design elements such as font type, color, size, and shape according to your customized business preferences. Add, edit or delete the information you want. PPT design can be opened with Google Slides and MS PowerPoint software. Both standard and full screen design views are available.rs.
-
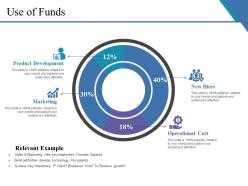 Use of funds ppt examples slides
Presenting this set of slides with name - Use Of Funds Ppt Examples Slides. This is a four stage process. The stages in this process are Product Development, Marketing, New Hires, Operational Cost, Relevant Example.
-
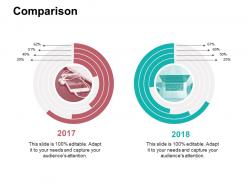 Comparison ppt background
Presenting comparison PPT background PPT slide. The circular comparison chart PowerPoint template designed by the professionals of SlideTeam to compare two products. The simple comparison chart PPT template is completely editable in PowerPoint. The comparison chart analysis PowerPoint slide is compatible with Google Slide and the comparison template gets linked with Excel data sheet. You can make changes in the font size, font type, color as well as dimensions of the circular icons in the comparison chart design presentation template as per the requirement.
-
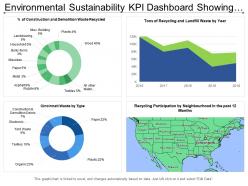 Environmental sustainability kpi dashboard showing recycling participation by neighborhood
Presenting this set of slides with name - Environmental Sustainability Kpi Dashboard Showing Recycling Participation By Neighborhood. This is a four stage process. The stages in this process are Environment Sustainability, Environment Continual, Environment Feasibility.
-
 Donut chart finance ppt powerpoint presentation summary example
Presenting this set of slides with name - Donut Chart Finance Ppt Powerpoint Presentation Summary Example. This is a three stage process. The stages in this process are Finance, Analysis, Business, Investment, Marketing.


