- Sub Categories
-
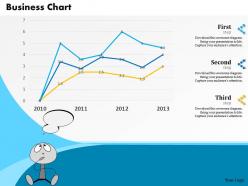 0514 annual business data driven chart powerpoint slides
We are proud to present our 0514 annual business data driven chart powerpoint slides. An annual based data driven chart graphic is used in this business power point template. This professional template is well crafted for various business presentations.
-
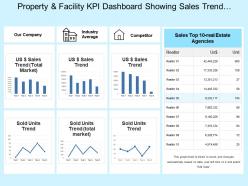 Property and facility kpi dashboard showing sales trend and sales performance
Grab an opportunity to see, property and facility KPI dashboard showing sales trend and sales performance PowerPoint Presentation Slide. This Presentation has been designed under the strict supervision of professionals and is fully editable. You can have access to play with the font size, font type, colors, and even the background. This Template is achievable with Google Slide and can be saved in JPG or PDF format without any obstacles created during the saving process. Fast download at the click of the button.
-
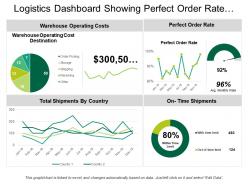 Logistics dashboard showing perfect order rate and on time shipments
Presenting Logistics Dashboard Showing Perfect Order Rate And On Time Shipments PPT slide. The on-time shipments dashboard PowerPoint template designed professionally by the team of SlideTeam to present the record of on time delivery to clients and investors. The different icons such as pie chart, ring, line chart and many other which include text in the perfect order rate dashboard slide are customizable in PowerPoint. A user can illustrate the desired values as the graphical dashboard template get linked with Excel Sheet and it is also compatible with Google Slide. A user can do alteration in the font size, font type, color and dimensions of the line and pie chart to present the desired delivery time.
-
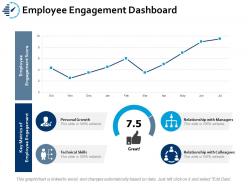 Employee engagement dashboard snapshot ppt portfolio slide download
Presenting this set of slides with name - Employee Engagement Dashboard Snapshot Ppt Portfolio Slide Download. This is a four stage process. The stages in this process are Business, Management, Strategy, Analysis, Icons.
-
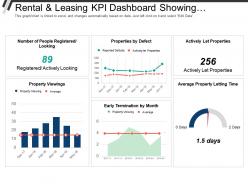 Rental and leasing kpi dashboard showing properties by defect and actively let properties
Presenting this set of slides with name - Rental And Leasing Kpi Dashboard Showing Properties By Defect And Actively Let Properties. This is a six stage process. The stages in this process are Rental And Leasing, Dealing And Leasing, Rental And Engage.
-
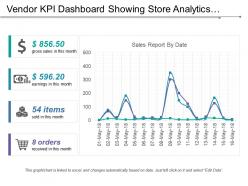 Vendor kpi dashboard showing gross sales earnings sold and sales report
Presenting this set of slides with name - Vendor Kpi Dashboard Showing Gross Sales Earnings Sold And Sales Report. This is a four stage process. The stages in this process are Vendor, Supplier, Retailer.
-
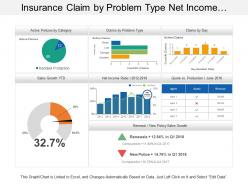 Insurance claim by problem type net income ratio dashboard
Presenting this set of slides with name - Insurance Claim By Problem Type Net Income Ratio Dashboard. This is a five stage process. The stages in this process are Assurance, Surety, Insurance.
-
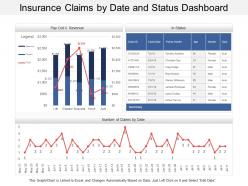 Insurance claims by date and status dashboard
Presenting this set of slides with name - Insurance Claims By Date And Status Dashboard. This is a three stage process. The stages in this process are Assurance, Surety, Insurance.
-
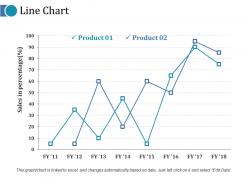 Line chart ppt outline mockup
Presenting this set of slides with name - Line Chart Ppt Outline Mockup. This is a two stage process. The stages in this process are Product, Sales In Percentage, Finance, Line Chart, Business.
-
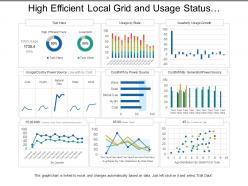 High efficient local grid and usage status utilities dashboard
Presenting this set of slides with name - High Efficient Local Grid And Usage Status Utilities Dashboard. This is a three stage process. The stages in this process are Utilities, Use, Advantage.
-
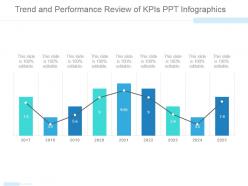 Trend and performance review of kpis ppt infographics
Presenting trend and performance review of kpis ppt infographics. This is a trend and performance review of kpis ppt infographics. This is a nine stage process. The stages in this process are graph, finance, business, marketing, year.
-
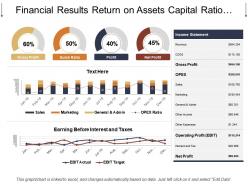 Financial results return on assets capital ratio ppt design
Exhibiting financial results return on assets capital ratio PPT design. Fully amendable content as color, text and shape are easily editable. Easy to add business name, icon or title. Awesome picture quality as do not break when anticipated on large screen. Easy and quick download with saving options. The PowerPoint slide can be presented in standard and widescreen view. Preference to download with different nodes and stages. PPT diagram can be shared with Google slides.
-
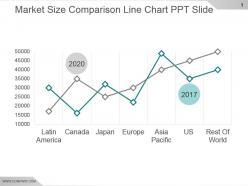 Market size comparison line chart ppt slide
Presenting market size comparison line chart ppt slide. This is a market size comparison line chart ppt slide. This is a two stage process. The stages in this process are latin america, canada, japan, europe, asia pacific, us, rest of world.
-
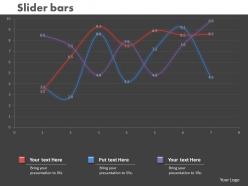 0414 slider line chart marketing illustration powerpoint graph
We are proud to present our 0414 slider line chart marketing illustration powerpoint graph. Our Slider Line Chart Business Illustration Powerpoint Graph Powerpoint Templates are aesthetically designed to attract attention. We guarantee that they will grab all the eyeballs you need. Our Slider Line Chart Business Illustration Powerpoint Graph Powerpoint Templates are specially created by a professional team with vast experience. They diligently strive to come up with the right vehicle for your brilliant Ideas.
-
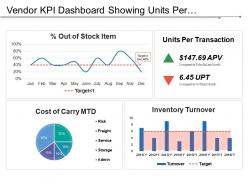 Vendor kpi dashboard showing units per transaction percentage out of stock items
Presenting this set of slides with name - Vendor Kpi Dashboard Showing Units Per Transaction Percentage Out Of Stock Items. This is a four stage process. The stages in this process are Vendor, Supplier, Retailer.
-
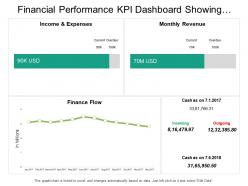 Financial performance kpi dashboard showing income expenses monthly revenue
Presenting this set of slides with name - Financial Performance Kpi Dashboard Showing Income Expenses Monthly Revenue. This is a four stage process. The stages in this process are Financial Performance, Financial Report, Financial Review.
-
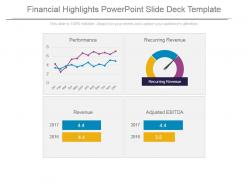 Financial highlights powerpoint slide deck template
Presenting financial highlights powerpoint slide deck template. This is a financial highlights powerpoint slide deck template. This is a four stage process. The stages in this process are performance, recurring revenue, revenue, adjusted ebitda.
-
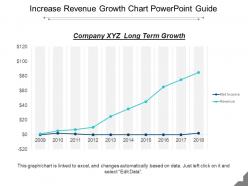 Increase revenue growth chart powerpoint guide
Presenting Increase revenue growth chart PowerPoint guide. This presentation slide is totally supported with Google Slides. This layout offers an easy conversion to other software like JPG and PDF formats. The image quality of these slides remains unchanged even when you enlarge the image or portray on large screens. This template is easily downloadable template and offers simple editing options with its color schemes, text, and fonts. User can edit the data in linked excel sheet and graphs and charts gets customized accordingly.
-
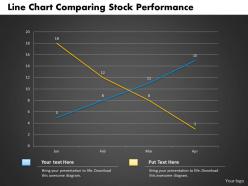 0414 line chart comparing stock performance powerpoint graph
We are proud to present our 0414 line chart comparing stock performance powerpoint graph. Our Line Chart Comparing Stock Performance Powerpoint Graph Powerpoint Templates are creatively constructed and eye catching. Focus attention on the key issues of your presentation. Use our Line Chart Comparing Stock Performance Powerpoint Graph Powerpoint Templates and nail the day. Lead your team show them the way.
-
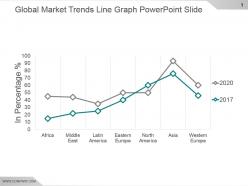 Global market trends line graph powerpoint slide
Presenting global market trends line graph powerpoint slide. This is a global market trends line graph powerpoint slide. This is a two stage process. The stages in this process are africa, middle east, latin america, eastern europe, north america, asia, western europe.
-
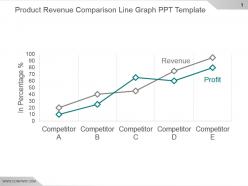 Product revenue comparison line graph ppt template
Presenting product revenue comparison line graph ppt template. This is a product revenue comparison line graph ppt template. This is a two stage process. The stages in this process are revenue, profit, competitor.
-
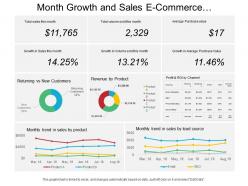 Month growth and sales e commerce dashboard
Presenting this set of slides with name - Month Growth And Sales E Commerce Dashboard. This is a seven stage process. The stages in this process are Mercantilism, Commercialism, Ecommerce.
-
 Entertainment recreation and arts kpi dashboard average annual expenditure and time spent
Presenting this set of slides with name - Entertainment Recreation And Arts Kpi Dashboard Average Annual Expenditure And Time Spent. This is a three stage process. The stages in this process are Entertainment, Recreation And Arts, Attractions, Culture, Entertainment.
-
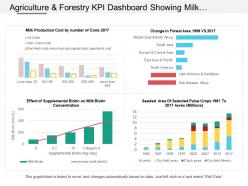 Agriculture and forestry kpi dashboard showing milk production cost by number of cows
Readymade agriculture and forestry KPI dashboard showing milk production cost by number of cows PPT template. Attuned with Microsoft office software’s as well as Google slides. Amend and customize the PPT slide by adding the corporate trademark. Assistance to make changes has been provided in the slide. Useful for sales leaders, marketers, business professionals, analysts, strategists, etc. Effortlessly and fluently adjustable by any user at any time without even having any expertize. Fast to download, share and insert in the presentation.
-
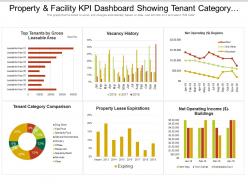 Property and facility kpi dashboard showing tenant category comparison and vacancy history
Get a chance to explore, property and facility KPI dashboard showing tenant category comparison and vacancy history PowerPoint Presentation Slide. This Presentation has been designed by professionals and is fully editable. You can remodel the font size, font type, colors, and even the background. This Template is friendly with Google Slide and can be saved in JPG or PDF format without any chaos created. Fast download at the click of the button.
-
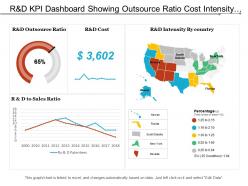 R and d kpi dashboard showing outsource ratio cost intensity by country and r and d to sales ratio
Presenting this set of slides with name - R And D Kpi Dashboard Showing Outsource Ratio Cost Intensity By Country And R And D To Sales Ratio. This is a four stage process. The stages in this process are R And D, Research And Development, Research And Technological Development.
-
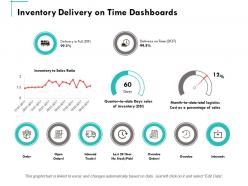 Inventory delivery on time dashboards ppt powerpoint presentation summary clipart
Presenting this set of slides with name - Inventory Delivery On Time Dashboards Ppt Powerpoint Presentation Summary Clipart. This is a five stages process. The stages in this process are Finance, Marketing, Management, Investment, Analysis.
-
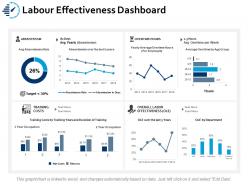 Labour effectiveness dashboard snapshot ppt portfolio format
Presenting this set of slides with name - Labour Effectiveness Dashboard Snapshot Ppt Portfolio Format. This is a four stage process. The stages in this process are Business, Management, Strategy, Sales, Marketing.
-
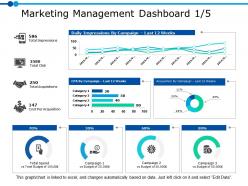 Marketing management dashboard 1 5 ppt powerpoint presentation gallery background image
Presenting this set of slides with name - Marketing Management Dashboard 1 5 Ppt Powerpoint Presentation Gallery Background Image. This is a four stage process. The stages in this process are Business, Management, Strategy, Analysis, Marketing.
-
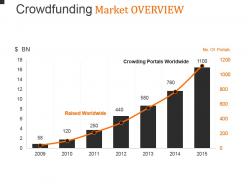 Crowdfunding market overview powerpoint guide
Presenting crowdfunding market overview powerpoint guide. This is a crowdfunding market overview powerpoint guide. This is a seven stage process. The stages in this process are raised worldwide, crowding portals worldwide.
-
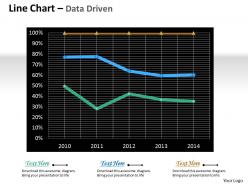 Data driven line chart for market survey powerpoint slides
We are proud to present our data driven line chart for market survey powerpoint slides. Bask In The Warmth Of Our Data Driven Line Chart For Market Survey Powerpoint Slides Power Point Templates. Enjoy The Heartfelt Glowing Response Of Your Listeners. Rise To The Occasion With Our Data Driven Line Chart For Market Survey Powerpoint Slides Power Point Templates. You Will Bring Your Audience On Their Feet In No Time.
-
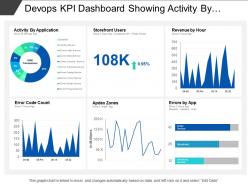 Devops kpi dashboard showing activity by application and errors by app
Presenting this set of slides with name - Devops Kpi Dashboard Showing Activity By Application And Errors By App. This is a six stage process. The stages in this process are Development And Operations, Devops.
-
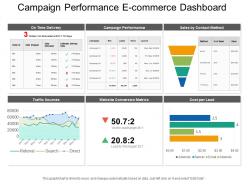 Campaign performance e commerce dashboard
Presenting this set of slides with name - Campaign Performance E Commerce Dashboard. This is a six stage process. The stages in this process are Mercantilism, Commercialism, Ecommerce.
-
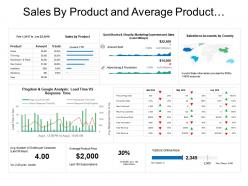 Sales by product and average product price e commerce dashboard
Presenting this set of slides with name - Sales By Product And Average Product Price E Commerce Dashboard. This is a eight stage process. The stages in this process are Mercantilism, Commercialism, Ecommerce.
-
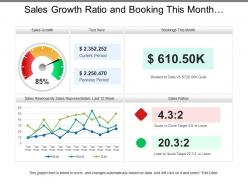 Sales growth ratio and booking this month dashboard
Presenting this set of slides with name - Sales Growth Ratio And Booking This Month Dashboard. This is a four stage process. The stages in this process are Sales Dashboard, Sales Kpis, Sales Performance.
-
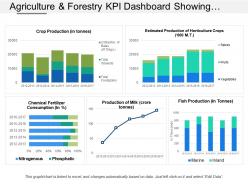 Agriculture and forestry kpi dashboard showing crop production and chemical fertilizers consumptions
Displaying agriculture and forestry KPI dashboard showing crop production and chemical fertilizers consumptions presentation slide. Modify the design with trademark and picture. PowerPoint diagram is well-matched with Google slides. Colors and text can be amended as the PPT graphic comes with easy to use editing options. Presentation design can be delivered in both standard and widescreen display view. Flexible with other software options such as PDF or JPG formats as can be converted effortlessly.
-
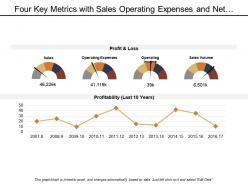 Four key metrics with sales operating expenses and net income
The design template can be downloaded on a single click from SlideTeam web page. Design can be saved as JPEG or PDF formats. Best advantage of this design template is that it’s completely editable; you can modify and customize the design template according to your business needs. The PowerPoint design is completely supported on standard and full screen view, no effect on design quality when opened on full screen view.
-
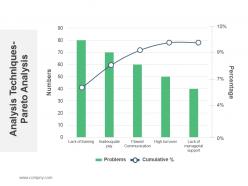 Analysis techniques pareto analysis ppt sample
Presenting analysis techniques pareto analysis ppt sample. This is a analysis techniques pareto analysis ppt sample. This is a five stage process. The stages in this process are analysis techniques pareto analysis.
-
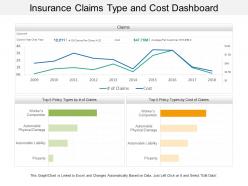 Insurance claims type and cost dashboard
• Stunning match of topic and visuals. • Professional proficiency and brilliant craftsmanship. • Ease of personalization. • Ease of customization with desired contents. • Special assistance to execute the changes has been provided. • Compatibility with multiple numbers of formats. • Compatibility with numerous software options available both online and offline. • High resolution • Used by marketing and business professionals, students and teachers.
-
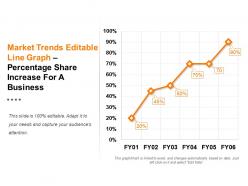 Market trends editable line graph percentage share increase for a business ppt design
Presenting market trends editable line graph percentage share increase for a business ppt design. This is a market trends editable line graph percentage share increase for a business ppt design. This is a six stage process. The stages in this process are business, finance, bar graph, marketing, management.
-
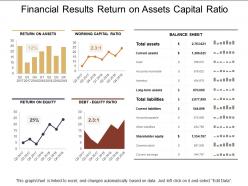 Financial results return on assets capital ratio
Sharing financial results return on assets capital ratio presentation slide. PowerPoint design can be downloaded and save into JPG and PDF format. PPT template can be downloaded in standard and widescreen view. Fully compliant slide design with Google slides. Easy to edit as color, text and font can be amended. Perfect to share business communication as pixels don’t break even when shared on large screen. Presentation graphic can be accessed with different nodes and stages.
-
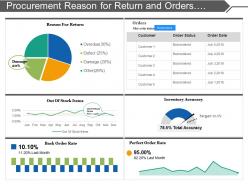 Procurement reason for return and orders detail dashboard
Presenting this set of slides with name - Procurement Reason For Return And Orders Detail Dashboard. This is a six stage process. The stages in this process are Purchase, Procurement, Buy.
-
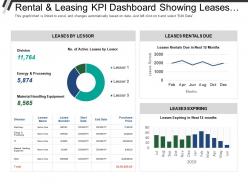 Rental and leasing kpi dashboard showing leases expiring leases by lessor
Presenting this set of slides with name - Rental And Leasing Kpi Dashboard Showing Leases Expiring Leases By Lessor. This is a four stage process. The stages in this process are Rental And Leasing, Dealing And Leasing, Rental And Engage.
-
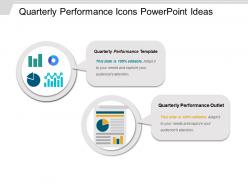 Quarterly performance icons powerpoint ideas
Presenting quarterly performance icons PowerPoint ideas. This PPT template has an ample amount of space to put in titles and subtitles. This slide offers high resolution based presentation which does not change the image even after resizing. This presentation icon is completely compatible with Google Slides. Quick downloading speed and simple editing options in color text and fonts.PPT icons can easily be changed into JPEG and PDF applications. This diagram has been designed for entrepreneurs, corporate and business managers.
-
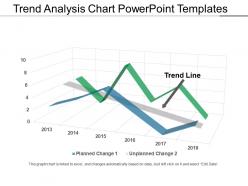 Trend analysis chart powerpoint templates
Presenting a PowerPoint slide named Trend Analysis Chart PowerPoint Templates. Create a compelling presentation with this PPT diagram, which is both professional and editable. Customize colors, choose font styles, and size. You can choose from a wide variety of icons. Resize and scale the images to fit any content. The PPT slide is compatible with Google Slides and can be fetched at once. You can save it as both PDF and JPG formats. This PPT slide is data-driven and can be linked to Excel sheet.
-
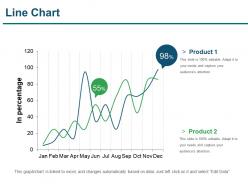 Line chart ppt infographic template
Presenting line chart ppt infographic template. This is a line chart ppt infographic template . This is a two stage process. The stages in this process are line chart, finance, marketing, analysis, business.
-
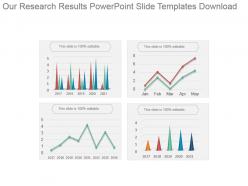 Our research results powerpoint slide templates download
Presenting our research results powerpoint slide templates download. This is a our research results powerpoint slide templates download. This is a four stage process. The stages in this process are business, management, presentation, finance, marketing.
-
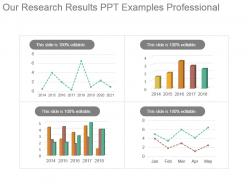 Our research results ppt examples professional
Presenting our research results ppt examples professional. This is a our research results ppt examples professional. This is a four stage process. The stages in this process are business, management, presentation, finance, marketing.
-
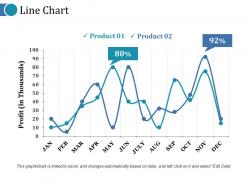 Line chart ppt microsoft
Introducing our Line Chart PPT slide. This is a completely adaptable PPT slide that allows you to add images, charts, icons, tables, and animation effects according to your requirements. Create and edit your text in this 100% customizable slide. It is also available in widescreen. You can change the orientation of any element in your presentation according to your liking. The slide is available in both 4:3 and 16:9 aspect ratio. These PPT slides are also compatible with Google slides.
-
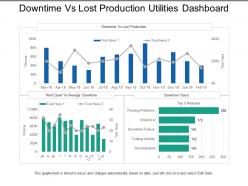 Downtime vs lost production utilities dashboard
Presenting this set of slides with name - Downtime Vs Lost Production Utilities Dashboard. This is a three stage process. The stages in this process are Utilities, Use, Advantage.
-
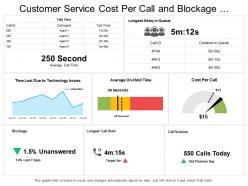 Customer service cost per call and blockage dashboard
This layout slide is completely flexible with Google Slide. You can alter the shading, content style, text dimension of the layout content according to require. The layout is anything but difficult to download and can be spared in PDF, and JPEG designs. For direction, extra instructional slides are accessible. Unrivalled quality illustrations are utilized. The nature of the slide picture does not obscure when seen on a huge screen. Sham substance can be supplanted with other important data. You can customize the format by including your organization name, and mark.
-
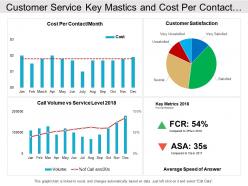 Customer service key mastics and cost per contact dashboard
Introducing customer service key mastics and cost per contact dashboard PowerPoint design. This template design is fully compatible with Google Slide. You can modify the color, text style, font size of the template as per requirement. The slide is simple to download and can be saved in PDF, and JPEG formats. Additional instructional slides are provided for guidance. Best quality graphics are employed. The graphics of the slide does not distort when projected on a large screen. Content can be added with other valuable data. You can personalize the template by adding your organization name, and copyright.
-
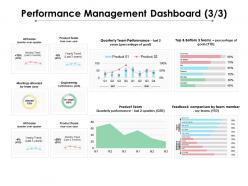 Performance management dashboard 3 3 ppt powerpoint presentation show background images
Presenting this set of slides with name - Performance Management Dashboard 3 3 Ppt Powerpoint Presentation Show Background Images. This is a four stage process. The stages in this process are Finance, Business, Marketing, Management, Analysis.
-
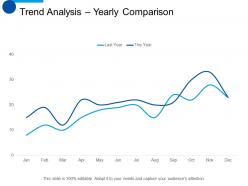 Trend analysis yearly comparison ppt professional format
Presenting this set of slides with name - Trend Analysis Yearly Comparison Ppt Professional Format. This is a two stage process. The stages in this process are Finance, Analysis, Business, Investment, Marketing.
-
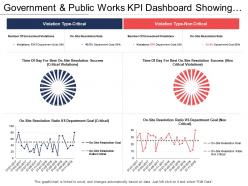 Government and public works kpi dashboard showing violation type and departmental goals
Presenting this set of slides with name - Government And Public Works Kpi Dashboard Showing Violation Type And Departmental Goals. This is a four stage process. The stages in this process are Government And Public Works, Government And Public Tasks.
-
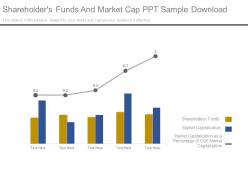 Shareholders funds and market cap ppt sample download
Presenting shareholders funds and market cap ppt sample download. This is a shareholders funds and market cap ppt sample download. This is a five stage process. The stages in this process are shareholders funds, market capitalization, market capitalization as a percentage of cse market capitalization.
-
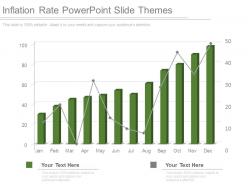 Inflation rate powerpoint slide themes
Presenting inflation rate powerpoint slide themes. This is a inflation rate powerpoint slide themes. This is a twelve stage process. The stages in this process are business, growth, strategy, management, success.
-
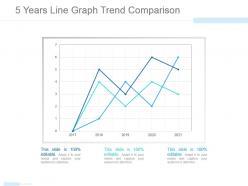 5 years line graph trend comparison powerpoint presentation
Presenting 5 years line graph trend comparison powerpoint presentation. This is a 5 years line graph trend comparison powerpoint presentation. This is a three stage process. The stages in this process are year, planning, business, marketing, success.
-
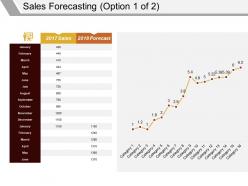 Sales forecasting powerpoint slide template
Presenting the Sales Forecasting Powerpoint Slide Template. This PPT presentation is Google Slides compatible hence it is easily accessible. You can download and save this PowerPoint layout in different formats like PDF, PNG, and JPG. This PPT theme is available in both 4:3 and 16:9 aspect ratios. This PowerPoint template is customizable so you can modify the font size, font type, color and shapes as per your requirements.
-
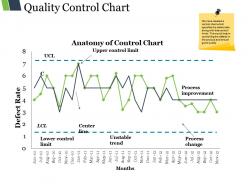 Quality control chart powerpoint topics
Presenting quality control chart powerpoint topics. This is a quality control chart powerpoint topics. This is a two stage process. The stages in this process are anatomy of control chart, upper control limit, defect rate, unstable trend, process change, lower control limit.


