- Sub Categories
-
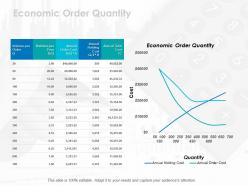 Economic order quantity ppt icon brochure
Presenting this set of slides with name - Economic Order Quantity Ppt Icon Brochure. This is a three stage process. The stages in this process are Business, Management, Strategy, Analysis, Icons.
-
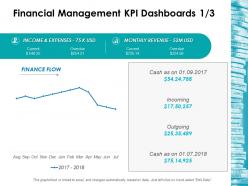 Financial management kpi dashboards 1 3 ppt inspiration structure
Presenting this set of slides with name - Financial Management Kpi Dashboards 1 3 Ppt Inspiration Structure. This is a four stage process. The stages in this process are Business, Management, Strategy, Analysis, Marketing.
-
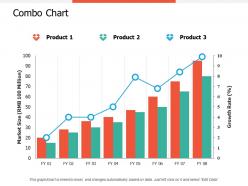 Combo chart finance ppt professional guidelines
Presenting this set of slides with name - Combo Chart Finance Ppt Professional Guidelines. This is a three stage process. The stages in this process are Combo Chart, Finance, Analysis, Business, Investment.
-
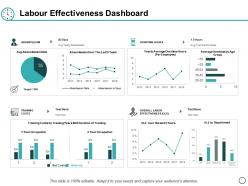 Labour effectiveness dashboard ppt powerpoint presentation diagram lists
Presenting this set of slides with name - Labour Effectiveness Dashboard Ppt Powerpoint Presentation Diagram Lists. This is a four stages process. The stages in this process are Bar Graph, Finance, Marketing, Business, Analysis.
-
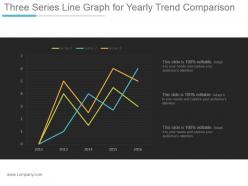 Three series line graph for yearly trend comparison ppt background images
Presenting three series line graph for yearly trend comparison ppt background images. This is a three series line graph for yearly trend comparison ppt background images. This is a three stage process. The stages in this process are series.
-
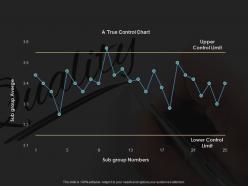 Control charts ppt styles infographic template
This is a two stage process. The stages in this process are Management, Marketing, Business, Percentage, Product.
-
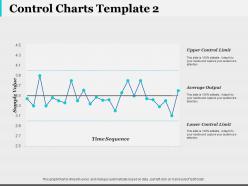 Control charts finance ppt infographic template infographic template
This is a three stage process. The stages in this process are Finance, Analysis, Business, Investment, Marketing.
-
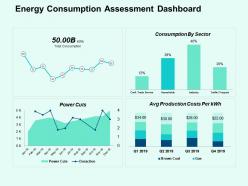 Energy consumption assessment dashboard ppt powerpoint presentation file summary
Presenting this set of slides with name - Energy Consumption Assessment Dashboard Ppt Powerpoint Presentation File Summary. This is a four stage process. The stages in this process are Business, Management, Marketing, Percentage, Product.
-
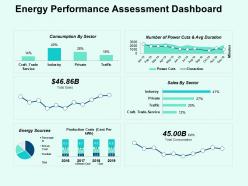 Energy performance assessment dashboard ppt powerpoint presentation file background
Presenting this set of slides with name - Energy Performance Assessment Dashboard Ppt Powerpoint Presentation File Background. This is a five stage process. The stages in this process are Business, Management, Marketing, Percentage, Product.
-
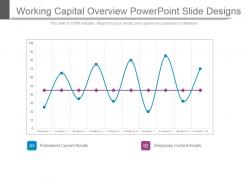 Working capital overview powerpoint slide designs
Presenting working capital overview powerpoint slide designs. This is a working capital overview powerpoint slide designs. This is a two stage process. The stages in this process are permanent current assets, temporary current assets.
-
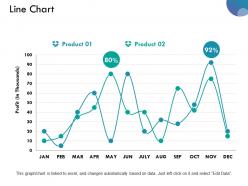 Line chart powerpoint slide show powerpoint slide
Introducing line chart PowerPoint slide. Creatively designed PPT visual is well-known with Google slides. Flexible as can be vary into PDF or JPEG formats. Ready to use and easy to download presentation design saves time and effort. PowerPoint template is achievable in standard and widescreen display. Some elements can be modified as the presentation graphic is fully adaptable. Quick to download and share with viewers. PPT diagram comes with different nodes and stages.
-
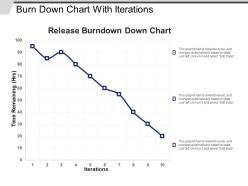 Burn down chart with iterations
Presenting this set of slides with name - Burn Down Chart With Iterations. This is a three stage process. The stages in this process are Burn Down Chart, Agile Software Development Chart, Run Chart.
-
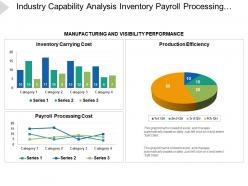 Industry capability analysis inventory payroll processing production efficiency
PPT design is downloadable into various formats such as JPEG or PDF formats. Design can be easily edited by anyone; no specific knowledge is required to edit this slide. The slide is linked to excel; you need to put figures on excel sheet and changes will automatically reflect in slideshow. Design can be opened and edited with Google Slides and MS PowerPoint software. Slides are supported on full screen and standard view.
-
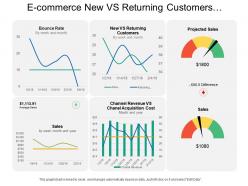 E commerce new vs returning customers dashboard
Presenting this set of slides with name - E Commerce New Vs Returning Customers Dashboard. This is a six stage process. The stages in this process are Mercantilism, Commercialism, Ecommerce.
-
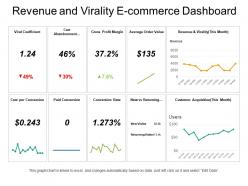 Revenue and virality e commerce dashboard
Presenting this set of slides with name - Revenue And Virality E Commerce Dashboard. This is a ten stage process. The stages in this process are Mercantilism, Commercialism, Ecommerce.
-
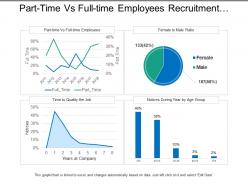 Part time vs full time employees recruitment dashboard
Presenting this set of slides with name - Part Time Vs Full Time Employees Recruitment Dashboard. This is a four stage process. The stages in this process are Staffing Plan, Recruitment, Staff Management.
-
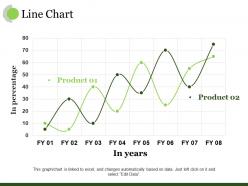 Line chart ppt example
Presenting Line Chart PPT Example. Modify the font type, size, diagram or background color and other attributes. The slide is compatible with MS PowerPoint and other office software. The template is also compatible with Google Slides and can be saved in numerous images or document formats like JPEG or PDF without any hassle. Moreover, the slide supports both the standard screen (4:3) and widescreen(16:9) sizes to ensure that pixelation does not occur.
-
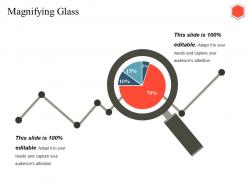 Magnifying glass ppt gallery
Presenting this set of slides with name - Magnifying Glass Ppt Gallery. This is a four stage process. The stages in this process are Magnifying Glass, Growth, Search, Business, Management.
-
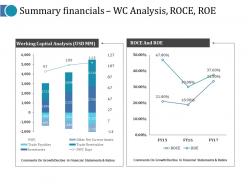 Summary financials wc analysis roce roe ppt model smartart
Presenting this set of slides with name - Summary Financials Wc Analysis Roce Roe Ppt Model Smartart. This is a two stage process. The stages in this process are Roce And Roe, Working Capital Analysis, Trade Payables, Inventories, Trade Receivables.
-
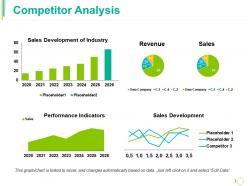 Competitor analysis ppt guide
Presenting this set of slides with name - Competitor Analysis Ppt Guide. This is a four stage process. The stages in this process are Development Of Industry, Revenue, Sales, Sales Development, Performance Indicators.
-
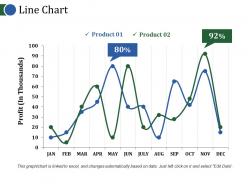 Line chart ppt background
Presenting this set of slides with name - Line Chart Ppt Background. This is a two stage process. The stages in this process are Line Chart, Growth, Strategy, Analysis, Business.
-
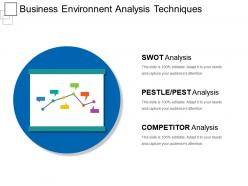 Business environment analysis techniques powerpoint graphics
Presenting business environment analysis techniques PowerPoint graphics PPT slide. You can download this infographic business environment template and save it into JPEG format or PDF format. Get this fully customizable slide in which you can change anything as per your wants. This can be downloaded in 2 screen sizes i.e. standard screen and widescreen. Its high resolution graphics do not pixelate when viewed on widescreen. Add the related data in text placeholder and customize it in the way you like.
-
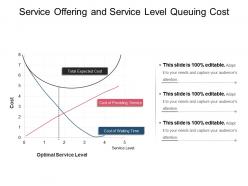 Service offering and service level queuing cost ppt summary
Presenting service offering and service level queuing cost PPT summary PowerPoint presentation which is 100% editable. The PPT is data driven that is excel-linked and easy with modifications and all the features used in this PowerPoint presentation are compatible with Google Slides, multiple format and software options. This PPT is easy to download in a very short span of time. In case of any assistance, the presenter may refer to presentation designs services being provided along with this PowerPoint presentation. This PPT slide can be saved as JPG or in pdf format.
-
 Product demand forecast ppt slide styles
Presenting Product Demand Forecast PPT Slide Styles. Made up of high-resolution graphics. Easy to download and can be saved in a variety of formats. Access to open on a widescreen preview. Compatible with the Google Slides and PowerPoint software. Edit the style, size, and the background of the slide icons as per your needs. Useful for business owners, students, and managers. Can be viewed on standard screen and widescreen without any fear of pixelation.
-
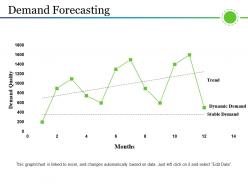 Demand forecasting powerpoint images
Presenting Demand Forecasting PowerPoint Images template. The layout is 100% customizable in PowerPoint and other related office suites. You are free to alter the font type, size, and slide colors and other attributes. The layout is also compatible with Google Slides and can be saved in common image or document formats such as JPG or PDF. High-quality graphics and icons ensure that picture quality remains the same even when the user enlarges their size.
-
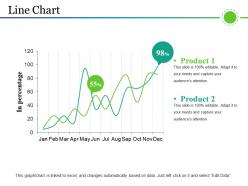 Line chart powerpoint slide design ideas
Presenting Line Chart PowerPoint Slide Design Ideas. Modify the slide as per your requirements. You can save this slide in PDF, JPEG and PNG formats without any problem. The template is having compatibility with Google Slides. High-quality graphics ensure that original quality is always retained. Available in both standard screen and widescreen ratios
-
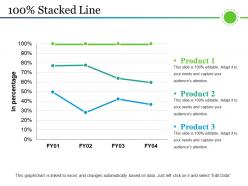 Stacked line ppt background designs
Presenting stacked line ppt background designs. This is a stacked line ppt background designs. This is a three stage process. The stages in this process are line, business, success, marketing, graph.
-
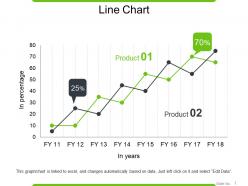 Line chart powerpoint slide clipart
Presenting line chart powerpoint slide clipart. This is a line chart powerpoint slide clipart. This is a two stage process. The stages in this process are line chart, growth, analysis, business, marketing.
-
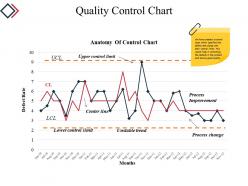 Quality control chart powerpoint slide background image
Presenting quality control chart powerpoint slide background image. This is a quality control chart powerpoint slide background image. This is a two stage process. The stages in this process are line, business, marketing, strategy, planning.
-
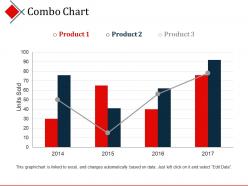 Combo chart powerpoint slides templates
Presenting combo chart powerpoint slides templates. This is a combo chart powerpoint slides templates. This is a four stage process. The stages in this process are units sold, combo chart, product, years, planning.
-
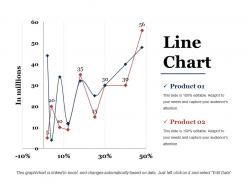 Line chart ppt example professional
Presenting this set of slides with name - Line Chart Ppt Example Professional. This is a two stage process. The stages in this process are Business, Marketing, Finance, Strategy, Growth.
-
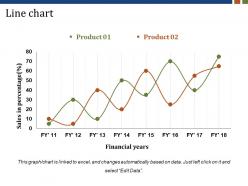 Line chart powerpoint show
Presenting Line Chart PowerPoint Show. This easy to download PPT theme can be easily opened and saved in various formats like JPG, PDF, and PNG. You can alter the font size, font type, font color, and shape used according to your needs as this PPT layout is 100% customizable. This PowerPoint template is Google Slides compatible and is easily accessible.
-
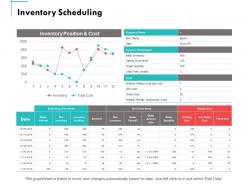 Inventory scheduling ppt powerpoint presentation summary guide
Presenting this set of slides with name - Inventory Scheduling Ppt Powerpoint Presentation Summary Guide. This is a three stages process. The stages in this process are Finance, Marketing, Management, Investment, Analysis.
-
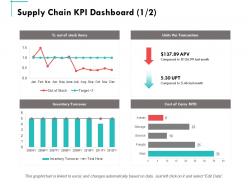 Supply chain kpi dashboard management ppt powerpoint presentation summary graphics tutorials
Presenting this set of slides with name - Supply Chain Kpi Dashboard Management Ppt Powerpoint Presentation Summary Graphics Tutorials. This is a four stages process. The stages in this process are Finance, Marketing, Management, Investment, Analysis.
-
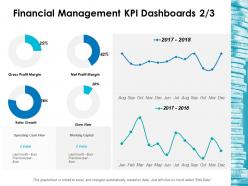 Financial management kpi dashboards 2 3 ppt inspiration vector
Presenting this set of slides with name - Financial Management Kpi Dashboards 2 3 Ppt Inspiration Vector. This is a four stage process. The stages in this process are Business, Management, Strategy, Analysis, Marketing.
-
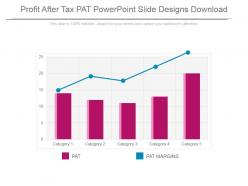 Profit after tax pat powerpoint slide designs download
Presenting profit after tax pat powerpoint slide designs download. This is a profit after tax pat powerpoint slide designs download. This is a five stage process. The stages in this process are pat, pat margins, category.
-
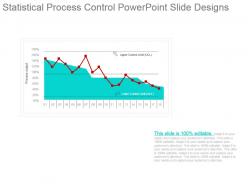 Statistical process control powerpoint slide designs
Presenting statistical process control powerpoint slide designs. This is a statistical process control powerpoint slide designs. This is a one stage process. The stages in this process are process output, upper control limit, lower control limit.
-
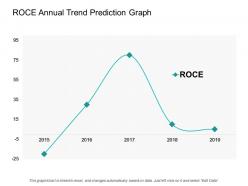 Roce annual trend prediction graph
Presenting this set of slides with name - Roce Annual Trend Prediction Graph. This is a one stages process. The stages in this process are ROCE, Return On Capital Employed, Accounting Ratio.
-
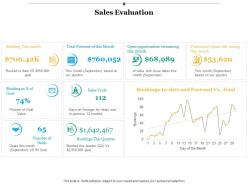 Sales evaluation sales cycle ppt infographics example introduction
Presenting this set of slides with name - Sales Evaluation Sales Cycle Ppt Infographics Example Introduction. This is a nine stage process. The stages in this process are Finance, Analysis, Business, Investment, Marketing.
-
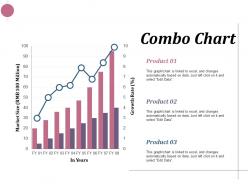 Combo chart business finance ppt infographics example introduction
Presenting this set of slides with name - Combo Chart Business Finance Ppt Infographics Example Introduction. This is a three stage process. The stages in this process are Combo Chart, Finance, Analysis, Business, Investment.
-
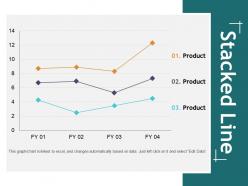 Stacked line ppt show structure
Presenting this set of slides with name - Stacked Line Ppt Show Structure. This is a three stage process. The stages in this process are Business, Management, Strategy, Analysis, Icons.
-
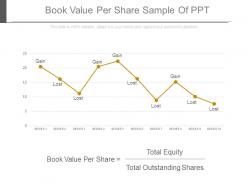 Book value per share sample of ppt
Presenting book value per share sample of ppt. This is a book value per share sample of ppt. This is a one stage process. The stages in this process are gain, lost, total equity, total outstanding shares, book value per share.
-
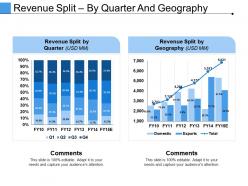 Revenue split by quarter and geography example of great ppt
Presenting this set of slides with name - Revenue Split By Quarter And Geography Example Of Great Ppt. This is a two stage process. The stages in this process are Finance, Marketing, Bar, Planning, Growth.
-
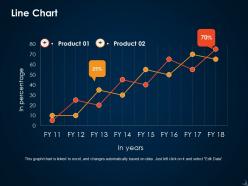 Line chart ppt icon graphics
Presenting this set of slides with name - Line Chart Ppt Icon Graphics. This is a two stage process. The stages in this process are Business, Marketing, In Percentage, In Years, Finance.
-
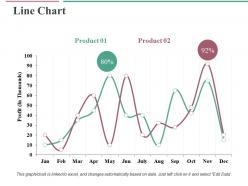 Line chart ppt professional graphics tutorials
Presenting this set of slides with name - Line Chart Ppt Professional Graphics Tutorials. This is a two stage process. The stages in this process are Line Chart, Marketing, Strategy, Planning, Finance.
-
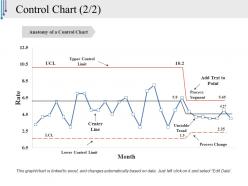 Control chart ppt styles example topics
Presenting this set of slides with name - Control Chart Ppt Styles Example Topics. This is a two stage process. The stages in this process are Line Chart, Marketing, Strategy, Planning, Finance.
-
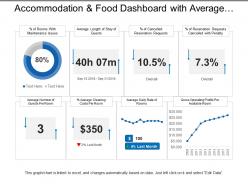 Accommodation and food dashboard with average cleaning cost
Presenting this set of slides with name - Accommodation And Food Dashboard With Average Cleaning Cost. This is a eight stage process. The stages in this process are Accommodation And Food, Shelter And Food, Accommodation And Beverages.
-
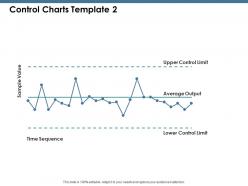 Control charts ppt slides example introduction
This is a five stage process. The stages in this process are Sample Value, Upper Control Limit, Time Sequence.
-
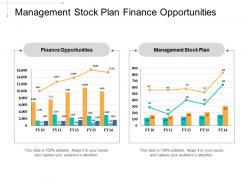 Management stock plan finance opportunities presentation solution predictive analytics cpb
This is an editable two stages graphic that deals with topics like Management Stock Plan, Finance Opportunities, Presentation Solution, Predictive Analytics to help convey your message better graphically. This product is a premium product available for immediate download, and is 100 percent editable in Powerpoint. Download this now and use it in your presentations to impress your audience.
-
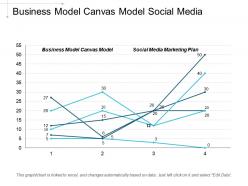 Business model canvas model social media marketing plan cpb
This is an editable four stages graphic that deals with topics like Business Model Canvas Model, Social Media Marketing Plan to help convey your message better graphically. This product is a premium product available for immediate download, and is 100 percent editable in Powerpoint. Download this now and use it in your presentations to impress your audience.
-
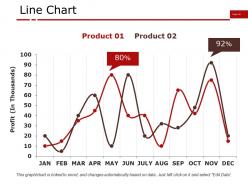 Line chart presentation powerpoint example
Presenting line chart presentation powerpoint example. Presenting line chart presentation powerpoint example. This is a line chart presentation powerpoint example. This is a two stage process. The stages in this process are profit, business, marketing, percentage, chart.
-
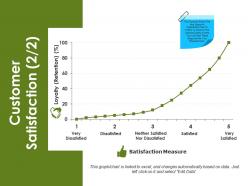 Customer satisfaction powerpoint slide clipart
Presenting customer satisfaction powerpoint slide clipart. This is a customer satisfaction powerpoint slide clipart. This is a one stage process. The stages in this process are growth, marketing, planning, finance, success.
-
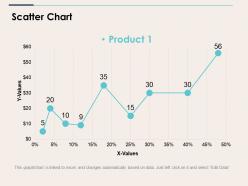 Scatter chart ppt outline
Presenting this set of slides with name - Scatter Chart Ppt Outline. This is a one stage process. The stages in this process are Business, Marketing, Percentage, Chart, Growth.
-
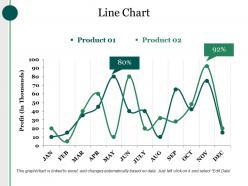 Line chart powerpoint slide template
Presenting this set of slides with name - Line Chart Powerpoint Slide Template. This is a two stage process. The stages in this process are Profit, Growth, Business, Success, Product.
-
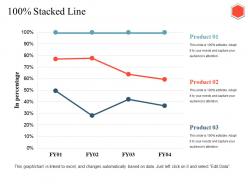 Stacked line ppt guidelines
Presenting this set of slides with name - Stacked Line Ppt Guidelines. This is a three stage process. The stages in this process are Stacked Line, Business, Finance, Analysis, Management.
-
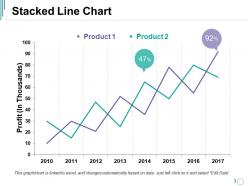 Stacked line chart ppt background
Presenting this set of slides with name - Stacked Line Chart Ppt Background. This is a two stage process. The stages in this process are Business, Marketing, Graph, Strategy, Growth, Years.
-
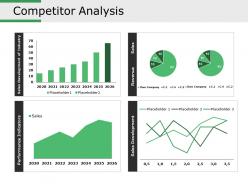 Competitor analysis ppt images gallery
Presenting this set of slides with name - Competitor Analysis Ppt Images Gallery. This is a four stage process. The stages in this process are Business, Finance, Marketing, Strategy, Analysis.
-
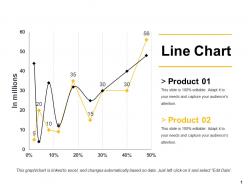 Line chart ppt infographics layout ideas
Presenting this set of slides with name - Line Chart Ppt Infographics Layout Ideas. This is a two stage process. The stages in this process are Line Chart, Analysis, Finance, Marketing, Business, Growth.
-
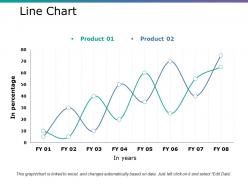 Line chart ppt outline templates
Presenting this set of slides with name - Line Chart Ppt Outline Templates. This is a two stage process. The stages in this process are Product, In Percentage, In Years.
-
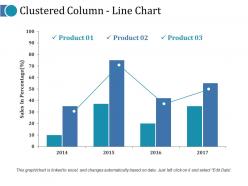 Clustered column line chart ppt infographic template mockup
Presenting this set of slides with name - Clustered Column Line Chart Ppt Infographic Template Mockup. This is a four stage process. The stages in this process are Bar Graph, Growth, Success, Product, Sales In Percentage.


