Financial performance kpi dashboard showing burn rate opex ratio gross profit
Hand down good customs with our Financial Performance Kpi Dashboard Showing Burn Rate Opex Ratio Gross Profit. Familiarize them with your firm beliefs.
- Google Slides is a new FREE Presentation software from Google.
- All our content is 100% compatible with Google Slides.
- Just download our designs, and upload them to Google Slides and they will work automatically.
- Amaze your audience with SlideTeam and Google Slides.
-
Want Changes to This PPT Slide? Check out our Presentation Design Services
- WideScreen Aspect ratio is becoming a very popular format. When you download this product, the downloaded ZIP will contain this product in both standard and widescreen format.
-

- Some older products that we have may only be in standard format, but they can easily be converted to widescreen.
- To do this, please open the SlideTeam product in Powerpoint, and go to
- Design ( On the top bar) -> Page Setup -> and select "On-screen Show (16:9)” in the drop down for "Slides Sized for".
- The slide or theme will change to widescreen, and all graphics will adjust automatically. You can similarly convert our content to any other desired screen aspect ratio.
Compatible With Google Slides

Get This In WideScreen
You must be logged in to download this presentation.
PowerPoint presentation slides
Presenting this set of slides with name - Financial Performance Kpi Dashboard Showing Burn Rate Opex Ratio Gross Profit. This is a four stage process. The stages in this process are Financial Performance, Financial Report, Financial Review.
People who downloaded this PowerPoint presentation also viewed the following :
Content of this Powerpoint Presentation
Description:
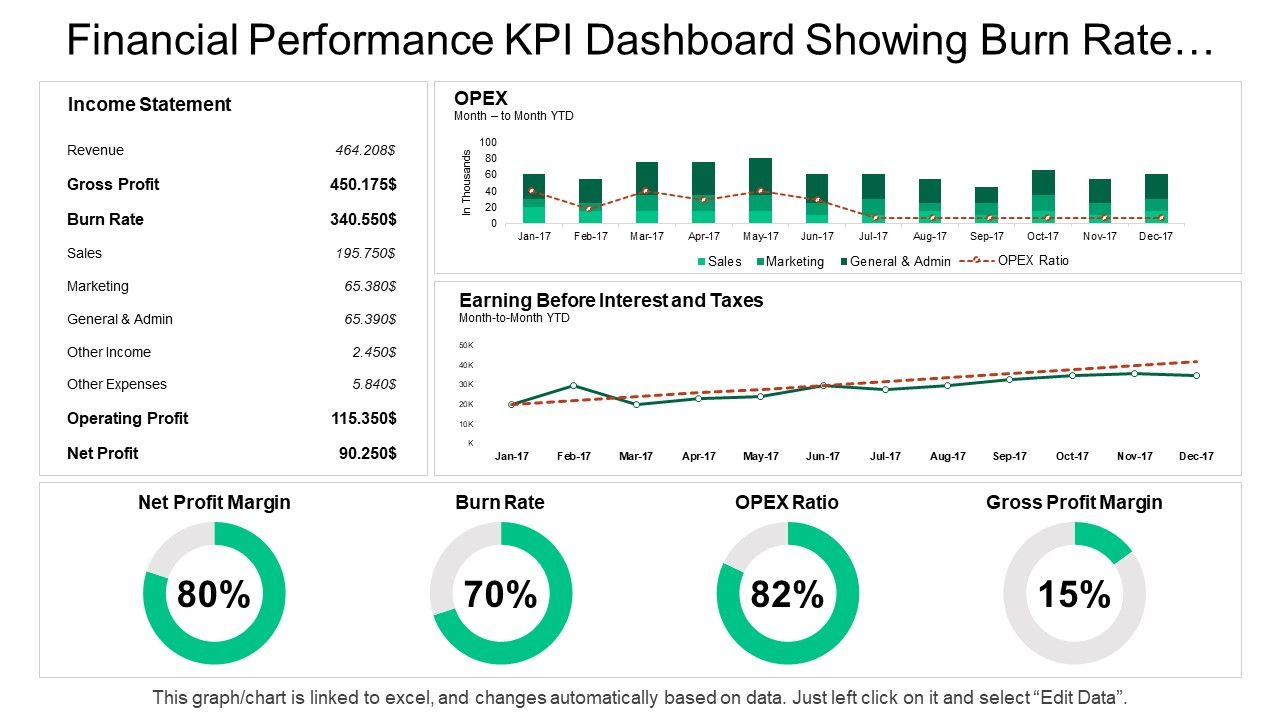
The image is a PowerPoint slide titled "Financial Performance KPI Dashboard Showing Burn Rate." It is a comprehensive snapshot of a company's financial metrics over time. This dashboard is designed to provide a quick overview of key performance indicators (KPIs) crucial for financial analysis and decision-making. The slide is divided into several sections:
1. Income Statement:
A tabulated representation of the company's financials, including Revenue, Gross Profit, Burn Rate, Sales, Marketing, General & Admin (G&A) expenses, Other Income, Other Expenses, Operating Profit, and Net Profit.
2. OPEX (Operational Expenditure):
A bar graph showing month-to-month Year-To-Date (YTD) operational expenses categorized by Sales, Marketing, and G&A, along with an OPEX Ratio trend line.
3. Earning Before Interest and Taxes (EBIT):
A line graph depicting the EBIT trend over the year, allowing for a quick assessment of profitability before accounting for interest and tax expenses.
4. Key Financial Ratios:
Donut charts visualizing Net Profit Margin, Burn Rate, OPEX Ratio, and Gross Profit Margin, each providing a snapshot of the company's financial efficiency and health.
The note at the bottom indicates that the graph/chart is linked to an Excel sheet, allowing for dynamic updating of the data presented.
Use Cases:
This type of slide can be used in various industries:
1. Technology:
Use: Tracking financial health of tech startups.
Presenter: CFO or Financial Analyst.
Audience: Investors, internal management.
2. Manufacturing:
Use: Monitoring operational costs and profitability.
Presenter: Operations Manager.
Audience: Board members, operational team.
3. Healthcare:
Use: Financial oversight in hospital management.
Presenter: Healthcare Administrator.
Audience: Hospital board, department heads.
4. Retail:
Use: Assessing store performance and profit margins.
Presenter: Retail Chain Manager.
Audience: Store managers, shareholders.
5. Consulting:
Use: Demonstrating financial KPIs to advisory clients.
Presenter: Management Consultant.
Audience: Client leadership teams.
6. Energy:
Use: Evaluating cost structures in energy projects.
Presenter: Energy Analyst.
Audience: Investors, regulatory bodies.
7. Non-Profit:
Use: Reporting financial status to donors and trustees.
Presenter: Non-profit Treasurer.
Audience: Donors, board members, regulatory agencies.
Financial performance kpi dashboard showing burn rate opex ratio gross profit with all 6 slides:
Get on track with our Financial Performance Kpi Dashboard Showing Burn Rate Opex Ratio Gross Profit. They will put you on the correct path.
-
Helpful product design for delivering presentation.
-
Very well designed and informative templates.


