Mining oil and gas extraction kpi dashboard showing crude production and natural gas
Decipher the code for your audience. Divulge the contents on our Mining Oil And Gas Extraction Kpi Dashboard Showing Crude Production And Natural Gas.
- Google Slides is a new FREE Presentation software from Google.
- All our content is 100% compatible with Google Slides.
- Just download our designs, and upload them to Google Slides and they will work automatically.
- Amaze your audience with SlideTeam and Google Slides.
-
Want Changes to This PPT Slide? Check out our Presentation Design Services
- WideScreen Aspect ratio is becoming a very popular format. When you download this product, the downloaded ZIP will contain this product in both standard and widescreen format.
-

- Some older products that we have may only be in standard format, but they can easily be converted to widescreen.
- To do this, please open the SlideTeam product in Powerpoint, and go to
- Design ( On the top bar) -> Page Setup -> and select "On-screen Show (16:9)” in the drop down for "Slides Sized for".
- The slide or theme will change to widescreen, and all graphics will adjust automatically. You can similarly convert our content to any other desired screen aspect ratio.
Compatible With Google Slides

Get This In WideScreen
You must be logged in to download this presentation.
PowerPoint presentation slides
Presenting this set of slides with name - Mining Oil And Gas Extraction Kpi Dashboard Showing Crude Production And Natural Gas. This is a four stage process. The stages in this process are Mining, Oil And Gas Extraction, Refinery, Natural Gas.
People who downloaded this PowerPoint presentation also viewed the following :
Content of this Powerpoint Presentation
Description:
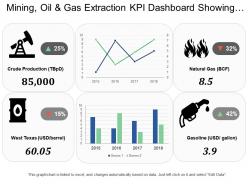
The image presents a KPI (Key Performance Indicator) dashboard for the Mining, Oil & Gas Extraction industry. It provides a visual representation of various critical metrics and their changes over time. Here are the key components:
1. Crude Production (TBpD):
Represented by an oil rig icon, this metric indicates a 25% decrease, with an output of 85,000 Thousand Barrels per Day (TBpD).
2. Natural Gas (BCF):
Depicted with flames, it signifies a 32% reduction in output, measured in Billion Cubic Feet (BCF), totaling 8.5 BCF.
3. West Texas (USD/barrel):
Displayed with an oil barrel icon, it highlights a 15% drop in the price of West Texas oil, down to $60.05 per barrel.
4. Line Graph (Top Center):
This graph displays a fluctuating trend over four years without specific units labeled along the Y-axis.
5. Bar Graph (Bottom Center):
Again, the bar graph contrasts two data series across four years without specifying the exact metrics.
6. Gasoline (USD/gallon):
Featured with a fuel pump icon, it indicates a 42% increase in price to $3.9 per gallon.
The note at the bottom of the image indicates that the graph or chart is linked to Excel and updates automatically based on data. Users can edit the data by clicking on the chart and selecting 'Edit Data.'
Use Cases:
This versatile dashboard can find applications in various industries and sectors:
1. Energy Trading:
Use: Analyzing commodity price trends and production volumes.
Presenter: Market Analyst.
Audience: Traders and Investment Managers.
2. Energy Policy:
Use: Monitoring energy production and adjusting policy measures.
Presenter: Policy Advisor.
Audience: Government Officials.
3. Investment Banking:
Use: Evaluating investment opportunities in the energy sector.
Presenter: Investment Banker.
Audience: Clients and Institutional Investors.
4. Market Research:
Use: Generating industry reports and market insights.
Presenter: Market Research Analyst.
Audience: Research Subscribers and Industry Stakeholders.
5. Oil & Gas Production:
Use: Tracking operational performance and market dynamics.
Presenter: Operations Manager.
Audience: Company Executives and Shareholders.
6. Commodities Consulting:
Use: Advising on commodities markets and business strategy.
Presenter: Commodities Consultant.
Audience: Business Clients.
7. Education and Training:
Use: Teaching students about energy markets and business analytics.
Presenter: Educator or Trainer.
Audience: Students and Professionals in Training.
Mining oil and gas extraction kpi dashboard showing crude production and natural gas with all 6 slides:
Jockey for the edge with our Mining Oil And Gas Extraction Kpi Dashboard Showing Crude Production And Natural Gas. Immediately establish a decisive advantage.
-
Awesome presentation, really professional and easy to edit.
-
Unique and attractive product design.


