- Sub Categories
-
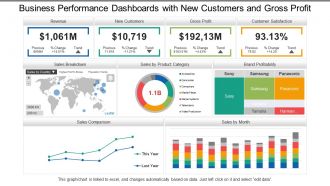 Business Performance Dashboards Snapshot With New Customers And Gross Profit
Presenting, business performance dashboards Snapshot with new customers and gross profit PowerPoint ideas for your ease. Information based slides, creating an impact on the viewer, can be used by specialists from any background, entrepreneurs, and scholars. Engaging and editable font style, type, text design and the content of the icons or the PPT slides. Full-screen view choice available and can be transformed into the desired format. Compatible with Google Slides. Open in widescreen size 16:9 after downloading.
-
 Meet our team representing in circular format
Presenting, meet our team representing in a circular format PPT design. This PPT slide contains visually engaging PPT presentation diagrams, which are loaded with incomparable benefits and can be utilized for displaying your team. Change the colors schemes used here, include your employee images and personalize. This design can be personalized by appending company trademark, logo, brand, symbols. Well-arranged patterns to avoid any confusion or uncertainty. These PPT slides can be instantly downloaded with just a click
-
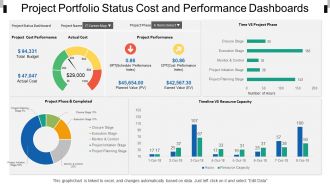 Project portfolio status cost and performance dashboards snapshot
Presenting, project portfolio status cost and performance dashboards snapshot. This is an appealing design for project portfolio status cost and performance focused PowerPoint presentation. This PPT template can be used by experts from various backgrounds to present their ideas in a contemporary way. This slide is cooperative with google slides and after downloading you can use it in full version and insert your company's logo for your best practice. Unique thinking to mesmerize your audience. Fully editable PowerPoint colors, orientation, text, and graphics.
-
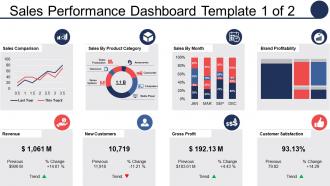 Sales performance dashboard sales comparison sales by product category
Introducing sales performance dashboard sales comparison sales by product category PPT design. Tailor the design with trade name, icon and even tagline. Fast download and easy to convert into JPG and PDF. Alternative to share presentation diagram in standard and widescreen display view. High quality PowerPoint slide comes with editable options as color, text and font can be edited at any stage. PowerPoint graphic is available with different nodes and stages.
-
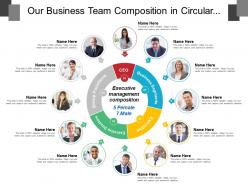 Our business team composition in circular format
Presenting this set of slides with name - Our Business Team Composition In Circular Format. This is a two stage process. The stages in this process are Our Team, Our Group, Our Members.
-
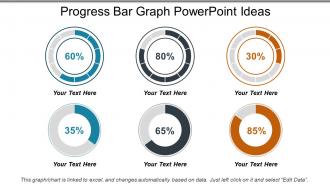 Progress bar graph powerpoint ideas
Presenting the slide named Progress Bar Graph PowerPoint Ideas. This template is professionally designed and is completely editable. The font color, font size, font style, background color and the color of the diagram can be altered as per your suitability. The text in the template can be replaced with your desired content. The slide is compatible with Google Slides and can be easily saved in JPG or PDF format. You can customize the template conveniently by changing the data in the excel sheet, as this template is Excel-linked.
-
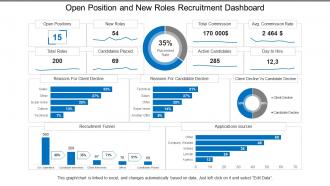 Open position and new roles recruitment dashboard
Presenting this set of slides with name - Open Position And New Roles Recruitment Dashboard. This is a three stage process. The stages in this process are Staffing Plan, Recruitment, Staff Management.
-
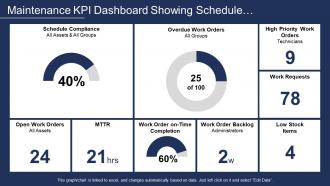 Maintenance kpi dashboard showing schedule compliance and mttr
Presenting this set of slides with name - Maintenance Kpi Dashboard Showing Schedule Compliance And Mttr. This is a nine stage process. The stages in this process are Maintenance, Preservation, Conservation.
-
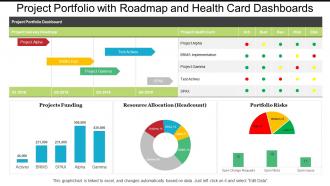 Project portfolio with roadmap and health card dashboards
Presenting, project portfolio with roadmap and health card dashboards. This Design possesses a construction that not only has a high market need but also displays clear judgment about the details and concept of the organization. It is obvious that there are various risks involved in a new business process so selecting an active medium to propose the message and other learning is very vital. These PPT designs have an addition to the advantage that these are pre-designed which makes it even more convenient for the new business.
-
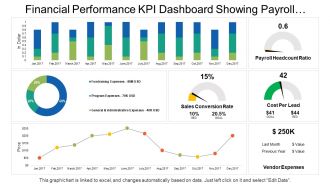 Financial performance kpi dashboard showing payroll headcount ratio cost per lead
Presenting this set of slides with name - Financial Performance Kpi Dashboard Showing Payroll Headcount Ratio Cost Per Lead. This is a seven stage process. The stages in this process are Financial Performance, Financial Report, Financial Review.
-
 Four key metrics donut chart with percentage
This key performance indicator presentation slide can easily be downloaded from our web page. The design is 100% editable; you can modify and customize the design according to your business needs. All the design elements such as font, type, color, size, images, shape, style, background is completely editable. Design is fully supported on standard and full screen view; no compromise with design quality on full screen view.
-
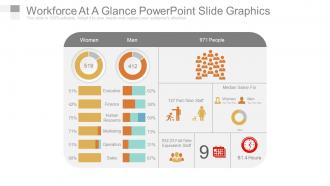 Workforce at a glance powerpoint slide graphics
Presenting this workforce analysis and planning PowerPoint presentation slide. The PPT slide is available in both widescreen size (16:9) and standard screen size (4:3). This template has been designed by our team of qualified designers and is editable in PowerPoint. You can change the font type, font size, font style, icons and background color of the slide as per your requirement. It is convenient to insert your company name and logo in the slide. You can remove the sample content in text placeholders and add your presentation’s content. The slide is fully compatible with Google slides and can be saved in JPG or PDF format easily. High resolution graphic image ensures that there is no deterioration in quality on enlarging the size of the image. You can download the slide quickly at the click of a button.
-
 Project name cost baseline portfolio dashboards
Presenting project name cost baseline portfolio dashboards PPT template. Download is quick and can be easily shared. Conveys a sense of change over time. Suitable for corporate leaders and business associates. Flexible PPT slide as can be used whenever required. PowerPoint design can be shared in Standard and Widescreen view. High quality graphics and visuals used in the PPT. Option to include business content i.e. name, logo and text. Effortless conversion into PDF/ JPG format. Can be easily merged with your ongoing presentation slides.
-
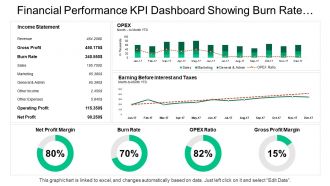 Financial performance kpi dashboard showing burn rate opex ratio gross profit
Presenting this set of slides with name - Financial Performance Kpi Dashboard Showing Burn Rate Opex Ratio Gross Profit. This is a four stage process. The stages in this process are Financial Performance, Financial Report, Financial Review.
-
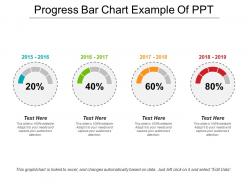 Progress bar chart example of ppt
SlideTeam presents to you Progress Bar Chart Example Of PPT. This PowerPoint presentation can be saved in either PDF or JPG format easily. You can also view the slideshow in standard size display ratio of 4:3 or widescreen display ratio of 16:9. You can make any changes to the pre-designed PPT template, as it is highly customizable. You can also edit the font size, font color and the font style of the text used in the presentation. The slides are also compatible with Google slides.
-
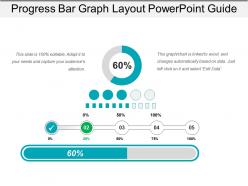 Progress bar graph layout powerpoint guide
Presenting a PPT slide named Progress Bar Graph Layout PowerPoint Guide. You can completely edit this slide as per your requirement. The font color, font size, font style, background color and the color of the diagram are all editable and can be changed. The dummy text in the slide can be rewritten. It’s a data-driven or Excel-linked template and hence can be customized accordingly. A collection of editable and high-quality icons ensures a better design for your presentation. The slide is compatible with Google Slides and can be saved in JPG, JPEG or PDF formats.
-
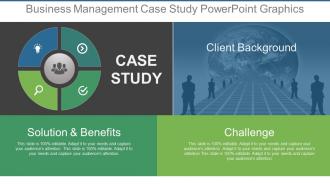 Business management case study powerpoint graphics
Presenting business management case study PowerPoint graphics. It enables the user to modify the presentation as per the business needs. Each icon, clipart and shape can be replaced. You can change size, effects, text color, background color etc to embellish your presentation in a unique way. Fully compatible with Google slides and can be saved into JPG or PDF formats. Download them in widescreen size and standard size.
-
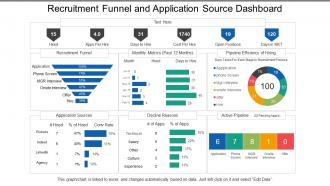 Recruitment funnel and application source dashboard
Presenting this set of slides with name - Recruitment Funnel And Application Source Dashboard. This is a three stage process. The stages in this process are Staffing Plan, Recruitment, Staff Management.
-
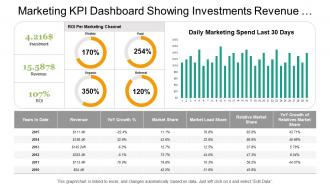 Marketing kpi dashboard showing investments revenue metrics details
Presenting marketing kpi dashboard showing investments revenue metrics details presentation template slide. The PPT template is very user friendly as it allows you to make numerous changes to the editable slides. You can amend the font size, font style and also the font color as per your requirements. Template slide can be downloaded quickly and cab be saved in format of PDF or JPG easily. The template slide after being downloaded can be viewed in large screen display ratio of 16:9 or standard size display ratio of 4:3.
-
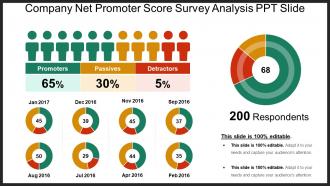 Company net promoter score survey analysis ppt slide
Presenting company net promoter score survey analysis PPT slide Powerpoint presentation which is 100% editable. This PPT template is excel linked i.e. data driven and can easily be customized which enables you to personalize it as per your own criteria. The presentation slide is fully compatible with Google slides, multiple format and software options. In case of any assistance, kindly take instructions from our presentation design services and it is easy to download in a very short span of time. The images, layouts, designs are of high quality and ensures quality in widescreen.
-
 Project name status schedule and management dashboard
Presenting project name status schedule and management dashboard PowerPoint template. Presentation slides are compatible with Google slides. Download is quick and can be easily shared. Conveys a sense of change over time. Suitable for corporate leaders and business associates. Flexible PPT slide as can be used whenever required. PowerPoint design can be shared in Standard and Widescreen view. High quality graphics and visuals used in the PPT. Option to include business content i.e. name, logo and text. Effortless conversion into PDF/ JPG format.
-
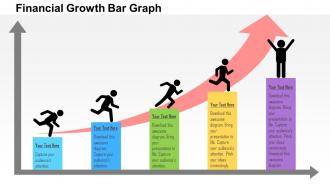 Financial growth bar graph flat powerpoint design
Extremely flexible and adaptable PPT presentation backgrounds. Well recognized and appreciated by numerous profitable organisations. Allows easy conversion into formats such as JPG and PDF to provide extra convenience to the user. Can be completely tailored by any user without any training. Possess high quality patterns and graphics to impress the audience.
-
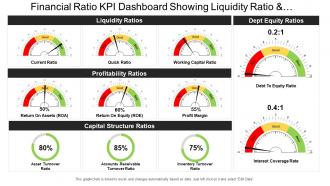 Financial ratio kpi dashboard snapshot showing liquidity ratio and profitability ratio
Presenting this set of slides with name - Financial Ratio Kpi Dashboard Snapshot Showing Liquidity Ratio And Profitability Ratio. This is a three stage process. The stages in this process are Accounting Ratio, Financial Statement, Financial Ratio.
-
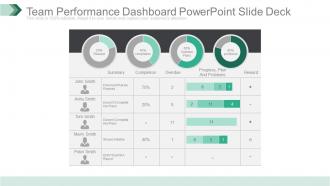 Team performance dashboard powerpoint slide deck
Presenting team performance dashboard powerpoint slide deck. This is a team performance dashboard powerpoint slide deck. This is a four stage process. The stages in this process are completion, overdue plans, problems, summary, completion, overdue, progress, plan and problems, reward.
-
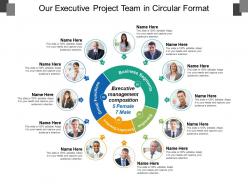 Our executive project team in circular format
• Impressive picture quality. • High resolution slide design. • Well crafted, aesthetically sound and professionally proficient. • Ease of download. • Ease of executing changes in the slide content. • Harmonious with multiple numbers of software options. • Harmonious with numerous slide design software. • Easy to customize and personalize with company specific name, logo and trademark. • Used by company professionals, teachers and students.
-
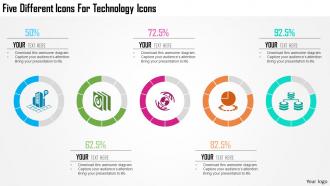 1214 five different icons for technology icons powerpoint template
We are proud to present our 1214 five different icons for technology icons powerpoint template. Five different icons for technology has been used to design this power point template. This PPT contains the concept of technology and success. Display success and technology related topics in your business presentation with this PPT.
-
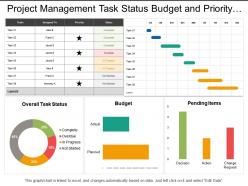 Project management task status budget and priority dashboard
Stunning project management task status budget and priority dashboard PowerPoint template. Choice to display PowerPoint template in standard and widescreen view. Presentation designs are well-suited with Google slides or MS Office PowerPoint programs. Can be transformed into JPG and PDF format. Trouble-free replacement of your company’s logo. Access to open on a big screen display. Perfect for business professionals, managers and industry leaders. Trustworthy and accurate PowerPoint slide show. Customize the fonts, colors, layout, etc.as per your requirements and business needs.
-
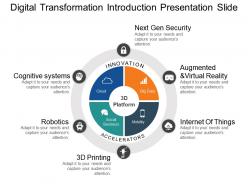 Digital transformation introduction presentation slide
Presenting digital transformation introduction presentation slide. This is a digital transformation introduction presentation slide. This is a four stage process. The stages in this process are digital transformation.
-
 Eight staged circle global business brochure flat powerpoint design
Perfect quality of pictures and images used in the designing. Swift download and easy to share with large set of viewers. Accessibility to amend the content as per the corporate requirement. Preference to add business details such as emblem or picture. PPT graphic accessible with different nodes and stages. Adaptable Presentation template as slickly alterable into JPG and PDF format. PowerPoint slide downloadable in standard and widescreen display. Preference to add company information such as logo, name and other information as you required. Easily share with large audience.
-
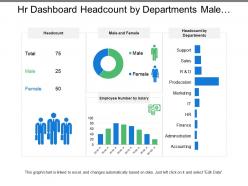 Hr dashboard headcount by departments male and female
Presenting this set of slides with name - Hr Dashboard Headcount By Departments Male And Female. This is a three stage process. The stages in this process are Hr Dashboard, Human Resource Dashboard, Hr Kpi.
-
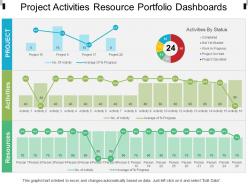 Project activities resource portfolio dashboards
Pre-designed project activities resource portfolio dashboards PPT template. Beneficial for managers, professors, marketers, etc. Flexible option for conversion in PDF or JPG formats. Available in Widescreen format also. Useful for making business plan and strategies. Can also be used with Google slides. Replace the images, text and the content in the slide design. Change the size, style and orientation of the slides. Use your company’s name or brand name to make it your own presentation template.
-
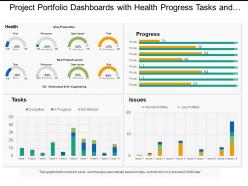 Project portfolio dashboards snapshot with health progress tasks and issues
Presenting, project portfolio dashboards snapshot with health progress tasks and issues. This PPT Template can be used by specialists for designing their project portfolio dashboards and health progress matters for data analysis. You can change the color of the components shown in the figure and also edit the text to write a short brief about your company's financial affairs. This PowerPoint template is also compatible with google slides and can be projected to a widescreen for business meetings without pixelating.
-
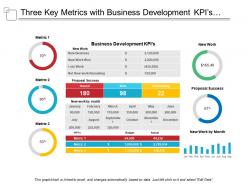 Three key metrics with business development kpis and proposal success
Presenting this set of slides with name - Three Key Metrics With Business Development Kpis And Proposal Success. This is a three stage process. The stages in this process are Key Metrics, Key Performance Indicator, Kpi.
-
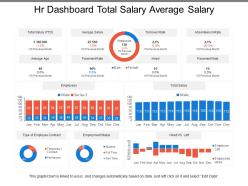 Hr dashboard total salary average salary
Presenting this set of slides with name - Hr Dashboard Total Salary Average Salary. This is a three stage process. The stages in this process are Hr Dashboard, Human Resource Dashboard, Hr Kpi.
-
 Business development statistics results slide powerpoint templates
Presenting business development statistics results slide powerpoint templates. This is a business development statistics results slide powerpoint templates. This is a five stage process. The stages in this process are results, output, deliverables, goals.
-
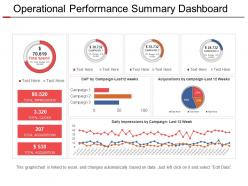 Operational performance summary dashboard presentation design
Presenting operational performance summary dashboard presentation design PowerPoint slide. This deck offers you plenty of space to put in titles and sub titles. High resolution-based layout does not change the image even after resizing. This presentation icon is fully compatible with Google slides. Quick downloading speed and simple editing options in color text and fonts.PPT icons can easily be changed into JPEG and PDF applications. This diagram has been designed for entrepreneurs, corporate and business managers. Easy to use, edit and you can design attractive slides within few minutes.
-
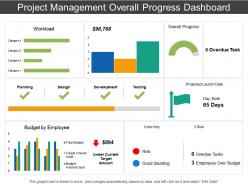 Project management overall progress dashboard
Preference to amend and personalize the PPT slide by adding business details i.e. name, logo, image or even tag line. Quick download and can be shared with large audience. Staggering balance colors, font and shape. Comparable Presentation design comes with different nodes and stages. Familiar with Google slides and easy to alter into JPEG and PDF.PPT diagram can be shared in both standard and widescreen view depending upon your requirement. High resolution and tremendous quality PowerPoint template
-
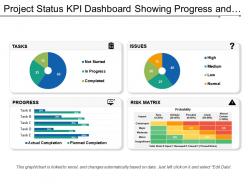 Project status kpi dashboard snapshot showing progress and risk matrix
Presenting project status KPI dashboard snapshot showing progress and risk matrix PowerPoint template. Simple data input like company logo, name or trademark. This PowerPoint theme is fully supported by Google slides. Picture quality of these slides does not change even when projected on large screen. This formats can be easily changed to JPEG and PDF applications. This template is suitable for marketing, sales persons, business managers and entrepreneurs. Adjust PPT layout, font, text and color as per your necessity
-
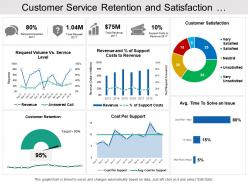 Customer service retention and satisfaction dashboard
Presenting this set of slides with name - Customer Service Retention And Satisfaction Dashboard. This is a six stage process. The stages in this process are Customer Base, Recurring Customers, Customer Services.
-
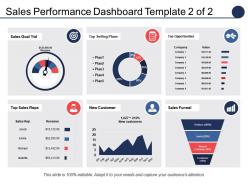 Sales Performance Dashboard Top Selling Plans Top Opportunities
Presenting sales performance dashboard top selling plans top opportunities PPT template. Completely amendable by any user at any point of time without any hassles. Error free performance to put an everlasting impression on the viewers. Great for incorporating business details such as name, logo and trademark. Can be utilized by students, entrepreneurs, investors and customers. Professionally designed presentation slides. Personalize the presentation with individual company name and logo. Available in both Standard and Widescreen slide size.
-
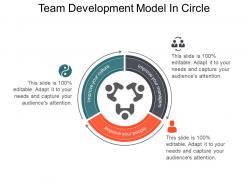 Team development model in circle
Presenting the Team Development Model In Circle PPT visual which is designed professionally for your convenience. This template is adaptable with Google Slides which makes it easily accessible at once. You can save your presentation in various formats like PDF, JPG, and PNG. Customize the colors, fonts, font size, and font types of the slide as per your requirements. Freely access the slide in both 4:3 and 16:9 aspect ratio.
-
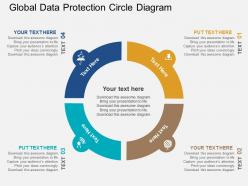 Global data protection circle diagram flat powerpoint design
We are proud to present our global data protection circle diagram flat powerpoint design. Concept of global data protection has been displayed in this power point template diagram. To show this concept we have used graphic of circles. Use this PPT diagram for business and data related presentations.
-
 Team performance dashboard powerpoint slide themes
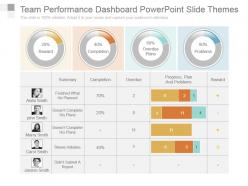
Presenting team performance dashboard powerpoint slide themes. This is a team performance dashboard powerpoint slide themes. This is a four stage process. The stages in this process are summary, completion, overdue, progress, plan and problems, reward, finished what he planned, doesnt complete his plans, doesnt complete his plans, shows initiative, didnt submit a report.
-
 Process improvement journey
Presenting Process Improvement Journey PPT theme which is completely editable. It is readily available in both 4:3 and 16:9 aspect ratio. This template is compatible with Google Slides which makes it easily accessible at once. You can open and save your presentation in various formats like PDF, JPG and PNG. Change the colors, fonts, font size, and font types as per your requirement.
-
 Revenue and expenses progress charts percentage circle
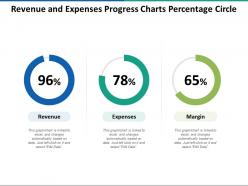
Presenting this set of slides with name - Revenue And Expenses Progress Charts Percentage Circle. This is a three stage process. The stages in this process are Percentage Circle, Percentage Round, Pie Chart.
-
 Workforce kpi dashboard showing resignation rate manager instability rate and performance workflow process
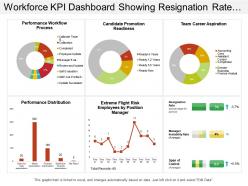
Presenting this set of slides with name - Workforce Kpi Dashboard Showing Resignation Rate Manager Instability Rate And Performance Workflow Process. This is a six stage process. The stages in this process are Staff, Personnel, Workforce.
-
 Hr strategic initiatives ppt diagrams
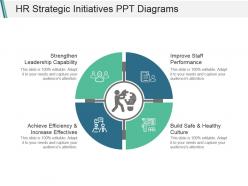
Introducing Hr Strategic Initiatives PowerPoint template diagram with four stages. Effortlessly changeable PowerPoint template as shading, content and textual style is alterable. This PowerPoint template is hundred percent compatible with Google Slides. You can easily download the template and save into JPEG and PDF format. The designer has used the best quality images, graphics, color, and icons. Easy to incorporate the company signature and logo. Picture quality does not get blur when displayed on widescreen.
-
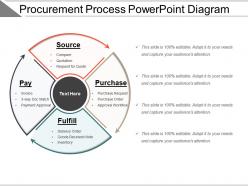 Procurement process powerpoint diagram
Presenting procurement process powerpoint diagram. This is a procurement process powerpoint diagram. This is a four stage process. The stages in this process are procurement, purchasing, ?bidding.
-
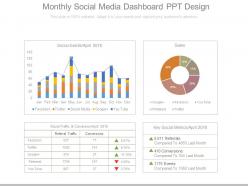 Monthly social media dashboard snapshot ppt design
Presenting monthly social media dashboard snapshot ppt design. This is a monthly social media dashboard ppt design. This is a four stage process. The stages in this process are social events, sales, social traffic and conversion, key social metrics, referrals, conversions, events.
-
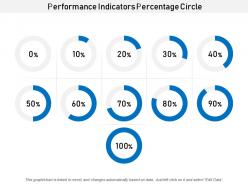 Performance indicators percentage circle
Presenting this set of slides with name - Performance Indicators Percentage Circle. This is a eleven stage process. The stages in this process are Percentage Circle, Percentage Round, Pie Chart.
-
 1214 five paper infographics for data flow powerpoint template
We are proud to present our 1214 five paper infographics for data flow powerpoint template. Five staged info graphics has been used to craft this power point template. This PPT contains the concept of data flow. Display data related technology in any presentations with this unique PPT.
-
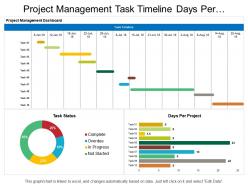 Project management task timeline days per project dashboard
Introducing project management task timeline days per project dashboard PPT template. Access to convert the presentation design into JPG and PDF. Offer 100% access to change the values, size and style of the slides once downloaded and saved in the desired format. High quality charts, images and visuals used in the designing process. Choice to get presentation slide in standard or in widescreen view. Easy to convert in JPEG and PDF document. Compatible with Google slides. Easy and hassle-free downloading process.
-
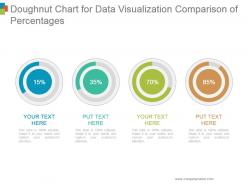 Doughnut chart for data visualization comparison of percentages powerpoint slides design
Presenting doughnut chart for data visualization comparison of percentages powerpoint slides design. This is a doughnut chart for data visualization comparison of percentages powerpoint slides design. This is a four stage process. The stages in this process are business, marketing, financial, percentage, increase.
-
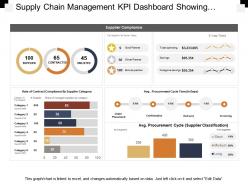 Supply chain management kpi dashboard showing supplier compliance stats
Presenting this set of slides with name - Supply Chain Management Kpi Dashboard Showing Supplier Compliance Stats. This is a four stage process. The stages in this process are Demand Forecasting, Predicting Future Demand, Supply Chain Management.
-
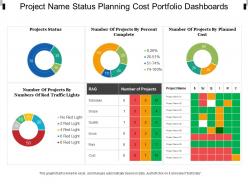 Project name status planning cost portfolio dashboards
Introducing project name status planning cost portfolio dashboards PPT template. Presentable and easy to comprehend visual graphic. The presentation template can be downloaded and saved in any desired format. Valuable for the business presenters and entrepreneurs as they can showcase their business success in a creative way. Privilege of insertion of logo and trademarks for more personalization. Adaptable to wide screen view without the problem of pixilation. Can be used with Google slides. Beneficial for industry professionals, managers, executives, researchers, sales people, etc.
-
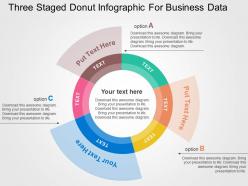 Three staged donut infographic for business data flat powerpoint design
Fine Picture quality used in the designing. Perfectly blend with other software programs such as JPG and PDF. Easy access to modify the PPT visual as color, text and layout amendable. Stress free consideration of organization's customized content. High determination slide demonstrate. Presentation image can be demonstrated in both standard and widescreen view. Appropriate for business data analyst team, corporate presentation experts, finance and accounts managers as well as executives.
-
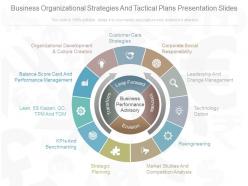 A business organizational strategies and tactical plans presentation slides
Flexibility to execute the adjustments in shading, textual style, content and more according to one's close to home decision. Simplicity of personalization with your organization name and logo. Run well with wide assortment of company alternatives. Congruous with set of programming alternatives, accessible both on the web and disconnected. The stages in this process are customer care strategies, corporate social responsibility, leadership and change management and much more.
-
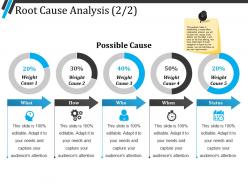 Root cause analysis ppt summary
Presenting Root Cause Analysis PPT Summary which is designed professionally for your convenience. You can change the color, fonts, font size, and font types of the template as per the requirements. The slide is readily available in both 4:3 and 16:9 aspect ratio. It is adaptable with Google Slides which makes it accessible at once. Can be converted into formats like PDF, JPG, and PNG.
-
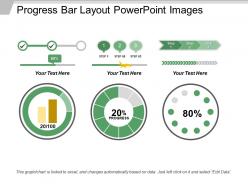 Progress bar layout powerpoint images
You can download this PPT completely free of cost. You just have to edit the data in a pre-designed format and present it. You can insert fonts and icons to this ready-made slide. All these slides are fully compatible with Google Slides. This presentation can be downloaded in JPG and PDF formats. It can be viewed in the 16:9 ratio widescreen size and the ratio of 4:3 standard screen size.
-
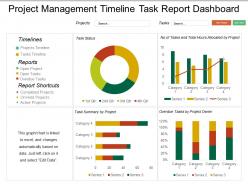 Project management timeline task report dashboard snapshot
Introducing project management timeline task report dashboard snapshot PPT template. An easy access to make the desired changes or edit it anyways. Wide screen view of the slides. Easy conversion into Jpeg or Pdf format. The PPT images offer compatibility with Google Slides. High resolution icons for clear message delivery. Unique and informational content. Valuable for business professionals, sales representatives, marketing professionals, students and selling investigators. High quality charts and visuals used in the designing process. They enhance the performance of the presentation.


