Ebitda range before and acquisitions inorganic growth strategies and evolution ppt diagrams
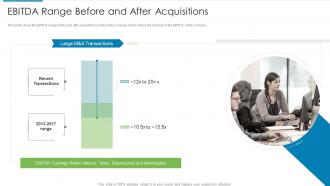
This slide shows the EBITDA range before and after acquisitions made by the company which shows the increase in the EBITDA of the company.
- Google Slides is a new FREE Presentation software from Google.
- All our content is 100% compatible with Google Slides.
- Just download our designs, and upload them to Google Slides and they will work automatically.
- Amaze your audience with SlideTeam and Google Slides.
-
Want Changes to This PPT Slide? Check out our Presentation Design Services
- WideScreen Aspect ratio is becoming a very popular format. When you download this product, the downloaded ZIP will contain this product in both standard and widescreen format.
-

- Some older products that we have may only be in standard format, but they can easily be converted to widescreen.
- To do this, please open the SlideTeam product in Powerpoint, and go to
- Design ( On the top bar) -> Page Setup -> and select "On-screen Show (16:9)” in the drop down for "Slides Sized for".
- The slide or theme will change to widescreen, and all graphics will adjust automatically. You can similarly convert our content to any other desired screen aspect ratio.
Compatible With Google Slides

Get This In WideScreen
You must be logged in to download this presentation.
PowerPoint presentation slides
This slide shows the EBITDA range before and after acquisitions made by the company which shows the increase in the EBITDA of the company. Introducing Ebitda Range Before And Acquisitions Inorganic Growth Strategies And Evolution Ppt Diagrams to increase your presentation threshold. Encompassed with one stages, this template is a great option to educate and entice your audience. Dispence information on EBITDA Range Before And After Acquisitions, using this template. Grab it now to reap its full benefits.
People who downloaded this PowerPoint presentation also viewed the following :
Ebitda range before and acquisitions inorganic growth strategies and evolution ppt diagrams with all 6 slides:
Use our Ebitda Range Before And Acquisitions Inorganic Growth Strategies And Evolution Ppt Diagrams to effectively help you save your valuable time. They are readymade to fit into any presentation structure.
-
Innovative and attractive designs.
-
Great quality slides in rapid time.


