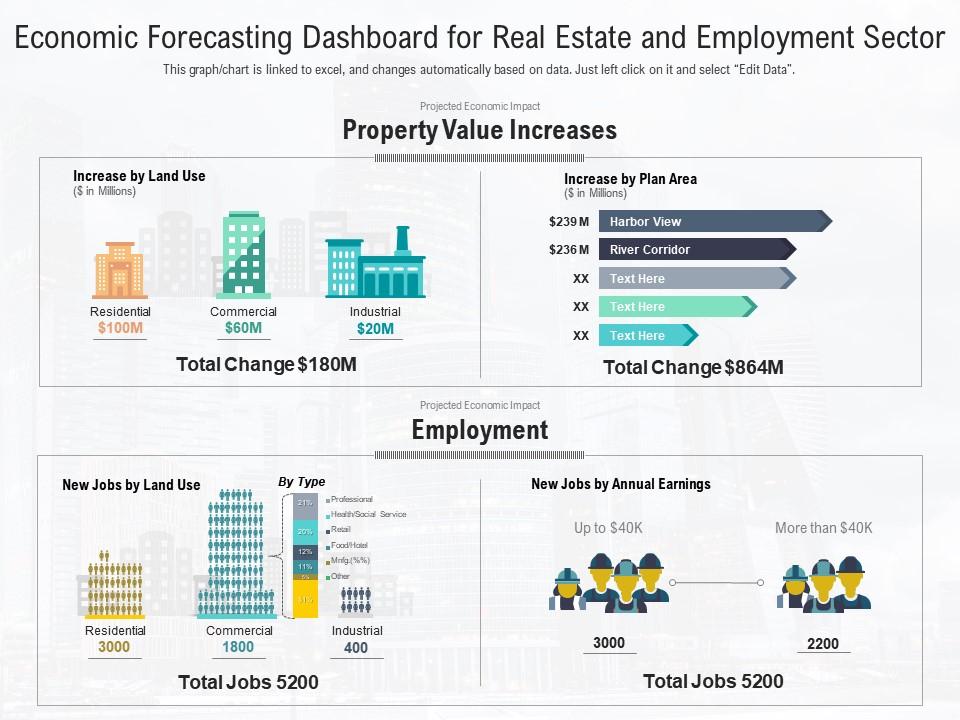
Economic forecasting dashboard for real estate and employment sector
This graph chart is linked to excel, and changes automatically based on data. Just left click on it and select Edit Data.
This graph chart is linked to excel, and changes automatically based on data. Just left click on it and select Edit Data.
- Google Slides is a new FREE Presentation software from Google.
- All our content is 100% compatible with Google Slides.
- Just download our designs, and upload them to Google Slides and they will work automatically.
- Amaze your audience with SlideTeam and Google Slides.
-
Want Changes to This PPT Slide? Check out our Presentation Design Services
- WideScreen Aspect ratio is becoming a very popular format. When you download this product, the downloaded ZIP will contain this product in both standard and widescreen format.
-

- Some older products that we have may only be in standard format, but they can easily be converted to widescreen.
- To do this, please open the SlideTeam product in Powerpoint, and go to
- Design ( On the top bar) -> Page Setup -> and select "On-screen Show (16:9)” in the drop down for "Slides Sized for".
- The slide or theme will change to widescreen, and all graphics will adjust automatically. You can similarly convert our content to any other desired screen aspect ratio.
Compatible With Google Slides

Get This In WideScreen
You must be logged in to download this presentation.
PowerPoint presentation slides
This graph chart is linked to excel, and changes automatically based on data. Just left click on it and select Edit Data. Introducing our Economic Forecasting Dashboard For Real Estate And Employment Sector. set of slides. The topics discussed in these slides are property value increases, employment, increase by plan area. This is an immediately available PowerPoint presentation that can be conveniently customized. Download it and convince your audience.
People who downloaded this PowerPoint presentation also viewed the following :
Economic forecasting dashboard for real estate and employment sector with all 2 slides:
Use our Economic Forecasting Dashboard For Real Estate And Employment Sector to effectively help you save your valuable time. They are readymade to fit into any presentation structure.
-
Qualitative and comprehensive slides.
-
Out of the box and creative design.
-
Content of slide is easy to understand and edit.
-
Best Representation of topics, really appreciable.
-
Illustrative design with editable content. Exceptional value for money. Highly pleased with the product.


