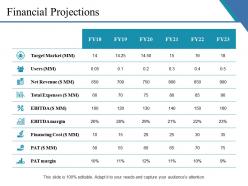
Financial projections ppt example
Try Before you Buy Download Free Sample Product
Audience
Editable
of Time
Be confident of gaining a great advantage with our Financial Projections Ppt Example. They ensure your chances become even better.
People who downloaded this PowerPoint presentation also viewed the following :
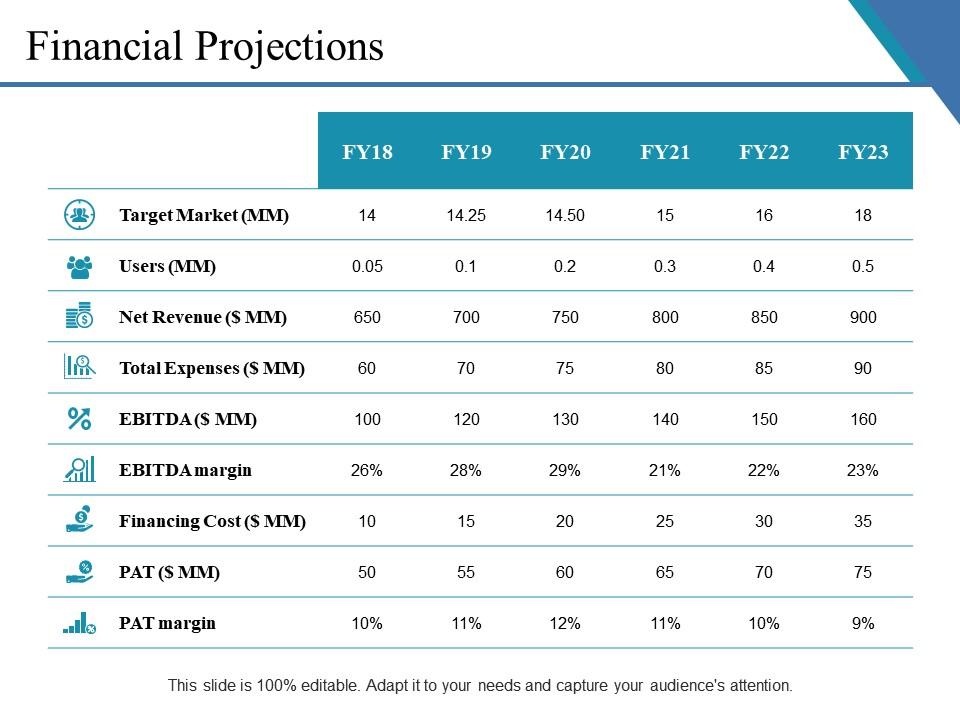
Financial projections ppt example with all 5 slides:
Grab it with both hands with our Financial Projections Ppt Example. Make the best of every chance you get.
FAQs for Financial
Key components include revenue forecasts, expense budgets, cash flow statements, break-even analysis, and funding requirements. These projections enable startups to demonstrate viability to investors, plan resource allocation strategically, and anticipate financial challenges, with many emerging companies finding that detailed three-year projections significantly enhance their credibility and operational planning effectiveness.
Historical data enhances financial projection accuracy by establishing baseline trends, identifying seasonal patterns, revealing growth trajectories, and highlighting cyclical variations that inform future forecasts. Through advanced analytics and trend analysis, companies can minimize forecasting errors, improve budget allocation, and make more strategic investment decisions, with many financial institutions finding that data-driven projections deliver significantly better outcomes than traditional estimation methods.
Businesses should avoid overly optimistic revenue assumptions, inadequate expense planning, ignoring seasonal variations, neglecting cash flow timing, and failing to create multiple scenarios for different market conditions. These forecasting errors can lead to cash shortages, missed growth opportunities, and poor strategic decisions, with many organizations finding that conservative estimates and regular forecast updates deliver more reliable planning outcomes.
Companies should update financial projections quarterly for regular monitoring, with additional updates triggered by major market shifts, strategic changes, or significant operational developments. This frequency enables organizations to maintain accuracy in forecasting, respond proactively to emerging opportunities or challenges, and ensure stakeholders receive current data for informed decision-making, ultimately delivering enhanced strategic agility and competitive positioning.
Market trends significantly influence financial projections by affecting revenue forecasts, cost structures, consumer demand patterns, and competitive positioning within specific sectors. Understanding these trends enables businesses to anticipate market shifts, adjust pricing strategies, and allocate resources more effectively, with many organizations finding that trend-informed projections deliver more accurate planning and sustainable competitive advantage.
Different financial modeling techniques significantly influence projection outcomes through varying assumptions, methodologies, and risk assessments, with discounted cash flow models emphasizing long-term value while scenario-based approaches highlighting potential volatility. Financial institutions and consulting firms increasingly combine multiple techniques, finding that Monte Carlo simulations, sensitivity analysis, and comparative modeling deliver more robust forecasting accuracy, ultimately enabling better strategic decisions and enhanced stakeholder confidence.
Short-term financial projections typically cover 1-2 years with detailed monthly or quarterly forecasts, while long-term projections span 3-5 years with broader annual estimates and strategic assumptions. Short-term projections enable precise budgeting and operational planning, while long-term forecasts guide strategic investments, expansion decisions, and capital allocation, with many organizations finding that combining both timeframes delivers comprehensive financial visibility and competitive advantage.
Non-financial metrics significantly impact financial projections by influencing customer acquisition costs, retention rates, operational efficiency, and revenue growth trajectories. These indicators, including customer satisfaction scores, employee engagement levels, and market share data, help organizations predict future cash flows, identify cost-reduction opportunities, and enhance forecasting accuracy, ultimately delivering more reliable strategic planning and competitive advantage.
Recommended tools include Excel, QuickBooks, Tableau, Microsoft Power BI, and specialized platforms like PlanGuru. These solutions streamline financial modeling by automating calculations, integrating real-time data, and providing sophisticated visualization capabilities, with many financial institutions and growing businesses finding that comprehensive projection software ultimately delivers more accurate forecasting and enhanced strategic decision-making.
Seasonal variations significantly impact financial forecasting by creating predictable revenue fluctuations, requiring adjusted inventory planning, modified staffing models, and altered cash flow projections throughout the year. Industries like retail, tourism, and agriculture use historical seasonal data, trend analysis, and scenario modeling to anticipate these patterns, enabling strategic resource allocation and maintaining operational efficiency during peak and off-peak periods.
Sensitivity analysis in financial projections identifies how changes in key variables affect outcomes, enabling organizations to understand risk exposure, test different scenarios, and make informed strategic decisions. This approach helps businesses prepare for market fluctuations, assess investment viability, and develop contingency plans, with many financial institutions and corporations finding that robust sensitivity testing enhances forecasting accuracy and strategic planning.
Businesses can effectively communicate financial projections through clear visual presentations, comprehensive executive summaries, scenario-based modeling, regular update meetings, and transparent assumption documentation. These approaches streamline stakeholder understanding by highlighting key metrics, addressing potential risks, and demonstrating strategic growth paths, with many organizations finding that consistent, data-driven presentations ultimately enhance investor confidence and strategic alignment.
Best practices for visualizing financial projections include using clear trend charts, comparative bar graphs, waterfall charts for variance analysis, scenario modeling displays, and interactive dashboards with key metrics. These visualization techniques enhance stakeholder understanding by presenting complex data intuitively, highlighting growth trajectories and risk factors, while enabling executives to make informed strategic decisions quickly and confidently.
Cash flow forecasting tracks actual money movement in and out of your business, focusing on timing of receipts and payments, while profit and loss projections measure revenue and expenses regardless of when cash changes hands. For example, a consulting firm might show December revenue on P&L when invoiced, but cash flow forecasting reflects when clients actually pay in January, helping businesses manage working capital and avoid liquidity issues.
Economic indicators influence financial projections by providing data on inflation rates, employment levels, GDP growth, interest rates, and consumer spending patterns. These metrics enable organizations to adjust revenue forecasts, cost projections, and investment strategies accordingly, with many financial institutions and retail companies finding that incorporating leading indicators like housing starts and manufacturing output ultimately delivers more accurate budgeting and strategic planning.
-
Best Representation of topics, really appreciable.
-
Excellent Designs.