Charts, Graphs PowerPoint Designs, Presentation Charts Designs & PPT Graphics
- Sub Categories
-
- Arrows and Targets
- Bullet and Text Slides
- Charts and Graphs
- Circular Cycle Diagrams
- Concepts and Shapes
- Custom Flat Designs
- Dashboards and Measuring
- Flow Process
- Funnels
- Gears
- Growth
- Harvey Balls
- Idea Innovation and Light Bulbs
- Leadership
- Linear Process Diagrams
- Magnifying Glass
- Misc Other Graphics
- Opportunity and Handshake
- Organization Charts
- Puzzles
- Pyramids
- Roadmaps and Timelines
- Silhouettes
- Steps
- Strategic Planning Analysis
- SWOT Analysis
- Tables and Matrix
- Teamwork
- Technology and Communication
- Venn Diagrams
- Visuals and Illustrations
-
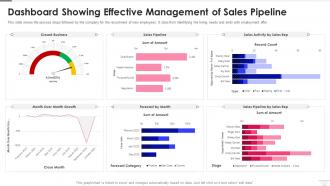 Dashboard Snapshot Showing Effective Management Of Sales Pipeline Sales Pipeline Management
This slide shows the process steps followed by the company for the recruitment of new employees. It stars from Identifying the hiring needs and ends with employment offer Present the topic in a bit more detail with this Dashboard snapshot Showing Effective Management Of Sales Pipeline Sales Pipeline Management. Use it as a tool for discussion and navigation on Management, Pipeline, Dashboard. This template is free to edit as deemed fit for your organization. Therefore download it now.
-
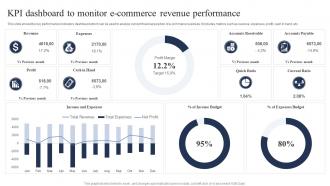 KPI Dashboard To Monitor E Commerce Revenue Performance
This slide shows the key performance indicators dashboard which can be used to analyze current financial position of e-commerce business. It includes metrics such as revenue, expenses, profit, cash in hand, etc. Presenting our well structured KPI Dashboard To Monitor E Commerce Revenue Performance. The topics discussed in this slide are Revenue, Expenses, Accounts Receivable. This is an instantly available PowerPoint presentation that can be edited conveniently. Download it right away and captivate your audience.
-
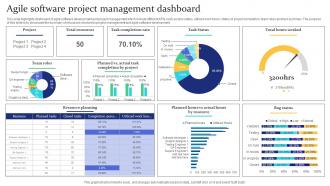 Agile Software Project Management Dashboard
This slide highlights dashboard of agile software development and project management which include different KPIs such as task status, utilized work hours, status of project completion, team roles and task summary. The purpose of this slide is to showcase the summary of resources involved in project management and agile software development. Introducing our Agile Software Project Management Dashboard set of slides. The topics discussed in these slides are Project, Task Completion Rate, Resource Planning. This is an immediately available PowerPoint presentation that can be conveniently customized. Download it and convince your audience.
-
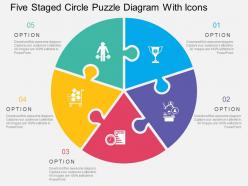 Five staged circle puzzle diagram with icons flat powerpoint design
Businessmen, micro, small and medium enterprises can use the PPT visual as a master slide. PowerPoint presentation supports filling background in a different color from the text. All images are 100% editable in the presentation slide. Text can be differentiated form the background by the handy features provided by PPT layout. There is no space constrain in the PowerPoint slide, thus enabling easy addition or edition of data.
-
 Status symbol four circles loading round progress bar 1
Presenting status symbol four circles loading round progress bar 1. This is a status symbol four circles loading round progress bar 1. This is a four stage process. The stages in this process are status symbol, status icon.
-
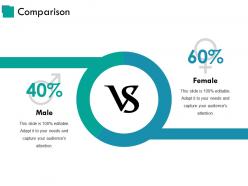 Comparison ppt inspiration
Presenting this set of slides with name - Comparison Ppt Inspiration. This is a two stage process. The stages in this process are Compare, Percentage, Male, Female, Finance.
-
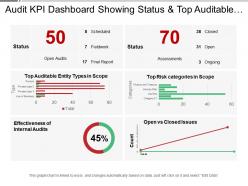 Audit kpi dashboard showing status and top auditable entity types
Presenting this set of slides with name - Audit Kpi Dashboard Showing Status And Top Auditable Entity Types. This is a six stage process. The stages in this process are Audit, Examine, Survey.
-
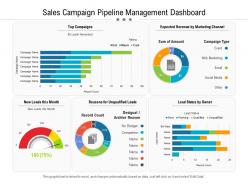 Sales campaign pipeline management dashboard
Presenting this set of slides with name Sales Campaign Pipeline Management Dashboard. The topics discussed in these slides are Campaigns, Revenue, Marketing. This is a completely editable PowerPoint presentation and is available for immediate download. Download now and impress your audience.
-
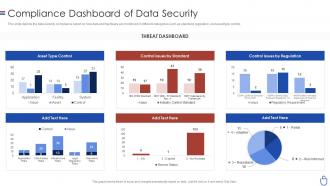 Data security it compliance dashboard snapshot of data security
This slide depicts the data security compliance report on how data and hardware are monitored in different categories such as standard, regulation, and asset type control. Present the topic in a bit more detail with this Data Security IT Compliance Dashboard Snapshot Of Data Security. Use it as a tool for discussion and navigation on Asset Type Control, Control Issues By Standard, Control Issues By Regulation, Threat Dashboard. This template is free to edit as deemed fit for your organization. Therefore download it now.
-
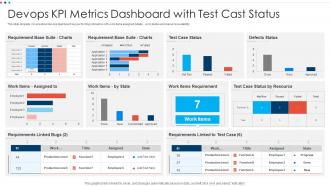 Devops KPI Metrics Dashboard With Test Cast Status
This slide template covers about devops dashboard key performing indicators with work items assigned details , work status and resource availability. Presenting our well structured Devops KPI Metrics Dashboard With Test Cast Status. The topics discussed in this slide are Devops KPI Metrics Dashboard with Test Cast Status. This is an instantly available PowerPoint presentation that can be edited conveniently. Download it right away and captivate your audience.
-
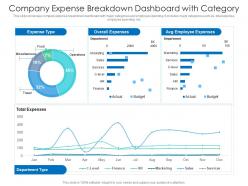 Company expense breakdown dashboard with category
This slide showcase company expense breakdown dashboard with major categories and employee spending. It includes major categories such as- total expense, employee spending etc. Presenting our well-structured Company Expense Breakdown Dashboard With Category. The topics discussed in this slide are Company Expense Breakdown Dashboard With Category. This is an instantly available PowerPoint presentation that can be edited conveniently. Download it right away and captivate your audience.
-
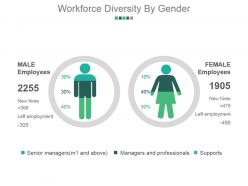 Workforce diversity by gender powerpoint slide design ideas
Presenting workforce diversity by gender powerpoint slide design ideas. This is a workforce diversity by gender powerpoint slide design ideas. This is a two stage process. The stages in this process are male employees, female employees, new hires, left employment.
-
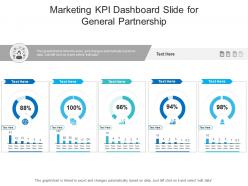 Marketing kpi dashboard slide for general partnership powerpoint template
This Marketing Kpi Dashboard Slide For General Partnership Powerpoint Template is designed using a data-driven approach to help you display important stats, figures, insights, and metrics related to the topic of your choice. You can also deploy this slide to present reports on a specific business project and strategy. It is tailor-made using a mix of KPIs that make the information easily understandable. Project managers, executives, or other department heads can grab this readily available PowerPoint presentation slide to present relevant information. It can be further used for monitoring and identifying various trends doing rounds in the industry of your choice. The biggest feature of this PowerPoint layout is that it is designed using vector-based and high-quality graphics that can be reproduced as PNGs, JPGs, and PDFs. It also works well with Google Slides and PowerPoint. Therefore, giving a lot of options to work with.
-
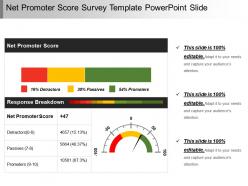 Net promoter score survey template powerpoint slide
Presenting Net Promoter Score Survey Template PowerPoint Slide. Made up of high-resolution graphics. Easy to download and can be saved in a variety of formats. Access to open on a widescreen preview. Compatible with the Google Slides and PowerPoint software. Edit the style, size, and the background of the slide icons as per your needs. Useful for business owners, students, and managers. Can be viewed on standard screen and widescreen without any fear of pixelation.
-
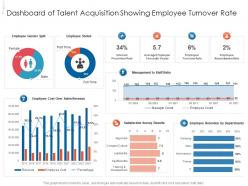 Dashboard of talent acquisition showing employee turnover rate
Presenting our well structured Dashboard Of Talent Acquisition Showing Employee Turnover Rate. The topics discussed in this slide are Sales, Revenue, Survey. This is an instantly available PowerPoint presentation that can be edited conveniently. Download it right away and captivate your audience.
-
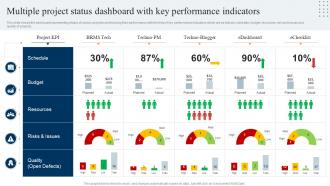 Multiple Project Status Dashboard Snapshot With Key Performance Indicators
This slide shows the dashboard representing status of various projects and tracking their performance with the help of key performance indicators which are as follows schedule, budget, resources, risk and issues and quality of projects. Introducing our Multiple Project Status Dashboard Snapshot With Key Performance Indicators set of slides. The topics discussed in these slides are Budget, Schedule, Resources. This is an immediately available PowerPoint presentation that can be conveniently customized. Download it and convince your audience.
-
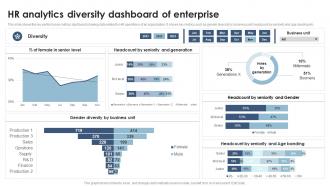 Hr Analytics Diversity Dashboard Of Enterprise Analyzing And Implementing HR Analytics In Enterprise
This slide shows the key performance metrics dashboard showing data related to HR operations of an organization. It shows key metrics such as gender diversity by business unit, headcount by seniority and age banding etc. Present the topic in a bit more detail with this Hr Analytics Diversity Dashboard Of Enterprise Analyzing And Implementing HR Analytics In Enterprise. Use it as a tool for discussion and navigation on Analytics Diversity, Dashboard Of Enterprise, Business Unit. This template is free to edit as deemed fit for your organization. Therefore download it now.
-
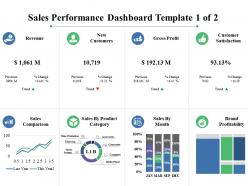 Sales performance dashboard revenue new customers
Providing sales performance dashboard revenue new customers PowerPoint template. PPT graphic can be shared in standard and widescreen view. High resolution picture quality ensures no pixel break up even when shared with large set of audience. Presentation slide is adaptable with Google slides. Magnificent to share business communication effectively. PPT slide is available with different nodes and stages. PowerPoint design can be edited as needed and change into JPG and PDF format.
-
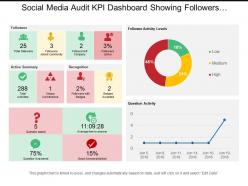 Social media audit kpi dashboard showing followers activity summary and activity leads
This PPT template is very useful for your business PowerPoint presentation. It is fully editable and has editable features like editable font, font size, font color, etc. There are many shapes to choose from like squares, triangles, circles, rectangles, pentagon and many more shapes in order to edit this presentation in PowerPoint. All the images in this PPT are 100% editable. The excel-linked charts in this PPT template can also be edited with ease. It can be viewed and saved in JPG or PDF format. It is fully compatible with Google slides as well.
-
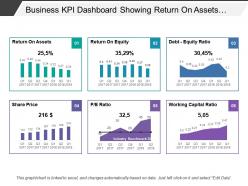 Business kpi dashboard showing return on assets debt-equity ratio
Presenting this set of slides with name - Business Kpi Dashboard Showing Return On Assets Debt-Equity Ratio. This is a six stage process. The stages in this process are Business Dashboard, Business Kpi, Business Performance.
-
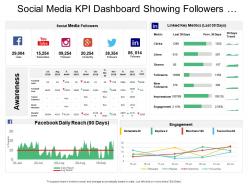 Social media kpi dashboard showing followers facebook daily reach
SlideTeam presents the Social media KPI dashboard showing followers Facebook daily reach This slideshow is modifiable according to your needs as you can make all the required changes to it whenever you feel like. You can edit the font size and font style. These slides are fully compatible with Google Slides. You can view the presentation on both 16:9 widescreen side as well as the 4:3 standard screen size. You can save them in either JPG or PDF format.
-
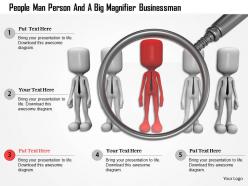 Right Selection For Skilled People Ppt Graphics Icons
We are proud to present our right selection for skilled people ppt graphics icons. Concept of right selection of skilled people has been displayed in this PPT diagram. This PPT diagram contains the graphic of peoples and magnifier. Use this PPT diagram for business presentations.
-
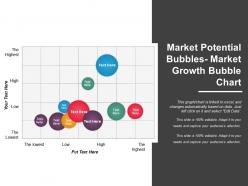 Market potential bubbles market growth bubble chart ppt summary
Presenting Market Potential Bubbles Market Growth Bubble Chart PPT Summary. The slide is available in PowerPoint and is in sync with Google Slides too. The template is excel - linked and once you left click on it, you can link it to a given excel sheet and the data will get transferred automatically. The layout is fully editable. You can change the colors of the diagram. The color, size and style of the fonts can also be altered as per your requirement. The sample text can be replaced by the relevant content. You can also add the name and logo of your company. The slide is available in two variant sizes - 16:9 and 4:3. A high resolution ensures that the image does not blur upon enlarging. It can be downloaded easily.
-
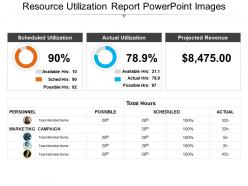 Resource utilization report powerpoint images
Presenting resource utilization report PowerPoint images PPT slide. This is a self-explanatory and intellectual slide design. There is the use of visually impressive colors and stunning picture quality. High-resolution images do not pixelate when projected on a wide screen. PPT is compatible with numerous software and format options. 100 percent editable slide design components. Modify the presentation elements as per the need of the hour. Personalize the PPT with your company name and logo. Used by entrepreneurs, marketers, managerial department, stakeholders and students.
-
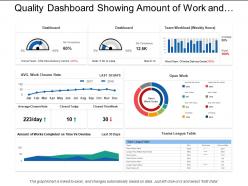 Quality dashboard showing amount of work and the percentage charts
SlideTeam presents to you its quality dashboard showing amount of work and the percentage charts.You can also alter the font size, font color and font style of the text so used in the slides. The business template can be saved in format of PDF or JPG as per your requirements. So download this slideshow and make most of it.
-
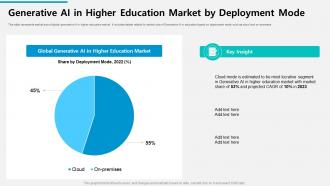 Generative AI in Higher Education Market by Deployment ChatGPT Reshaping Education Sector ChatGPT SS
This slide represents market size of global generative AI in higher education market. It includes details related to market size of Generative AI in education based on deployment mode such as cloud and on-premises Present the topic in a bit more detail with this Generative AI in Higher Education Market by Deployment ChatGPT Reshaping Education Sector ChatGPT SS Use it as a tool for discussion and navigation on Global Generative AI, Higher Education Market This template is free to edit as deemed fit for your organization. Therefore download it now.
-
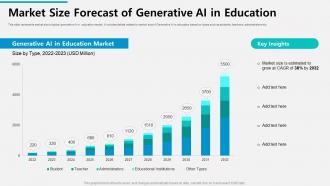 Market Size Forecast of Generative AI in Education ChatGPT Reshaping Education Sector ChatGPT SS
This slide represents market size of global generative AI in education market. It includes details related to market size of Generative AI in education based on types such as students, teachers, administrators etc. Present the topic in a bit more detail with this Market Size Forecast of Generative AI in Education ChatGPT Reshaping Education Sector ChatGPT SS Use it as a tool for discussion and navigation on Generative AI, Education Market This template is free to edit as deemed fit for your organization. Therefore download it now.
-
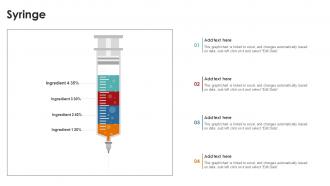 Syringe PU Chart SS
Introducing our Syringe PU Chart SS set of slides. The topics discussed in these slides are Syringe. This is an immediately available PowerPoint presentation that can be conveniently customized. Download it and convince your audience.
-
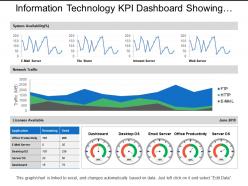 Information technology kpi dashboard showing network traffic system availability
Presenting information technology KPI dashboard showing network traffic system PowerPoint template. Choice to view PowerPoint design in standard and widescreen view. Fully editable Presentation dashboards that can be edited as needed. Easy to download and insert in the ongoing presentation. Convertible into Jpeg and Pdf document. Suitable for managers, leaders, sales and marketing people, analysts, etc. Slides are designed using latest management tools and techniques. The high-resolution view is altogether an experience with a brilliant impact.
-
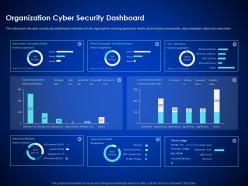 Organization cyber security dashboard snapshot enterprise cyber security ppt icons
This slide covers the cyber security key performance indicators for the organization including application health, device license consumption, data encryption status and many more Deliver an outstanding presentation on the topic using this Organization Cyber Security Dashboard Snapshot Enterprise Cyber Security Ppt Icons. Dispense information and present a thorough explanation of Organization Cyber Security Dashboard using the slides given. This template can be altered and personalized to fit your needs. It is also available for immediate download. So grab it now.
-
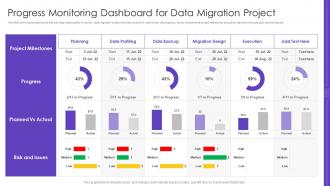 Progress Monitoring Dashboard For Data Migration Project
This slide showcases dashboard that can help organization to monitor data migration project and take actions in case of any discrepancy. Its key components project milestones progress, planned vs actual plus risk and issues. Presenting our well structured Progress Monitoring Dashboard For Data Migration Project. The topics discussed in this slide are Project Milestones, Risk And Issues, Data Profiling. This is an instantly available PowerPoint presentation that can be edited conveniently. Download it right away and captivate your audience.
-
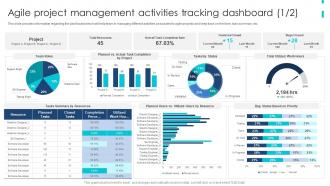 Agile Product Development Playbook Agile Project Management Activities Tracking Dashboard
This slide provides information regarding the dashboard which will help team in managing different activities associated to agile projects and keep track on the time, task summary, etc. Present the topic in a bit more detail with this Agile Product Development Playbook Agile Project Management Activities Tracking Dashboard. Use it as a tool for discussion and navigation on Project, Total Resources, Features Closed, Bugs Closed. This template is free to edit as deemed fit for your organization. Therefore download it now.
-
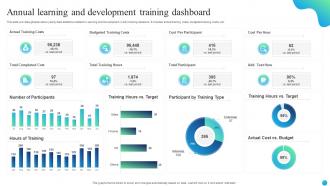 Annual Learning And Development Training Dashboard
This slide provides glimpse about yearly data statistics related to Learning and Development L and D training sessions. It includes actual training costs, budgeted training costs, etc.Introducing our Annual Learning And Development Training Dashboard set of slides. The topics discussed in these slides are Actual Training Costs, Total Completed Cost, Total Training Hours. This is an immediately available PowerPoint presentation that can be conveniently customized. Download it and convince your audience.
-
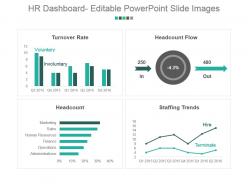 Hr dashboard editable powerpoint slide images
Stunning HR dashboard editable PPT slideshow. Loaded with incomparable benefits. Readymade PPT graphic helps in saving time and effort. Can be personalized by adding company trademark, logo, brand and symbols. Can be utilized for displaying both simple and complex information. Include or exclude slide content as per your individual need. Colors and text can be easily changed as the PPT slide is completely editable. Useful for every business leader and professional, project management team, business analysts, etc.
-
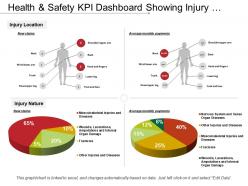 Health and safety kpi dashboard showing injury location and injury nature
Presenting the KPI dashboard PPT slide. This PPT template is fully editable and is designed by professionals looking for a professional presentation. You can edit the objects in the slide like font size and font color easily. This presentation slide is fully compatible with Google Slide and can be saved in JPG or PDF file format easily. Click on the download button below.
-
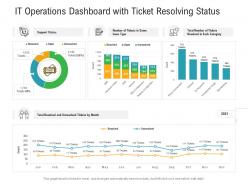 It operations dashboard with ticket resolving status
Presenting our well-structured It Operations Dashboard With Ticket Resolving Status. The topics discussed in this slide are Support Status, Number Of Tickets In Same Issue Type, Total Number Of Tickets Resolved In Each Category. This is an instantly available PowerPoint presentation that can be edited conveniently. Download it right away and captivate your audience.
-
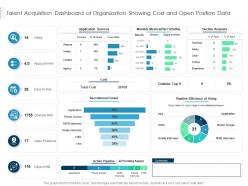 Talent acquisition dashboard of organization showing cost and open position data
Introducing our Talent Acquisition Dashboard Of Organization Showing Cost And Open Position Data set of slides. The topics discussed in these slides are Sources, Efficiency, Funnel. This is an immediately available PowerPoint presentation that can be conveniently customized. Download it and convince your audience.
-
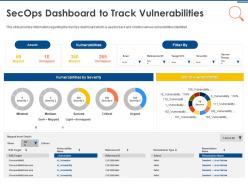 It security operations secops dashboard to track vulnerabilities ppt powerpoint gallery outfit
This slide provides information regarding the SecOps dashboard which is used to track and monitor various vulnerabilities identified. Present the topic in a bit more detail with this IT Security Operations Secops Dashboard To Track Vulnerabilities Ppt Powerpoint Gallery Outfit. Use it as a tool for discussion and navigation on Assets, Vulnerabilities, Severity. This template is free to edit as deemed fit for your organization. Therefore download it now.
-
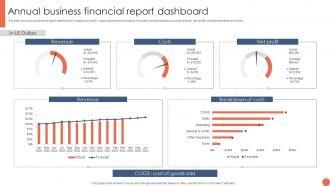 Annual Business Financial Report Dashboard Snapshot
This slide shows annual financial report dashboard snapshot of company to monitor yearly business performance. It includes various indicators such as revenue, net profits, costs and breakdown of cost Introducing our Annual Business Financial Report Dashboard set of slides. The topics discussed in these slides are Revenue, Costs, Net Profit, Breakdown Of Costs. This is an immediately available PowerPoint presentation that can be conveniently customized. Download it and convince your audience.
-
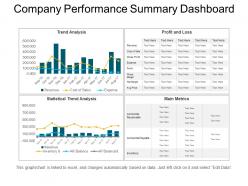 Company performance summary dashboard ppt slide examples
Presenting company performance summary dashboard PPT design. They are 100% expertly crafted Presentation graphics. They are quite compatible with all software’s and Google Slides. They have a feature to redesign all the available shapes, patterns, and matters etc. They have an authentic and relevant PPT images with limber data options and can easily add company name or logo.
-
 Budget forecast showing expense management and expenses
Presenting this set of slides with name - Budget Forecast Showing Expense Management And Expenses. This is a three stage process. The stages in this process are Budget Forecast, Forecast Vs Actual Budget, Plan Vs Forecast.
-
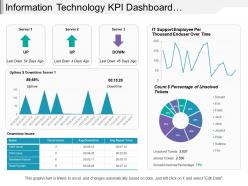 Information technology kpi dashboard showing downtime issues unsolved tickets
Presenting this set of slides with name - Information Technology Kpi Dashboard Showing Downtime Issues Unsolved Tickets. This is a four stage process. The stages in this process are Information Technology, It, Iot.
-
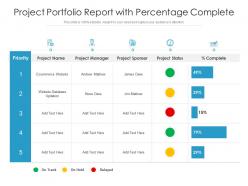 Project portfolio report with percentage complete
Introducing our Project Portfolio Report With Percentage Complete set of slides. The topics discussed in these slides are Project Manager, Project Sponsor, Project Status. This is an immediately available PowerPoint presentation that can be conveniently customized. Download it and convince your audience.
-
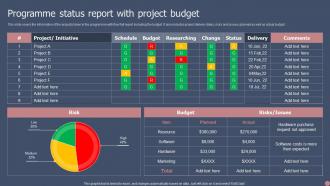 Programme Status Report With Project Budget
This slide covers the information of the projects taken in the programme with their full report including the budget. It also includes project delivery dates, risks and issues, planned as well as actual budget. Presenting our well structured Programme Status Report With Project Budget. The topics discussed in this slide are Project, Initiative, Budget, Risks. This is an instantly available PowerPoint presentation that can be edited conveniently. Download it right away and captivate your audience.
-
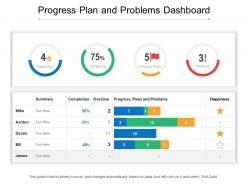 Progress plan and problems dashboard
Presenting this set of slides with name Progress Plan And Problems Dashboard. The topics discussed in these slides are Progress Dashboard, Chart And Graph, Finance, Marketing. This is a completely editable PowerPoint presentation and is available for immediate download. Download now and impress your audience.
-
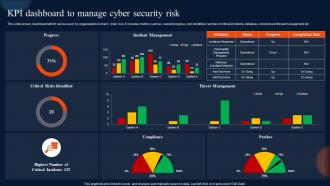 Kpi Dashboard To Manage Cyber Security Risk
This slide shows dashboard which can be used by organizations to track cyber risk. It includes metrics such as overall progress, risk identified, number of critical incidents, initiatives, incident and threat management etc. Presenting our well structured Kpi Dashboard To Manage Cyber Security Risk. The topics discussed in this slide are Dashboard, Organizations, Management. This is an instantly available PowerPoint presentation that can be edited conveniently. Download it right away and captivate your audience.
-
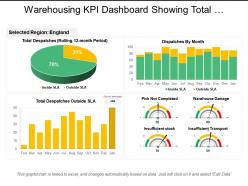 Warehousing kpi dashboard showing total dispatches
This highly versatile PPT design is completely editable; you can modify and personalize the design according to your business needs. You can use excel linked chart to display your business related and figures in presentation. PPT slides are easily downloadable as JPEG or PDF formats. Design can be opened both in standard and wide screen view; no change on design quality on full screen view.
-
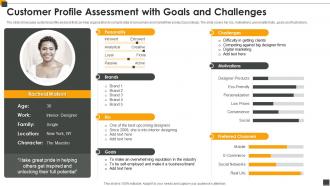 Customer Profile Assessment With Goals And Challenges
The Slide Showcases Customer Profile Analysis That Can Help Organisation To Compile Data Of Consumers And Market Their Product Accordingly. The Slide Covers Her Bio, Motivations, Personality Traits, Goals And Frustrations. Introducing our Customer Profile Assessment With Goals And Challenges set of slides. The topics discussed in these slides are Customer, Assessment, Motivations, Frustrations, Business. This is an immediately available PowerPoint presentation that can be conveniently customized. Download it and convince your audience.
-
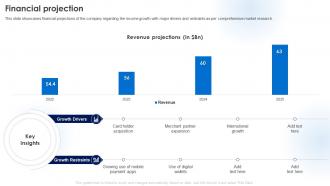 Financial Projection Business Model Of American Express BMC SS
This slide showcases financial projections of the company regarding the income growth with major drivers and restraints as per comprehensive market research. Present the topic in a bit more detail with this Financial Projection Business Model Of American Express BMC SS. Use it as a tool for discussion and navigation on Financial Projection, Comprehensive Market Research, International Growth. This template is free to edit as deemed fit for your organization. Therefore download it now.
-
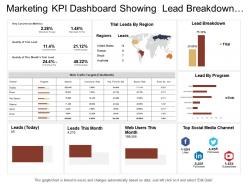 Marketing kpi dashboard showing lead breakdown web traffic targets
Presenting this set of slides with name - Marketing Kpi Dashboard Showing Lead Breakdown Web Traffic Targets. This is a three stage process. The stages in this process are Marketing, Branding, Promoting.
-
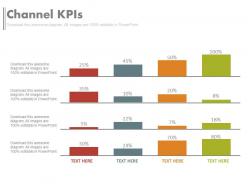 Ppts channel percentage kpis key performance indicator evaluate success powerpoint slides
This PPT Template can be used by professionals for representing their business and management ideas by the means of Percentage Kpis Key Performance Indicator Evaluate presentations. You can change the color of the elements shown in the figure and also edit the text to write a short brief about your company's matters. This PPT slide is also available in full screen mode.
-
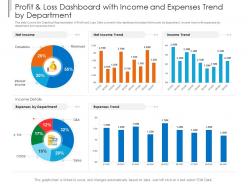 Profit and loss dashboard with income and expenses trend by department powerpoint template
This slide Covers the Graphical Representation of Profit and Loss. Data covered in this dashboard includes Net income by department, Income trend with expenses by department and expenses trend. This is a Profit And Loss Dashboard With Income And Expenses Trend By Department Powerpoint Template drafted with a diverse set of graphics, that can be reformulated and edited as per your needs and requirements. Just download it in your system and make use of it in PowerPoint or Google Slides, depending upon your presentation preferences.
-
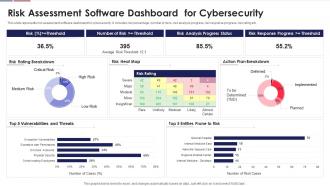 Risk Assessment Software Dashboard For Cybersecurity
This slide represents risk assessment software dashboard for cybersecurity. It includes risk percentage, number of risks, risk analysis progress, risk response progress, risk rating etc. Introducing our Risk Assessment Software Dashboard For Cybersecurity set of slides. The topics discussed in these slides are Critical Risk, Implemented, Breakdown, Risk Rating, Risk Analysis. This is an immediately available PowerPoint presentation that can be conveniently customized. Download it and convince your audience.
-
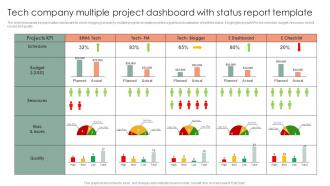 Tech Company Multiple Project Dashboard With Status Report Template
The Slide Showcases A Project Status Dashboard For A Tech Blogging Companys Multiple Projects, Template Provides A Graphical Visualisation Of Portfolio Status. It Highlights Project Kpis Like Schedule, Budget, Resources, Risks And Issues And Quality. Presenting Our Well Structured Tech Company Multiple Project Dashboard With Status Report Template. The Topics Discussed In This Slide Are Dashboard, Graphical, Visualisation. This Is An Instantly Available Powerpoint Presentation That Can Be Edited Conveniently. Download It Right Away And Captivate Your Audience.
-
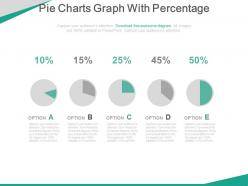 Pie Charts Graph With Percentage Analysis Powerpoint Slides
Icons can be resized and colored. Color, style and position can be standardized, supports font size which can be read from a distance. PPT slide is compatible with Microsoft 2010 and 2013 versions. Beneficial for businessman, representatives of big or small organizations for setting the business or meeting agendas for analysis. Background in PPT graphic is subtle and consistent to avoid presentation look flashy or vibrant.
-
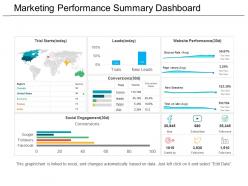 Marketing performance summary dashboard snapshot ppt templates
Presenting marketing performance summary dashboard snapshot PPT templates PPT slide. Presentation can be viewed on widescreen as the visuals do not pixelate. All the elements of the slide background can be tailored to individual needs. The presentation template can be incorporated in any of the desired format (JPEG/PDF) Guidance for editing of the PPT visual diagram is provided. Easy to edit and customize PPT graphics. Compatible with all software and can be saved in any format (JPEG/JPG/PDF).
-
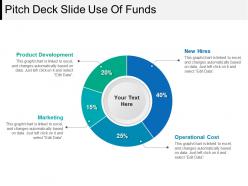 Pitch deck slide use of funds powerpoint show
Presenting Pitch Deck Slide Use Of Funds PowerPoint Show. You can make the necessary alterations in the font color, font size, and font style of the slide as it is entirely customizable. The color of the text and background can be formatted. You can add or edit text anywhere in the PowerPoint template. Its compatibility with Google Slides makes it accessible at once. You can transform and save the slide in PDF and JPG formats as well. Get this high-quality slide to add value to your presentation and present it in front of thousands of people on standard screen and widescreen.
-
 Financial Projection Business Model Of Twilio BMC SS
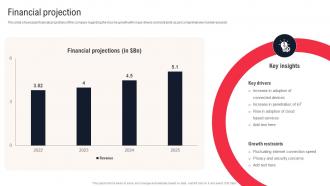
This slide showcases financial projections of the company regarding the income growth with major drivers and restraints as per comprehensive market research. Deliver an outstanding presentation on the topic using this Financial Projection Business Model Of Twilio BMC SS. Dispense information and present a thorough explanation of Financial Projections, 2022 To 2024, Increase Penetration using the slides given. This template can be altered and personalized to fit your needs. It is also available for immediate download. So grab it now.
-
 Call Center Team Quality Control Dashboard Snapshot With Total Evaluations
This graph or chart is linked to excel, and changes automatically based on data. Just left click on it and select edit data. Introducing our Call Center Team Quality Control Dashboard Snapshot With Total Evaluations set of slides. The topics discussed in these slides are Quality Assurance Summary, Total Evaluations, Team Average Score, Perfect Scores. This is an immediately available PowerPoint presentation that can be conveniently customized. Download it and convince your audience.
-
 Software Product Testing Kpi Dashboard With Average Defects
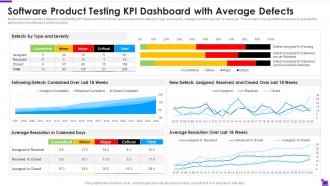
Mentioned slide indicates software product testing KPI dashboard which shows various aspects like defects by type and severity, average solution over last 18 weeks etc. These metrics can assist the developers to evaluate the performance of software by performing test. Introducing our Software Product Testing Kpi Dashboard With Average Defects set of slides. The topics discussed in these slides are Defects By Type And Severity, Average Resolution Calendar Days, Following Defects Combined Over Last 18 Weeks. This is an immediately available PowerPoint presentation that can be conveniently customized. Download it and convince your audience.


