Charts, Graphs PowerPoint Designs, Presentation Charts Designs & PPT Graphics
- Sub Categories
-
- Arrows and Targets
- Bullet and Text Slides
- Charts and Graphs
- Circular Cycle Diagrams
- Concepts and Shapes
- Custom Flat Designs
- Dashboards and Measuring
- Flow Process
- Funnels
- Gears
- Growth
- Harvey Balls
- Idea Innovation and Light Bulbs
- Leadership
- Linear Process Diagrams
- Magnifying Glass
- Misc Other Graphics
- Opportunity and Handshake
- Organization Charts
- Puzzles
- Pyramids
- Roadmaps and Timelines
- Silhouettes
- Steps
- Strategic Planning Analysis
- SWOT Analysis
- Tables and Matrix
- Teamwork
- Technology and Communication
- Venn Diagrams
- Visuals and Illustrations
-
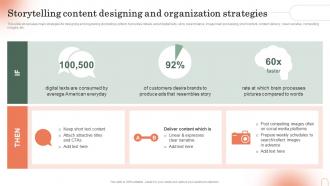 Storytelling Content Designing And Organization Strategies Emotional Branding Strategy
Deliver an outstanding presentation on the topic using this Storytelling Content Designing And Organization Strategies Emotional Branding Strategy. Dispense information and present a thorough explanation of American Everyday, Produce Resembles, Linear Expresses using the slides given. This template can be altered and personalized to fit your needs. It is also available for immediate download. So grab it now.
-
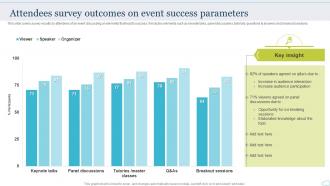 Attendees Survey Outcomes On Event Success Parameters
This slide covers survey results by attendees of an event discussing on elements that lead to success. It includes elements such as keynote talks, panel discussions, tutorials, questions and answers and breakout sessions. Introducing our Attendees Survey Outcomes On Event Success Parameters set of slides. The topics discussed in these slides are Attendees Survey Outcomes, Event Success Parameters. This is an immediately available PowerPoint presentation that can be conveniently customized. Download it and convince your audience.
-
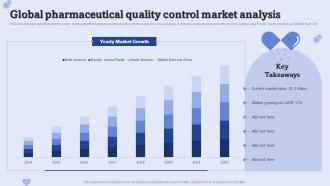 Global Pharmaceutical Quality Control Market Analysis
This slide displays statistical report for yearly market growth for pharmaceutical quality control industry for various regions. It includes locations such as North America, Europe, Asia Pacific, South America and Middle East, etc. Introducing our Global Pharmaceutical Quality Control Market Analysis set of slides. The topics discussed in these slides are Global Pharmaceutical, Quality Control, Market Analysis. This is an immediately available PowerPoint presentation that can be conveniently customized. Download it and convince your audience.
-
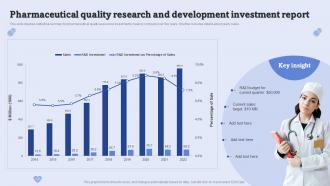 Pharmaceutical Quality Research And Development Investment Report
This slide displays statistical summary for pharmaceutical quality assurance investments made by company over the years. It further includes details about yearly sales. Introducing our Pharmaceutical Quality Research And Development Investment Report set of slides. The topics discussed in these slides are Pharmaceutical, Quality Research, Development, Investment Report. This is an immediately available PowerPoint presentation that can be conveniently customized. Download it and convince your audience.
-
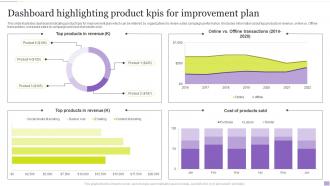 Dashboard Highlighting Product KPIS For Improvement Plan
This slide illustrates dashboard indicating product kpis for improvement plan which can be referred by organizations to review sales campaign performance. It includes information about top products in revenue, online vs. Offline transactions, increased sales by campaign and cost of products sold. Introducing our Dashboard Highlighting Product KPIS For Improvement Plan set of slides. The topics discussed in these slides are Dashboard Highlighting Product, KPIS, Improvement Plan. This is an immediately available PowerPoint presentation that can be conveniently customized. Download it and convince your audience.
-
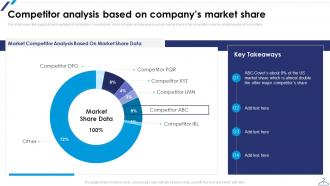 Competitor Analysis Based On Companys Market Share Ppt Inspiration
This slide covers the graphical representation of competitors market share. It also includes key takeaways such as market share of top competitors which is almost double of most others. Present the topic in a bit more detail with this Competitor Analysis Based On Companys Market Share Ppt Inspiration. Use it as a tool for discussion and navigation on Market Competitor, Analysis Based, Market Share Data. This template is free to edit as deemed fit for your organization. Therefore download it now.
-
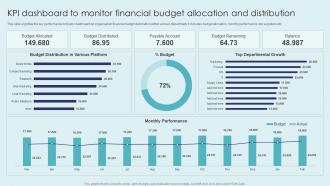 KPI Dashboard To Monitor Financial Budget Allocation And Distribution
This slide signifies the key performance indicator dashboard on organisation financial budget distribution within various department. It includes budget allocation, monthly performance, top suppliers etc.Introducing our KPI Dashboard To Monitor Financial Budget Allocation And Distribution set of slides. The topics discussed in these slides are Budget Remaining, Payable Account, Budget Distributed, Budget Allocated. This is an immediately available PowerPoint presentation that can be conveniently customized. Download it and convince your audience.
-
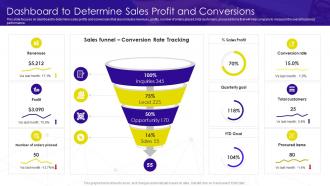 Implementation Business Process Transformation Dashboard To Determine Sales Profit And Conversions
This slide focuses on dashboard to determine sales profits and conversions that also includes revenues, profits, number of orders placed, total customers, procured items that will help company to measure the overall business performance. Deliver an outstanding presentation on the topic using this Implementation Business Process Transformation Dashboard To Determine Sales Profit And Conversions. Dispense information and present a thorough explanation of Dashboard, Conversions, Measure using the slides given. This template can be altered and personalized to fit your needs. It is also available for immediate download. So grab it now.
-
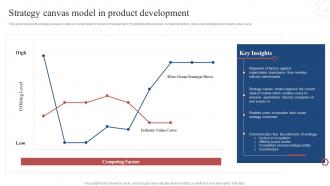 Product Development Plan Strategy Canvas Model In Product Development
This slide represents strategy canvas to capture market state for product management. It highlights offering level, competing factors, blue ocean strategy and industry value curve. Present the topic in a bit more detail with this Product Development Plan Strategy Canvas Model In Product Development. Use it as a tool for discussion and navigation on Strategy, Product, Development. This template is free to edit as deemed fit for your organization. Therefore download it now.
-
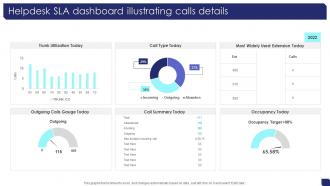 Helpdesk SLA Dashboard Illustrating Calls Details
Introducing our Helpdesk SLA Dashboard Illustrating Calls Details set of slides. The topics discussed in these slides are Trunk Utilization Today, Call Type Today, Most Widely. This is an immediately available PowerPoint presentation that can be conveniently customized. Download it and convince your audience.
-
 SLA Dashboard Indicating Top Week Performers
Introducing our SLA Dashboard Indicating Top Week Performers set of slides. The topics discussed in these slides are Dashboard Indicating, Top Week Performers, Canceled. This is an immediately available PowerPoint presentation that can be conveniently customized. Download it and convince your audience.
-
 Issues Arising Due To Ineffective Hr Communication Hr Communication Strategies Employee Engagement
This slide depicts the issues faced by organizations due to ineffective HR communication. The issues covered are decrease in productivity and increase in employee turnover. Present the topic in a bit more detail with this Issues Arising Due To Ineffective Hr Communication Hr Communication Strategies Employee Engagement. Use it as a tool for discussion and navigation on Communication, Ineffective, Productivity Decreased. This template is free to edit as deemed fit for your organization. Therefore download it now.
-
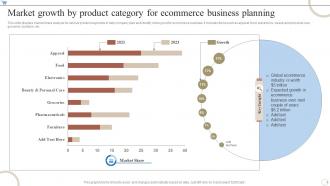 Market Growth By Product Category For Ecommerce Business Planning
This slide displays market share analysis for various product segments to help company plan and identify niche good for ecommerce business. It includes items such as apparel, food, electronics, beauty and personal care, groceries, furniture, etc. Presenting our well-structured Market Growth By Product Category For Ecommerce Business Planning. The topics discussed in this slide are Market Growth, Product Category, Ecommerce Business Planning. This is an instantly available PowerPoint presentation that can be edited conveniently. Download it right away and captivate your audience.
-
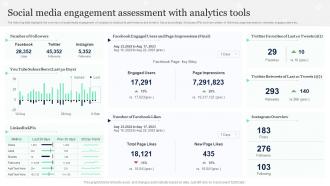 Social Media Engagement Assessment With Analytics Tools
The following slide highlights the overview of social media engagement of company to analyze its performance and invest in future accordingly. It includes KPIs such as number of followers, page impressions, retweets, engaged users etc. Introducing our Social Media Engagement Assessment With Analytics Tools set of slides. The topics discussed in these slides are Social Media Engagement, Assessment, Analytics Tools. This is an immediately available PowerPoint presentation that can be conveniently customized. Download it and convince your audience.
-
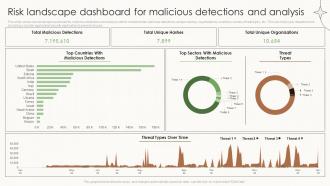 Risk Landscape Dashboard For Malicious Detections And Analysis
Presenting our well structured Risk Landscape Dashboard For Malicious Detections And Analysis. The topics discussed in this slide are Risk Landscape Dashboard, Cyber Attacks Analysis. This is an instantly available PowerPoint presentation that can be edited conveniently. Download it right away and captivate your audience.
-
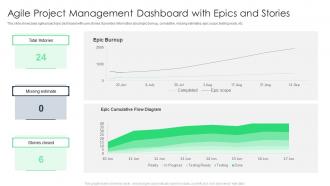 Agile Project Management Dashboard With Epics And Stories
This slide showcases agile project epic dashboard with user stories. It provides information about epic burn up, cumulative, missing estimates, epic scope, testing ready, etc. Presenting our well structured Agile Project Management Dashboard With Epics And Stories. The topics discussed in this slide are Dashboard, Epics And Stories. This is an instantly available PowerPoint presentation that can be edited conveniently. Download it right away and captivate your audience.
-
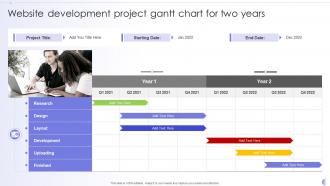 Website Development Project Gantt Chart For Two Years
Plan, track and synchronize the most important tasks of any project with this exemplary Website Development Project Gantt Chart For Two Years. This lucrative template can be used to manage the project efficiently. You can enter all the vital components of the project like the start date, duration, and status of each task to keep the owners accountability in check. Create a highly proficient scheduling plan and measure its progress with this elaborative layout. In addition, you can add your activities in the taskbar included in this template and edit it to handle your project effectively. This template is ideal for project management, business plans, student projects, and assignments. So download and captivate your audience.
-
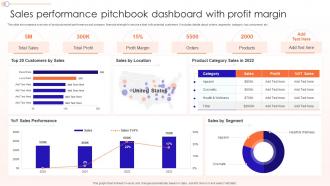 Sales Performance Pitchbook Dashboard With Profit Margin
This slide showcases a overview of products market performance and company financial strength to secure a deal with potential customers. It includes details about orders, segments, category, top consumers, etc. Presenting our well structured Sales Performance Pitchbook Dashboard With Profit Margin. The topics discussed in this slide are Dashboard With Profit Margin, Sales Performance. This is an instantly available PowerPoint presentation that can be edited conveniently. Download it right away and captivate your audience.
-
 Techniques To Optimize SEM Website Traffic Analysis With KPI Dashboard
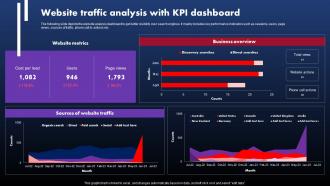
The following slide depicts the website analysis dashboard to get better visibility over search engines. It mainly includes key performance indicators such as sessions, users, page views, sources of traffic, phone call to actions etc. Deliver an outstanding presentation on the topic using this Techniques To Optimize SEM Website Traffic Analysis With KPI Dashboard. Dispense information and present a thorough explanation of Website Traffic Analysis, KPI Dashboard, Performance Indicators using the slides given. This template can be altered and personalized to fit your needs. It is also available for immediate download. So grab it now.
-
 Website Optimization Activities Budget Implementing Hospital Management Strategies To Enhance Strategy SS
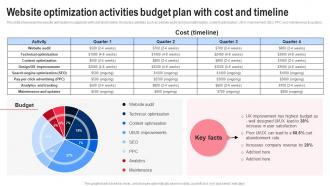
This slide showcases the website optimization budget plan with cost and timeline. It includes activities such as website audit, technical optimization, content optimization, UIUX improvement, SEO, PPC and maintenance And updates. Present the topic in a bit more detail with this Website Optimization Activities Budget Implementing Hospital Management Strategies To Enhance Strategy SS. Use it as a tool for discussion and navigation on Website Audit, Technical Optimization, Content Optimization. This template is free to edit as deemed fit for your organization. Therefore download it now.
-
 Allocation Of Funds Alluva Investor Funding Elevator Pitch Deck
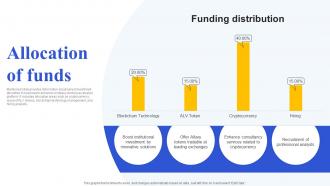
Mentioned slide provides information about asked investment allocation in business to enhance company working as analyst platform. It includes allocation areas such as cryptocurrency, issue of ALV tokens, blockchain technology management, and hiring analysts. Deliver an outstanding presentation on the topic using this Allocation Of Funds Alluva Investor Funding Elevator Pitch Deck. Dispense information and present a thorough explanation of Innovative Solutions, Leading Exchanges using the slides given. This template can be altered and personalized to fit your needs. It is also available for immediate download. So grab it now.
-
 IOT Remote Monitoring And Device Management
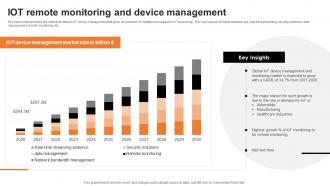
The below slide provides the statistical data for IoT device management that gives an overview of multiple use cases for IoT technology. The major areas of implementation are real time streaming, security solutions, data management, remote monitoring, etc. Introducing our IOT Remote Monitoring And Device Management set of slides. The topics discussed in these slides are Management Market Size, Device Management. This is an immediately available PowerPoint presentation that can be conveniently customized. Download it and convince your audience.
-
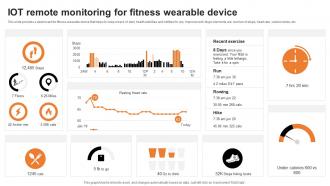 IOT Remote Monitoring For Fitness Wearable Device
This slide provides a dashboard for fitness wearable device that helps to keep a track of daily health activities and notifies for any improvement. Major elements are number of steps, heart rate, calorie intake, etc. Introducing our IOT Remote Monitoring For Fitness Wearable Device set of slides. The topics discussed in these slides are Recent Exercise, Resting Heart Rate. This is an immediately available PowerPoint presentation that can be conveniently customized. Download it and convince your audience.
-
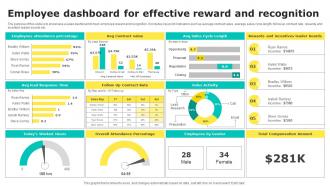 Employee Dashboard For Effective Reward And Recognition
The purpose of this slide is to showcase a sales dashboard to track employee reward and recognition. It includes key point indicators such as average contract value, average sales cycle length, follow up contract rate, rewards and incentive leader boards etc. Presenting our well structured Employee Dashboard For Effective Reward And Recognition. The topics discussed in this slide are Employees Attendance Percentage, Avg Sales Cycle Length.This is an instantly available PowerPoint presentation that can be edited conveniently. Download it right away and captivate your audience.
-
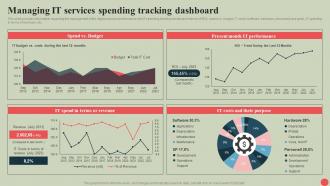 Government Digital Services Managing IT Services Spending Tracking Dashboard
This slide provides information regarding the management of the digital services performance and IT spending tracking dashboard in terms of ROI, spend vs. budget, IT costs software, hardware, personnel and goals, IT spending in terms of revenues, etc. Deliver an outstanding presentation on the topic using this Government Digital Services Managing IT Services Spending Tracking Dashboard. Dispense information and present a thorough explanation of Managing IT Services, Spending Tracking Dashboard, IT Spending using the slides given. This template can be altered and personalized to fit your needs. It is also available for immediate download. So grab it now.
-
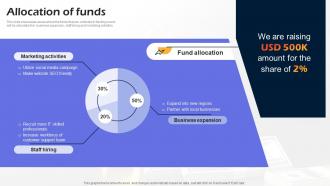 Allocation Of Funds Amixr Investor Funding Elevator Pitch Deck
This slide showcases areas where the funds that are collected in funding round will be allocated like- business expansion, staff hiring and marketing activities. Present the topic in a bit more detail with this Allocation Of Funds Amixr Investor Funding Elevator Pitch Deck. Use it as a tool for discussion and navigation on Marketing Activities, Staff Hiring, Business Expansion. This template is free to edit as deemed fit for your organization. Therefore download it now.
-
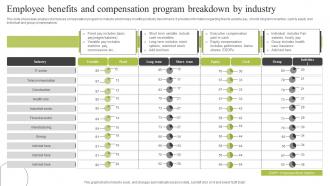 Employee Benefits And Compensation Program Breakdown By Industry
This slide showcases analysis of employee compensation program by industry which helps in setting industry benchmarks. It provides information regarding fixed and variable pay, short and long term incentive, cash and equity and individual and group compensations. Presenting our well structured Employee Benefits And Compensation Program Breakdown By Industry. The topics discussed in this slide are Benefits, Employee, Program. This is an instantly available PowerPoint presentation that can be edited conveniently. Download it right away and captivate your audience.
-
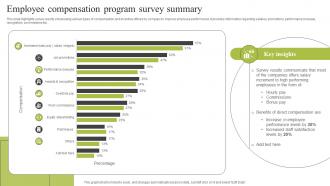 Employee Compensation Program Survey Summary
This slide highlights survey results showcasing various types of compensation and incentive offered by company to improve employee performance. It provides information regarding salaries, promotions, performance bonuses, recognition, commissions etc. Introducing our Employee Compensation Program Survey Summary set of slides. The topics discussed in these slides are Employee, Summary, Program. This is an immediately available PowerPoint presentation that can be conveniently customized. Download it and convince your audience.
-
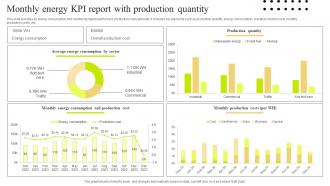 Monthly Energy KPI Report With Production Quantity
This slide provides an energy consumption and monitoring dashboard to track production costs annually. It includes key elements such as production quantity, energy consumption, overall production cost, monthly production costs, etc. Introducing our Monthly Energy KPI Report With Production Quantity set of slides. The topics discussed in these slides are Energy, Report, Production. This is an immediately available PowerPoint presentation that can be conveniently customized. Download it and convince your audience.
-
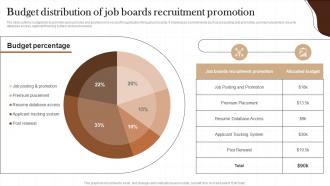 Budget Distribution Of Job Boards Non Profit Recruitment Strategy SS
The slide outlines budget plan to promote open job roles and positions in a non profit organization through job boards. It showcases cost elements such as job posting and promotion, premium placement, resume database access, applicant tracking system and post renewal. Present the topic in a bit more detail with this Budget Distribution Of Job Boards Non Profit Recruitment Strategy SS. Use it as a tool for discussion and navigation on Premium Placement, Resume Database Access. This template is free to edit as deemed fit for your organization. Therefore download it now.
-
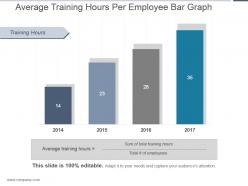 Average training hours per employee bar graph ppt design
Presenting average training hours per employee bar graph ppt design. This is a average training hours per employee bar graph ppt design. This is a four stage process. The stages in this process are training hours, average training hours, sum of total training hours, total of employees.
-
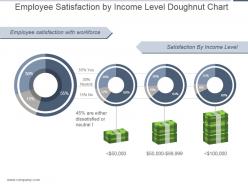 Employee satisfaction by income level doughnut chart ppt slide
Presenting employee satisfaction by income level doughnut chart ppt slide. This is a employee satisfaction by income level doughnut chart ppt slide. This is a four stage process. The stages in this process are employee satisfaction with workforce, satisfaction by income level, 55 percent yes, neutral, 15 percent no, 45 percent are either dissatisfied or neutral.
-
 Business model and revenue model powerpoint shapes
Presenting business model and revenue model powerpoint shapes. This is a business model and revenue model powerpoint shapes. This is a three stage process. The stages in this process are pie, finance, percentage, business, marketing.
-
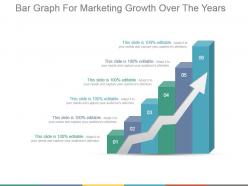 Bar graph for marketing growth over the years ppt slide styles
Introducing marketing growth over years PowerPoint slides. Contemporary styled PowerPoint visuals of tremendous quality and graphics. Easily exportable to PDF or JPG file compositions. Abundant space option to insert company emblem or trademark with the Presentation diagrams. 100% rebuild able visuals, symbols, texts, pictures etc. Easy to project on large screen with an immense quality Presentation graphics. Option to insert title and subtitle accordingly. Versant with all Google Slides.
-
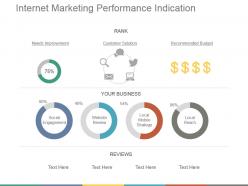 Internet marketing performance indication powerpoint guide
Presenting internet marketing performance indication powerpoint guide. This is a internet marketing performance indication powerpoint guide. This is a four stage process. The stages in this process are needs improvement, customer solution, recommended budget, social engagement, website review, local mobile strategy, local , local reach, reviews, rank.
-
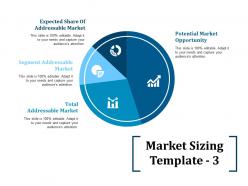 Market sizing ppt file graphics pictures
Presenting this set of slides with name - Market Sizing Ppt File Graphics Pictures. This is a four stage process. The stages in this process are Potential Market Opportunity, Total Addressable Market, Segment Addressable Market.
-
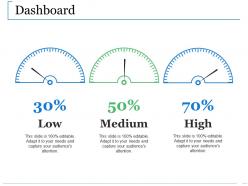 Dashboard snapshot ppt slides professional
Presenting this set of slides with name - Dashboard Snapshot Ppt Slides Professional. This is a three stage process. The stages in this process are Low, Medium, High, Dashboard, Business.
-
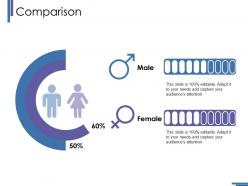 Comparison ppt ideas slide
Presenting this set of slides with name - Comparison Ppt Ideas Slide. This is a two stage process. The stages in this process are Male, Female, Comparison, Percentage, Finance.
-
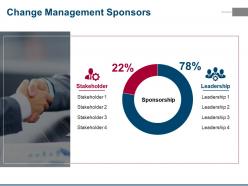 Change management sponsors ppt summary
Presenting this set of slides with name - Change Management Sponsors Ppt Summary. This is a two stage process. The stages in this process are Sponsorship, Stakeholder, Leadership, Management, Business.
-
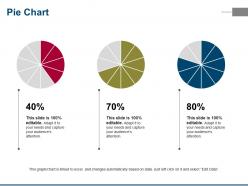 Pie chart powerpoint slide design templates
Presenting this set of slides with name - Pie Chart Powerpoint Slide Design Templates. This is a three stage process. The stages in this process are Pie Chart, Marketing, Analysis, Business, Strategy.
-
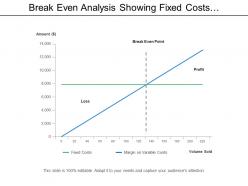 Break even analysis showing fixed costs with margin on variable costs
Presenting this set of slides with name - Break Even Analysis Showing Fixed Costs With Margin On Variable Costs. This is a two stage process. The stages in this process are Break Even Analysis, Break Even Point, Break Even Level.
-
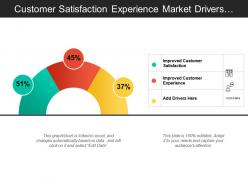 Customer satisfaction experience market drivers analysis meter with icons
Presenting this set of slides with name - Customer Satisfaction Experience Market Drivers Analysis Meter With Icons. This is a three stage process. The stages in this process are Growth Drivers, Growth Opportunity, Market Drivers.
-
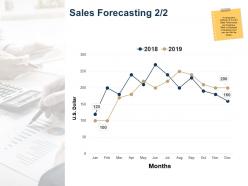 Sales forecasting ppt powerpoint presentation outline information
Presenting this set of slides with name - Sales Forecasting Ppt Powerpoint Presentation Outline Information. This is a two stages process. The stages in this process are Line Chart, Finance, Marketing, Business, Analysis.
-
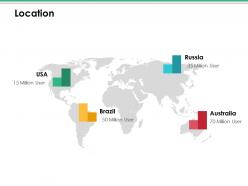 Location ppt infographics guidelines
Presenting this set of slides with name - Location Ppt Infographics Guidelines. This is a four stage process. The stages in this process are Business, Management, Strategy, Analysis, Location.
-
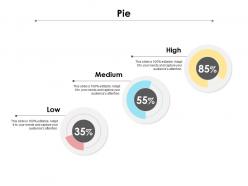 Pie ppt powerpoint presentation show inspiration
Presenting this set of slides with name - Pie Ppt Powerpoint Presentation Show Inspiration. This is a three stage process. The stages in this process are Finance, Business, Marketing, Management, Analysis.
-
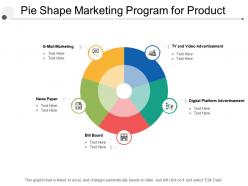 Pie shape marketing program for product
Presenting this set of slides with name - Pie Shape Marketing Program For Product. This is a five stage process. The stages in this process are Pie Charts, Marketing, Business.
-
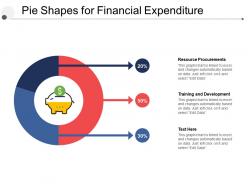 Pie shapes for financial expenditure
Presenting this set of slides with name - Pie Shapes For Financial Expenditure. This is a three stage process. The stages in this process are Pie Charts, Marketing, Business.
-
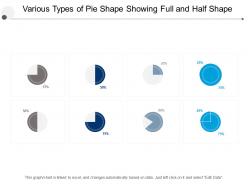 Various types of pie shape showing full and half shape
Presenting this set of slides with name - Various Types Of Pie Shape Showing Full And Half Shape. This is a eight stage process. The stages in this process are Pie Charts, Marketing, Business.
-
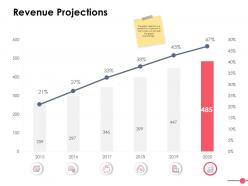 Revenue projections ppt powerpoint presentation file graphics download
Presenting this set of slides with name - Revenue Projections Ppt Powerpoint Presentation File Graphics Download. This is a six stage process. The stages in this process are Finance, Analysis, Business, Investment, Marketing.
-
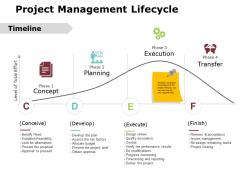 Project management lifecycle ppt powerpoint presentation gallery format
Presenting this set of slides with name - Project Management Lifecycle Ppt Powerpoint Presentation Gallery Format. This is a four stage process. The stages in this process are Business, Management, Strategy, Analysis, Icons.
-
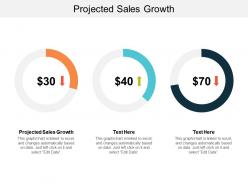 Projected sales growth ppt powerpoint presentation infographic template show cpb
Presenting this set of slides with name - Projected Sales Growth Ppt Powerpoint Presentation Infographic Template Show Cpb. This is an editable three stages graphic that deals with topics like Projected Sales Growth to help convey your message better graphically. This product is a premium product available for immediate download, and is 100 percent editable in Powerpoint. Download this now and use it in your presentations to impress your audience.
-
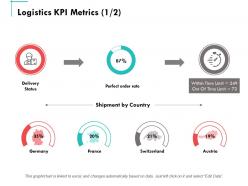 Logistics kpi metrics ppt powerpoint presentation summary samples
Presenting this set of slides with name - Logistics Kpi Metrics Ppt Powerpoint Presentation Summary Samples. This is a seven stages process. The stages in this process are Finance, Marketing, Management, Investment, Analysis.
-
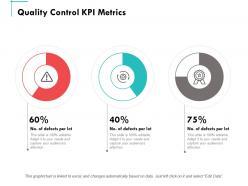 Quality control kpi metrics ppt powerpoint presentation summary elements
Presenting this set of slides with name - Quality Control Kpi Metrics Ppt Powerpoint Presentation Summary Elements. This is a three stages process. The stages in this process are Finance, Marketing, Management, Investment, Analysis.
-
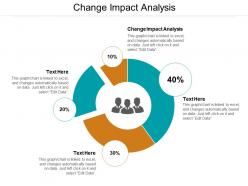 Change impact analysis ppt powerpoint presentation outline rules cpb
Presenting this set of slides with name - Change Impact Analysis Ppt Powerpoint Presentation Outline Rules Cpb. This is an editable four stages graphic that deals with topics like Change Impact Analysis to help convey your message better graphically. This product is a premium product available for immediate download, and is 100 percent editable in Powerpoint. Download this now and use it in your presentations to impress your audience.
-
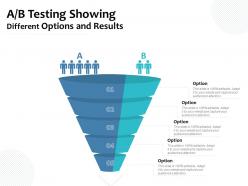 Ab testing showing different options and results
Presenting this set of slides with name AB Testing Showing Different Options And Results. This is a five stage process. The stages in this process are AB Testing, Graphical Representation, Social. This is a completely editable PowerPoint presentation and is available for immediate download. Download now and impress your audience.
-
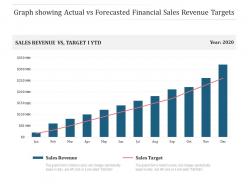 Graph showing actual vs forecasted financial sales revenue targets
Presenting this set of slides with name Graph Showing Actual Vs Forecasted Financial Sales Revenue Targets. The topics discussed in these slides are Sales Revenue, Sales Target. This is a completely editable PowerPoint presentation and is available for immediate download. Download now and impress your audience.
-
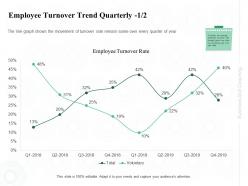 Employee turnover trend quarterly movement ppt powerpoint presentation summary diagrams
The line graph shows the movement of turnover rate remain same over every quarter of year. Presenting this set of slides with name Employee Turnover Trend Quarterly Movement Ppt Powerpoint Presentation Summary Diagrams. The topics discussed in these slides are Employee, Graph, Turnover Rate. This is a completely editable PowerPoint presentation and is available for immediate download. Download now and impress your audience.
-
 Business performance dashboard rate machine ppt powerpoint presentation file ideas
Following dashboard displays information about business performance. It covers production rate, overall plant productivity, lost units, machine productivity and operators availability. Presenting this set of slides with name Business Performance Dashboard Rate Machine Ppt Powerpoint Presentation File Ideas. The topics discussed in these slides are Production, Cost, Target. This is a completely editable PowerPoint presentation and is available for immediate download. Download now and impress your audience.
-
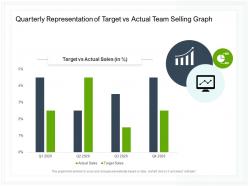 Quarterly representation of target vs actual team selling graph
Presenting this set of slides with name Quarterly Representation Of Target Vs Actual Team Selling Graph. The topics discussed in these slide is Quarterly Representation Of Target Vs Actual Team Selling Graph. This is a completely editable PowerPoint presentation and is available for immediate download. Download now and impress your audience.
-
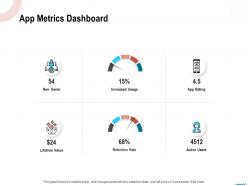 App metrics dashboard active users ppt powerpoint presentation slides layouts
Presenting this set of slides with name App Metrics Dashboard Active Users Ppt Powerpoint Presentation Slides Layouts. The topics discussed in these slides are Increased Usage, App Rating, Retention Rate, Lifetime Value. This is a completely editable PowerPoint presentation and is available for immediate download. Download now and impress your audience.


