Charts, Graphs PowerPoint Designs, Presentation Charts Designs & PPT Graphics
- Sub Categories
-
- Arrows and Targets
- Bullet and Text Slides
- Charts and Graphs
- Circular Cycle Diagrams
- Concepts and Shapes
- Custom Flat Designs
- Dashboards and Measuring
- Flow Process
- Funnels
- Gears
- Growth
- Harvey Balls
- Idea Innovation and Light Bulbs
- Leadership
- Linear Process Diagrams
- Magnifying Glass
- Misc Other Graphics
- Opportunity and Handshake
- Organization Charts
- Puzzles
- Pyramids
- Roadmaps and Timelines
- Silhouettes
- Steps
- Strategic Planning Analysis
- SWOT Analysis
- Tables and Matrix
- Teamwork
- Technology and Communication
- Venn Diagrams
- Visuals and Illustrations
-
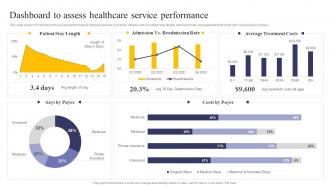 Integrating Health Information System Dashboard To Assess Healthcare Service Performance
This slide covers KPI dashboard to assess performance f medical services. It involves details such as patient stay length, admission rate, average treatment costs and cost analysis of stays. Deliver an outstanding presentation on the topic using this Integrating Health Information System Dashboard To Assess Healthcare Service Performance. Dispense information and present a thorough explanation of Dashboard, Healthcare, Service using the slides given. This template can be altered and personalized to fit your needs. It is also available for immediate download. So grab it now.
-
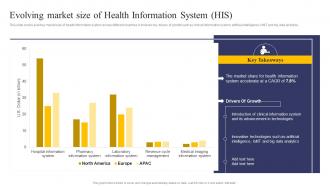 Integrating Health Information System Evolving Market Size Of Health Information System HIS
This slide covers evolving market size of health information system across different countries. It involves key drivers of growth such as clinical information system, artificial intelligence, IoMT and big data analytics. Deliver an outstanding presentation on the topic using this Integrating Health Information System Evolving Market Size Of Health Information System HIS. Dispense information and present a thorough explanation of Market, System, Information using the slides given. This template can be altered and personalized to fit your needs. It is also available for immediate download. So grab it now.
-
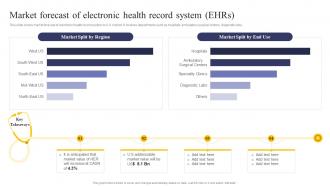 Integrating Health Information System Market Forecast Of Electronic Health Record System Ehrs
This slide covers market forecast of electronic health record system in U.S market. It involves departments such as hospitals, ambulatory surgical centers, diagnostic labs. Present the topic in a bit more detail with this Integrating Health Information System Market Forecast Of Electronic Health Record System Ehrs. Use it as a tool for discussion and navigation on Electronic, System, Market. This template is free to edit as deemed fit for your organization. Therefore download it now.
-
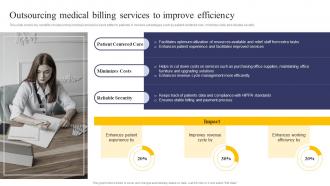 Integrating Health Information System Outsourcing Medical Billing Services To Improve Efficiency
This slide covers key benefits of outsourcing medical services to serve better to patients. It involves advantages such as patient centered care, minimize costs and reliable security. Present the topic in a bit more detail with this Integrating Health Information System Outsourcing Medical Billing Services To Improve Efficiency. Use it as a tool for discussion and navigation on Patient Centered Care, Minimizes Costs, Reliable Security. This template is free to edit as deemed fit for your organization. Therefore download it now.
-
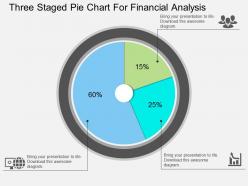 Cu three staged pie chart for financial analysis flat powerpoint design
Presenting cu three staged pie chart for financial analysis flat powerpoint design. Three staged pie chart has been used to craft this power point template diagram. This PPT diagram contains the concept of financial analysis representation. Use this PPT diagram for business and finance related presentations.
-
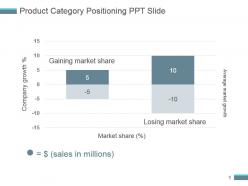 Product category positioning ppt slide
Presenting product category positioning ppt slide. This is a product category positioning ppt slide. This is a two stage process. The stages in this process are gaining market share, losing market share, average market growth, company growth, market share, sales in millions.
-
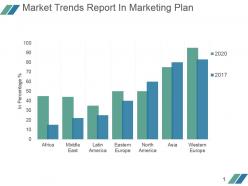 Market trends report in marketing plan powerpoint slide designs
Presenting market trends report in marketing plan powerpoint slide designs. This is a market trends report in marketing plan powerpoint slide designs. This is a seven stage process. The stages in this process are africa, middle east, latin america, eastern europe, north america, asia, western europe, in percentage.
-
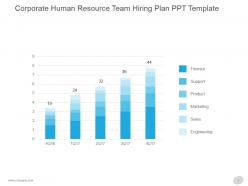 Corporate human resource team hiring plan ppt template
Presenting corporate human resource team hiring plan ppt template. This is a corporate human resource team hiring plan ppt template. This is a five stage process. The stages in this process are finance, support, product, marketing, sales, engineering.
-
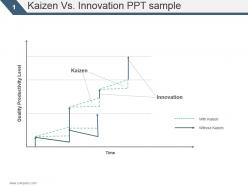 Kaizen vs innovation ppt sample
Presenting kaizen vs innovation ppt sample. This is a kaizen vs innovation ppt sample. This is a three stage process. The stages in this process are quality productivity level, kaizen, innovation, without kaizen, with kaizen.
-
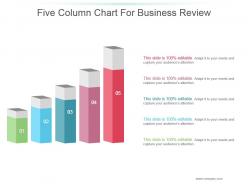 Five column chart for business review powerpoint slide designs
Presenting five column chart for business review powerpoint slide designs. This is a five column chart for business review powerpoint slide designs. This is a five stage process. The stages in this process are business, marketing, growth, chart, management.
-
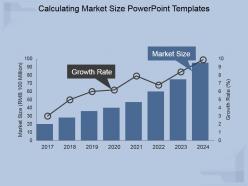 Calculating market size powerpoint templates
Presenting calculating market size powerpoint templates. This is a calculating market size powerpoint templates. This is a eight stage process. The stages in this process are growth rate, market size.
-
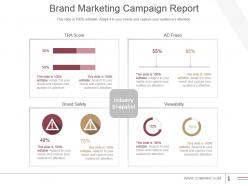 Brand marketing campaign report powerpoint guide
Presenting brand marketing campaign report powerpoint guide. This is a brand marketing campaign report powerpoint guide. This is a four stage process. The stages in this process are brand safety, industry snapshot, viewability, tra score, ad fraud.
-
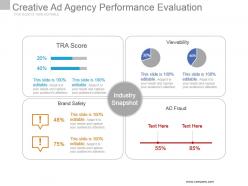 Creative ad agency performance evaluation powerpoint slide deck
Presenting creative ad agency performance evaluation powerpoint slide deck. This is a creative ad agency performance evaluation powerpoint slide deck. This is a four stage process. The stages in this process are viewability, brand safety, industry snapshot, ad fraud.
-
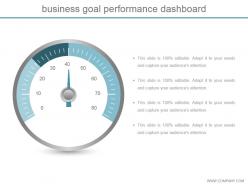 Business goal performance dashboard snapshot ppt slide styles
Presenting business goal performance dashboard ppt slide styles. This is a business goal performance dashboard snapshot ppt slide styles. This is a one stage process. The stages in this process are business, bar graph, dashboard, measure, value.
-
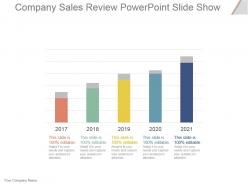 Company sales review powerpoint slide show
Presenting company sales review powerpoint slide show. This is a company sales review powerpoint slide show. This is a five stage process. The stages in this process are business,strategy,chart and graph,time planning.
-
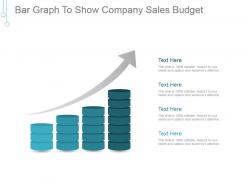 Bar graph to show company sales budget example of ppt
Presenting bar graph to show company sales budget example of ppt. This is a bar graph to show company sales budget example of ppt. This is a four stage process. The stages in this process are business, arrows, growth, marketing, success.
-
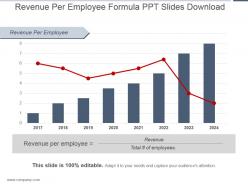 Revenue per employee formula ppt slides download
Presenting revenue per employee formula ppt slides download. This is a revenue per employee formula ppt slides download. This is a eight stage process. The stages in this process are revenue per employee, revenue, total of employees.
-
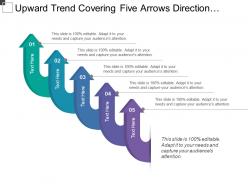 Upward trend covering five arrows direction with text holders
Presenting this set of slides with name - Upward Trend Covering Five Arrows Direction With Text Holders. This is a five stage process. The stages in this process are Upward Trends, Uptrends, Upward Arrow, Growth.
-
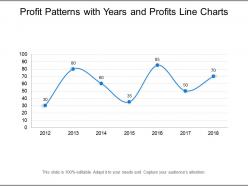 Profit patterns with years and profits line charts
Presenting this set of slides with name - Profit Patterns With Years And Profits Line Charts. This is a one stage process. The stages in this process are Profit Pattern, Profit Design, Profit Order.
-
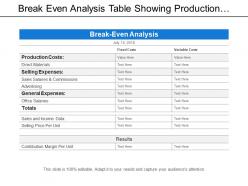 Break even analysis table showing production costs and sales
Presenting this set of slides with name - Break Even Analysis Table Showing Production Costs And Sales. This is a six stage process. The stages in this process are Break Even Analysis, Break Even Point, Break Even Level.
-
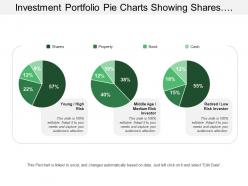 Investment portfolio pie charts showing shares property bond cash risk investor
Presenting this set of slides with name - Investment Portfolio Pie Charts Showing Shares Property Bond Cash Risk Investor. This is a three stage process. The stages in this process are Investment Portfolio, Funding Portfolio, Expenditure Portfolio.
-
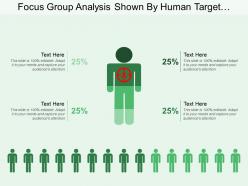 Focus group analysis shown by human target image
Presenting this set of slides with name - Focus Group Analysis Shown By Human Target Image. This is a four stage process. The stages in this process are Focus Group, Focus Team, Focus Member.
-
 Resource utilisation showing capacity budgets and plans
Presenting this set of slides with name - Resource Utilisation Showing Capacity Budgets And Plans. This is a three stage process. The stages in this process are Resource Management, Resource Utilization, Resource Allocation.
-
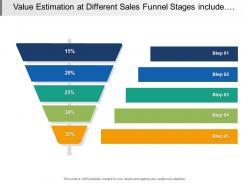 Value estimation at different sales funnel stages include five levels
Presenting this set of slides with name - Value Estimation At Different Sales Funnel Stages Include Five Levels. This is a five stage process. The stages in this process are Sales Funnel Stages, Sales Funnel Phases, Sales Funnel Steps.
-
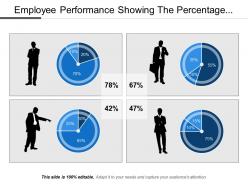 Employee performance showing the percentage with four different employee
Presenting this set of slides with name - Employee Performance Showing The Percentage With Four Different Employee. This is a four stage process. The stages in this process are Employee Performance, Employee Engagement, Employee Evaluation.
-
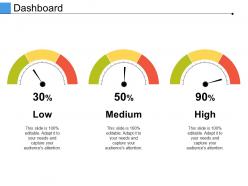 Dashboard snapshot ppt samples download
Presenting this set of slides with name - Dashboard Ppt Samples Download Snapshot. This is a three stage process. The stages in this process are Finance, Marketing, Dashboard, Planning, Speed.
-
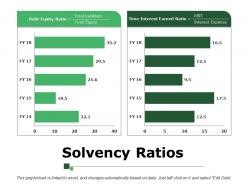 Solvency ratios powerpoint presentation
Presenting this set of slides with name - Solvency Ratios Powerpoint Presentation. This is a two stage process. The stages in this process are Solvency Ratios, Finance, Analysis, Marketing, Strategy, Business.
-
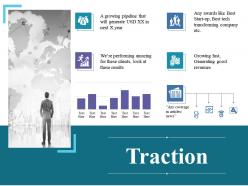 Traction ppt example file
Presenting this set of slides with name - Traction Ppt Example File. This is a six stage process. The stages in this process are Business, Traction, Marketing, Graph, Finance.
-
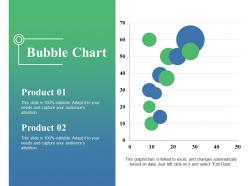 Bubble chart powerpoint slide themes
Presenting a PowerPoint slide named Bubble chart PowerPoint Slide themes. This PPT slide is available for online downloading and can be downloaded in the different editable formats such as PDF, JPG. Change the icons in the slide to convey your topic. You can choose from an array of options. Background can be set to any color to work your way. You can customize the theme in one click with a color that matches your topic of interest. The slide is Google slide friendly. You can link this graph with an excel sheet to derive data. Make your presentation look attractive with this eye-catching slide.
-
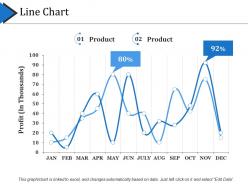 Line chart presentation powerpoint
Presenting this set of slides with name - Line Chart Presentation Powerpoint. This is a two stage process. The stages in this process are Business, Marketing, Percentage, Profit, Line Chart.
-
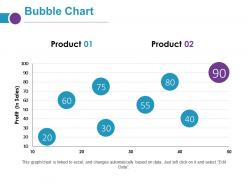 Bubble chart ppt summary background
Presenting the bubble chart PPT presentation slide. This is 100% editable PowerPoint slide. You can easily include or exclude any content or text in the slide. You can customize the slide as per your requirement. The font type, font size, colors of the slide, and the background color is customizable. You can add your company name and logo on this slide. Downloading is fast and easy at a click of a button. It is compatible with multiple Microsoft PowerPoint versions and Google Slides available both online and offline.
-
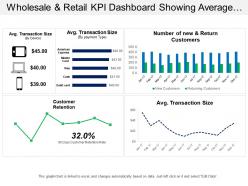 Wholesale and retail kpi dashboard showing average transaction size and customer retention
Presenting this set of slides with name - Wholesale And Retail Kpi Dashboard Showing Average Transaction Size And Customer Retention. This is a four stage process. The stages in this process are Wholesale And Retail, Extensive And Retail, Wholesale And Distribute.
-
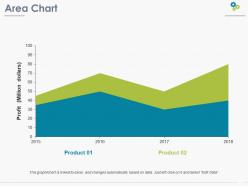 Area chart ppt pictures background images
Presenting this set of slides with name - Area Chart Ppt Pictures Background Images. This is a two stage process. The stages in this process are Profit, Area Chart, Years, Business, Marketing.
-
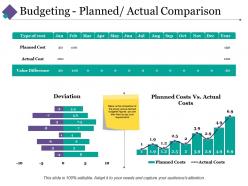 Budgeting planned actual comparison ppt pictures clipart images
Providing budgeting planned actual comparison PPT pictures clipart images. Presentation design can be shared in standard and widescreen view. High resolution ensures no pixel break even when shared with large viewers. PowerPoint template can be amended as required and transform into JPG and PDF format. Fully adjustable design with Google Slides as merge well. Ideas to share business communication effectively Easy to adapt and download with different nodes and stages.
-
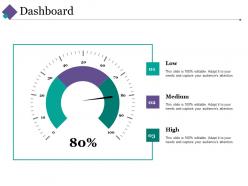 Dashboard Snapshot ppt gallery inspiration
Introducing dashboard snapshot PPT gallery inspiration design. Innovatively designed PowerPoint template is well-known with Google slides. Flexible as can be alter into PDF or JPEG formats. Ready to share and easy to download presentation slide you save time and effort. PPT design is accessible in standard and widescreen view. Color, text and font can be amended as the presentation visual is entirely adaptable. Easy to download and save into the system for later use.
-
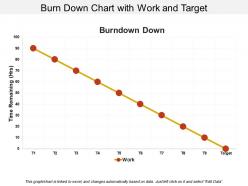 Burn down chart with work and target
Presenting this set of slides with name - Burn Down Chart With Work And Target. This is a one stage process. The stages in this process are Burn Down Chart, Agile Software Development Chart, Run Chart.
-
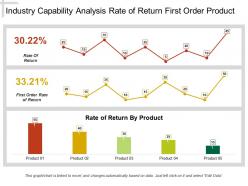 Industry capability analysis rate of return first order product
The biggest advantage of this industry capability slideshow is it’s linking to excel; you can put your business figures into excel sheet and it will automatically get changed in the charts on PPT design. The design slide is 100% editable; you can modify and personalize the design according to your business needs. The slides are compatible with Google Slides and MS PowerPoint software. Slides are fully supported on full screen and standard view.
-
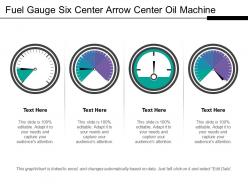 Fuel gauge six center arrow center oil machine 1
Presenting this set of slides with name - Fuel Gauge Six Center Arrow Center Oil Machine 1. This is a four stage process. The stages in this process are Fuel Gauge, Gas Gauge, Fuel Containers.
-
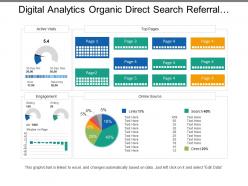 Digital analytics organic direct search referral social ppt example
Presenting this set of slides with name - Digital Analytics Organic Direct Search Referral Social Ppt Example. This is a five stage process. The stages in this process are Digital Analytics, Digital Dashboard, Digital Kpis.
-
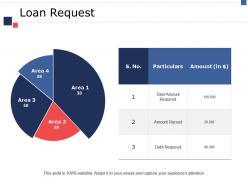 Loan request ppt inspiration information
Presenting this set of slides with name - Loan Request Ppt Inspiration Information. This is a four stage process. The stages in this process are Particulars, Area, Amount.
-
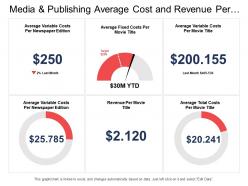 Media and publishing average cost and revenue per movie title dashboard
Presenting this set of slides with name - Media And Publishing Average Cost And Revenue Per Movie Title Dashboard. This is a six stage process. The stages in this process are Media And Publishing, Media Communication.
-
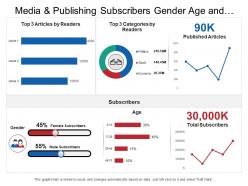 Media and publishing subscribers gender age and categories dashboard
Presenting this set of slides with name - Media And Publishing Subscribers Gender Age And Categories Dashboard. This is a six stage process. The stages in this process are Media And Publishing, Media Communication.
-
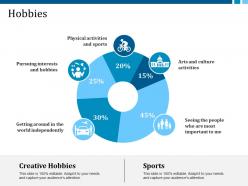 Hobbies pursuing interests and hobbies physical activities and sports
Presenting hobbies and sports PPT template. This is an astounding PowerPoint graphic which also has an immensely delineated PPT design visual narrative. All the contents, symbols, formats, and PowerPoint Image etc. are fully alterable. The PPT design is descriptive with an elasticity to restore the statistics. This PPT template is also advantageous for Human resource managers, physiologists. This is also well conversant with Google Slides.
-
 Loss image displaying money and brief case
Presenting this set of slides with name Loss Image Displaying Money And Brief Case. The topics discussed in these slides are Graph, Decline, Arrow. This is a completely editable PowerPoint presentation and is available for immediate download. Download now and impress your audience.
-
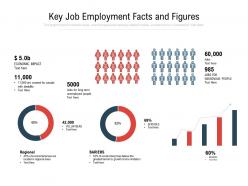 Key job employment facts and figures
Presenting this set of slides with name Key Job Employment Facts And Figures. The topics discussed in these slides are Economic, Regional, Bariers. This is a completely editable PowerPoint presentation and is available for immediate download. Download now and impress your audience.
-
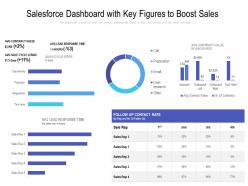 Salesforce dashboard with key figures to boost sales
Presenting this set of slides with name Salesforce Dashboard With Key Figures To Boost Sales. The topics discussed in these slides are Value, Sale, Opportunity. This is a completely editable PowerPoint presentation and is available for immediate download. Download now and impress your audience.
-
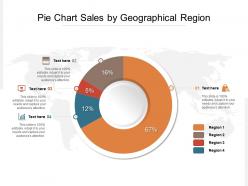 Pie chart sales by geographical region
Presenting this set of slides with name Pie Chart Sales By Geographical Region. The topics discussed in these slide is Pie Chart Sales By Geographical Region. This is a completely editable PowerPoint presentation and is available for immediate download. Download now and impress your audience.
-
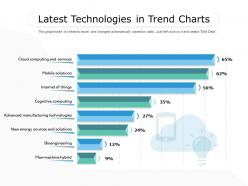 Latest technologies in trend charts
Presenting this set of slides with name Latest Technologies In Trend Charts. The topics discussed in these slides are Cloud Computing, Services, Internet Of Things, Cognitive Computing, Manufacturing Technologies. This is a completely editable PowerPoint presentation and is available for immediate download. Download now and impress your audience.
-
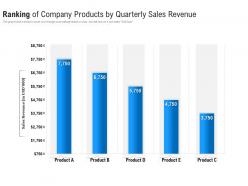 Ranking of company products by quarterly sales revenue
Presenting this set of slides with name Ranking Of Company Products By Quarterly Sales Revenue. The topics discussed in these slides are Ranking, Sales, Revenue. This is a completely editable PowerPoint presentation and is available for immediate download. Download now and impress your audience.
-
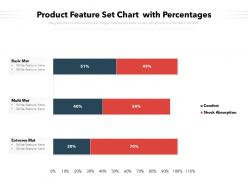 Product feature set chart with percentages
Presenting our very own Product Feature Set Chart With Percentages PPT slide. This template can go with Google Slides as well. The slide is fully editable and supports all screen sizes. Files can be saved in formats like PDF, JPG, and PNG. Edit as you want the presentation and deliver it with ease.
-
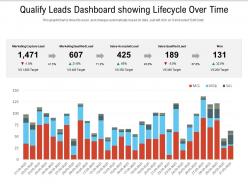 Qualify leads dashboard showing lifecycle over time
Presenting Qualify Leads Dashboard Showing Lifecycle Over Time. You can edit the slide as per your requirements. It is adaptable with Google Slides which makes it accessible at once. This slide is available in both the standard and widescreen aspect ratios. High-quality graphics ensures that there is no room for deterioration.
-
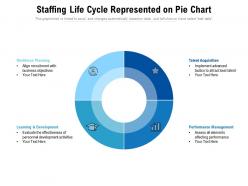 Staffing life cycle represented on pie chart
Presenting this set of slides with name Staffing Life Cycle Represented On Pie Chart. The topics discussed in these slides are Workforce Planning, Talent Acquisition, Performance Management, Learning Development. This is a completely editable PowerPoint presentation and is available for immediate download. Download now and impress your audience.
-
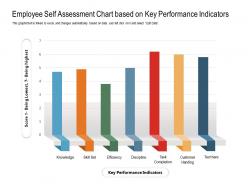 Employee self assessment chart based on key performance indicators
Presenting this set of slides with name Employee Self Assessment Chart Based On Key Performance Indicators. The topics discussed in these slides are Knowledge, Skill Set, Efficiency, Discipline, Task Completion, Customer Handing. This is a completely editable PowerPoint presentation and is available for immediate download. Download now and impress your audience.
-
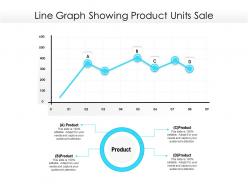 Line graph showing product units sale
Presenting this set of slides with name Line Graph Showing Product Units Sale. The topics discussed in these slides is Line Graph Showing Product Units Sale. This is a completely editable PowerPoint presentation and is available for immediate download. Download now and impress your audience.
-
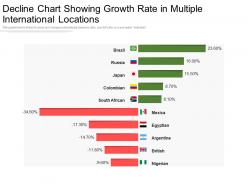 Decline chart showing growth rate in multiple international locations
Presenting this set of slides with name Decline Chart Showing Growth Rate In Multiple International Locations. The topics discussed in these slide is Decline Chart Showing Growth Rate In Multiple International Locations. This is a completely editable PowerPoint presentation and is available for immediate download. Download now and impress your audience.
-
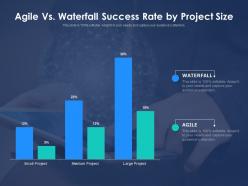 Agile vs waterfall success rate by project size
Presenting this set of slides with name Agile Vs Waterfall Success Rate By Project Size. This is a three stage process. The stages in this process are Small Project, Medium Project, Large Project. This is a completely editable PowerPoint presentation and is available for immediate download. Download now and impress your audience.
-
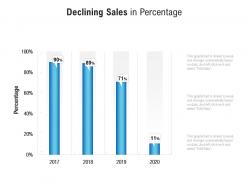 Declining sales in percentage
Presenting this set of slides with name Declining Sales In Percentage. The topics discussed in these slides are Graph, Chart, Data, Percentage. This is a completely editable PowerPoint presentation and is available for immediate download. Download now and impress your audience.
-
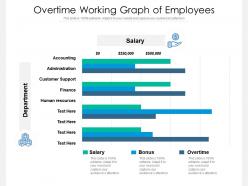 Overtime working graph of employees
Presenting this set of slides with name Overtime Working Graph Of Employees. The topics discussed in these slides are Accounting, Human Resources, Finance, Administration, Customer Support. This is a completely editable PowerPoint presentation and is available for immediate download. Download now and impress your audience.
-
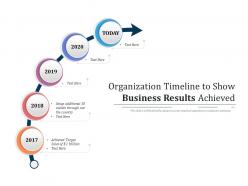 Organization timeline to show business results achieved
Presenting this set of slides with name Organization Timeline To Show Business Results Achieved. The topics discussed in these slides are Achieved Target Sales, Setup Additional 30 Outlets Through Out The Country. This is a completely editable PowerPoint presentation and is available for immediate download. Download now and impress your audience.
-
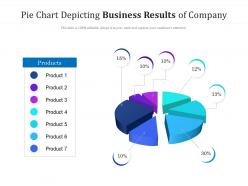 Pie chart depicting business results of company
Presenting this set of slides with name Pie Chart Depicting Business Results Of Company. The topics discussed in these slides are Pie Chart Depicting Business Results Of Company. This is a completely editable PowerPoint presentation and is available for immediate download. Download now and impress your audience.


