Charts, Graphs PowerPoint Designs, Presentation Charts Designs & PPT Graphics
- Sub Categories
-
- Arrows and Targets
- Bullet and Text Slides
- Charts and Graphs
- Circular Cycle Diagrams
- Concepts and Shapes
- Custom Flat Designs
- Dashboards and Measuring
- Flow Process
- Funnels
- Gears
- Growth
- Harvey Balls
- Idea Innovation and Light Bulbs
- Leadership
- Linear Process Diagrams
- Magnifying Glass
- Misc Other Graphics
- Opportunity and Handshake
- Organization Charts
- Puzzles
- Pyramids
- Roadmaps and Timelines
- Silhouettes
- Steps
- Strategic Planning Analysis
- SWOT Analysis
- Tables and Matrix
- Teamwork
- Technology and Communication
- Venn Diagrams
- Visuals and Illustrations
-
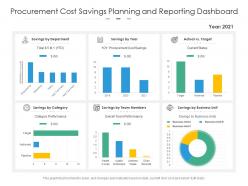 Procurement cost savings planning and reporting dashboard snapshot
Presenting our well-structured Procurement Cost Savings Planning And Reporting Dashboard Snapshot . The topics discussed in this slide are Savings By Department, Savings By Year, Actual Vs Target, Savings By Category, Savings By Team Members, Savings By Business Unit. This is an instantly available PowerPoint presentation that can be edited conveniently. Download it right away and captivate your audience.
-
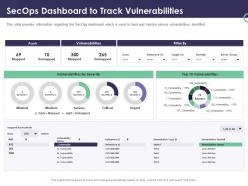 Enterprise security operations secops dashboard to track vulnerabilities ppt powerpoint templates
This slide provides information regarding the SecOps dashboard which is used to track and monitor various vulnerabilities identified. Present the topic in a bit more detail with this Enterprise Security Operations Secops Dashboard To Track Vulnerabilities Ppt Powerpoint Templates. Use it as a tool for discussion and navigation on Assets, Vulnerabilities, Severity. This template is free to edit as deemed fit for your organization. Therefore download it now.
-
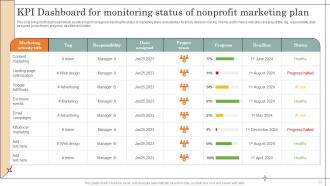 KPI Dashboard For Monitoring Status Of Nonprofit Marketing Plan
This slide brings forth dashboard which assists project managers in tracking the status of marketing plans and activities for timely decision making. The key performance indicators are project title, tag, responsibility, date assigned, project team, progress, deadline and status. Presenting our well structured KPI Dashboard For Monitoring Status Of Nonprofit Marketing Plan. The topics discussed in this slide are Marketing Activity, Influencer Marketing, Email Campaigns. This is an instantly available PowerPoint presentation that can be edited conveniently. Download it right away and captivate your audience.
-
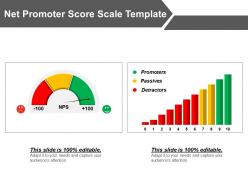 Net promoter score scale template powerpoint graphics
Presenting net promoter score scale PPT template. This Presentation graphic is eloquent and beneficial for the students, researchers, specialists from various fields. The composition features of this PowerPoint image allow you to modify the appearance and layout. This PPT design has enough scope to insert the title or subtitles respectively. The impeccable Presentation design is well acquainted with all Google Slides. They also provide an option to add your business logo too.
-
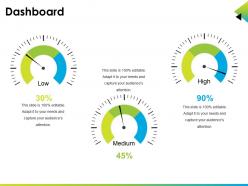 Dashboard Snapshot ppt infographic template
Presenting dashboard ppt infographic template. This is a dashboard snapshot ppt infographic template. This is a three stage process. The stages in this process are dashboard, low, high, medium.
-
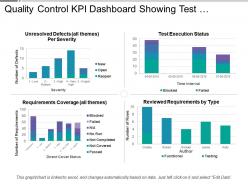 Quality control kpi dashboard showing test execution status
Presenting this set of slides with name - Quality Control Kpi Dashboard Showing Test Execution Status. This is a four stage process. The stages in this process are Quality Management, Quality Control, Quality Assurance.
-
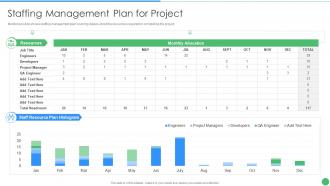 Pmp toolkit it staffing management plan for project
Mentioned slide shows staffing management plan covering details about the resources required for completing the project. Deliver an outstanding presentation on the topic using this Pmp Toolkit It Staffing Management Plan For Project. Dispense information and present a thorough explanation of Staffing Management Plan For Project using the slides given. This template can be altered and personalized to fit your needs. It is also available for immediate download. So grab it now.
-
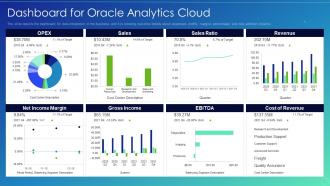 Oracle analytics cloud it dashboard snapshot for oracle analytics cloud
This slide depicts the dashboard snapshot for data integration in the business, and it is showing real time details about expenses, profits, margins percentage, and new addition projects. Deliver an outstanding presentation on the topic using this Oracle Analytics Cloud It Dashboard For Oracle Analytics Cloud. Dispense information and present a thorough explanation of Dashboard For Oracle Analytics Cloud using the slides given. This template can be altered and personalized to fit your needs. It is also available for immediate download. So grab it now.
-
 Social Recruiting Strategy Recruitment Dashboard To Keep Track Of Employees
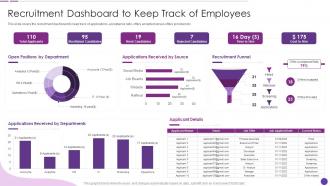
This slide covers the recruitment dashboard to keep track of applications, acceptance ratio, offers accepted versus offers provided etc. Present the topic in a bit more detail with this Social Recruiting Strategy Recruitment Dashboard To Keep Track Of Employees. Use it as a tool for discussion and navigation on Recruitment, Dashboard, Applications. This template is free to edit as deemed fit for your organization. Therefore download it now.
-
 Two Years Gantt Chart For Software Development Project
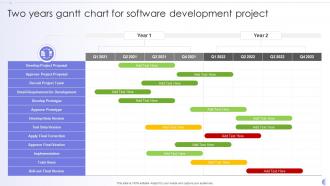
Plan, track and synchronize the most important tasks of any project with this exemplary Two Years Gantt Chart For Software Development Project. This lucrative template can be used to manage the project efficiently. You can enter all the vital components of the project like the start date, duration, and status of each task to keep the owners accountability in check. Create a highly proficient scheduling plan and measure its progress with this elaborative layout. In addition, you can add your activities in the taskbar included in this template and edit it to handle your project effectively. This template is ideal for project management, business plans, student projects, and assignments. So download and captivate your audience.
-
 Fix And Flip Process For Property Renovation Market Overview For Real Estate Property
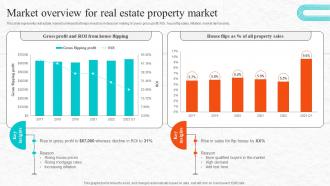
This slide represents real estate market summary that helps investors in decision making. It covers gross profit, ROI, house flip sales, inflation, market demand etc. Present the topic in a bit more detail with this Fix And Flip Process For Property Renovation Market Overview For Real Estate Property. Use it as a tool for discussion and navigation on House Flips, Property Sales, ROI. This template is free to edit as deemed fit for your organization. Therefore download it now.
-
 World sector growth ppt slides download
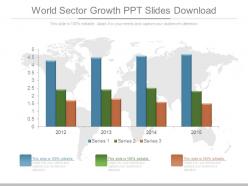
Presenting world sector growth ppt slides download. This is a world sector growth ppt slides download. This is a four stage process. The stages in this process are graph, management, strategy, business, success.
-
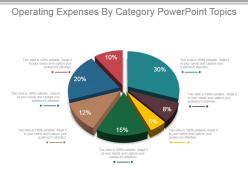 Operating expenses by category powerpoint topics
Presenting operating expenses by category powerpoint topics. This is a operating expenses by category powerpoint topics. This is a seven stage process. The stages in this process are business, management, marketing, finance, pie.
-
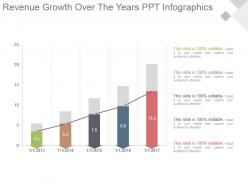 Revenue growth over the years ppt infographics
Presenting revenue growth over the years ppt infographics. This is a revenue growth over the years ppt infographics. This is a five stage process. The stages in this process are business, management, marketing, revenue, infographics.
-
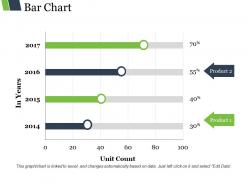 Bar chart ppt example file
Presenting bar chart ppt example file. This is a bar chart ppt example file. This is a four stage process. The stages in this process are product, in years, percentage, business, years.
-
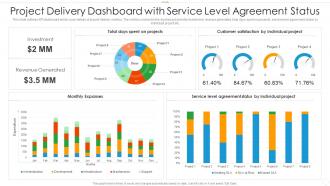 Project delivery dashboard with service level agreement status
This slide outlines KPI dashboard which cover details of project delivery metrics. The metrics covered in the dashboard are total investment, revenue generated, total days spent on projects, service level agreement status by individual project etc. Introducing our Project Delivery Dashboard With Service Level Agreement Status set of slides. The topics discussed in these slides are Project Delivery Dashboard With Service Level Agreement Status. This is an immediately available PowerPoint presentation that can be conveniently customized. Download it and convince your audience.
-
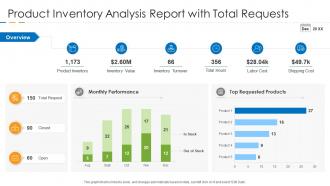 Product inventory analysis report with total requests
Presenting our well structured Product Inventory Analysis Report With Total Requests. The topics discussed in this slide are Product Inventory, Inventory Value, Inventory Turnover. This is an instantly available PowerPoint presentation that can be edited conveniently. Download it right away and captivate your audience.
-
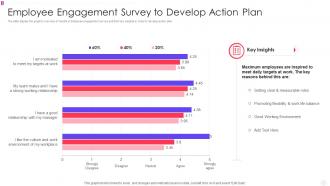 Employee Engagement Survey To Develop Action Plan
The slide display the graphic overview of results of employee engagement survey and their key insights in order to develop action plan. Presenting our well-structured Employee Engagement Survey To Develop Action Plan. The topics discussed in this slide are Employee Engagement Survey To Develop Action Plan. This is an instantly available PowerPoint presentation that can be edited conveniently. Download it right away and captivate your audience.
-
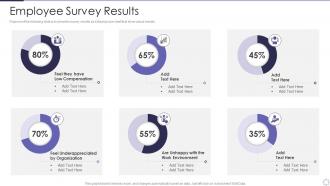 Managing Employee Turnover Employee Survey Results Ppt Microsoft
Purpose of the following slide is to show the survey results as it displays pie chart that show actual results. Deliver an outstanding presentation on the topic using this Managing Employee Turnover Employee Survey Results Ppt Microsoft. Dispense information and present a thorough explanation of Work Environment, Employee Survey Results using the slides given. This template can be altered and personalized to fit your needs. It is also available for immediate download. So grab it now.
-
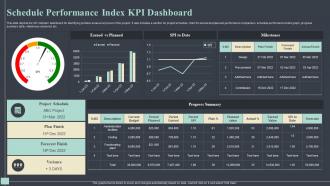 Schedule Performance Index KPI Dashboard
This slide depicts the SPI indicator dashboard for identifying problem areas at any level of the project. It also includes a section for project schedule, chart for earned and planned performance comparison, schedule performance index graph, progress summary table, milestones achieved, etc. Introducing our Schedule Performance Index KPI Dashboard set of slides. The topics discussed in these slides are Schedule Performance, Project Schedule, Forecast Finish. This is an immediately available PowerPoint presentation that can be conveniently customized. Download it and convince your audience.
-
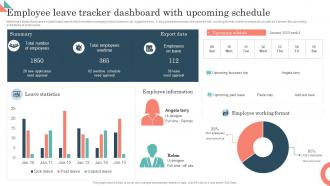 Employee Leave Tracker Dashboard With Upcoming Schedule
Mentioned slide showcases a dashboard report which enables manager to track leaves in an organized way. It also presents number of employee info.,working format, overtime requests as well as it shows the upcoming schedules of employees. Presenting our well structured Employee Leave Tracker Dashboard With Upcoming Schedule. The topics discussed in this slide are Summary, Employees, Export Data. This is an instantly available PowerPoint presentation that can be edited conveniently. Download it right away and captivate your audience.
-
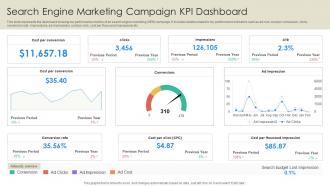 Search Engine Marketing Campaign Kpi Dashboard
This slide represents the dashboard showing key performance metrics of an search engine marketing SEM campaign. It includes details related to key performance indicators such as ad cost, cost per conversion, clicks, conversion rate, impressions, ad impressions, cost per click, cost per thousand impressions etc. Presenting our well structured Search Engine Marketing Campaign Kpi Dashboard. The topics discussed in this slide are Marketing, Campaign, Impressions. This is an instantly available PowerPoint presentation that can be edited conveniently. Download it right away and captivate your audience.
-
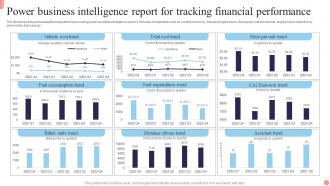 Power Business Intelligence Report For Tracking Financial Performance
The following slide showcases financial performance using power business intelligence report. It includes components such as monthly economy, reduced engine hours, decrease in carbon dioxide, engine hours reduction by automobile, fuel savings. Presenting our well structured Power Business Intelligence Report For Tracking Financial Performance. The topics discussed in this slide are Consumption Trend, Expenditure Trend, Emission Trend. This is an instantly available PowerPoint presentation that can be edited conveniently. Download it right away and captivate your audience.
-
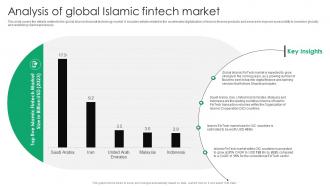 Analysis Of Global Islamic Fintech Everything You Need To Know About Islamic Fin SS V
This slide covers the details related to the global Islamic financial technology market. It includes details related to the accelerated digitalization of Islamic finance products and services to improve accessibility to investors globally and redefining client experiences. Present the topic in a bit more detail with this Analysis Of Global Islamic Fintech Everything You Need To Know About Islamic Fin SS V. Use it as a tool for discussion and navigation on Islamic Fintech Market, Islamic Fintech Market, Shariah Principles. This template is free to edit as deemed fit for your organization. Therefore download it now.
-
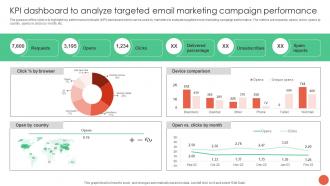 KPI Dashboard To Analyze Targeted Email Marketing Campaign Database Marketing Techniques MKT SS V
The purpose of this slide is to highlight key performance indicator KPI dashboard which can be used by marketers to evaluate targeted email marketing campaign performance. The metrics are requests, opens, clicks, opens by country, opens vs clicks by month, etc. Deliver an outstanding presentation on the topic using this KPI Dashboard To Analyze Targeted Email Marketing Campaign Database Marketing Techniques MKT SS V. Dispense information and present a thorough explanation of Delivered Percentage, Unsubscribes, Spam Reports using the slides given. This template can be altered and personalized to fit your needs. It is also available for immediate download. So grab it now.
-
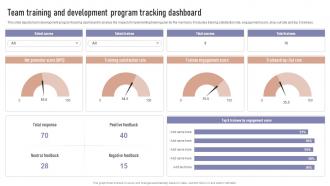 Team Training And Development Program Tracking Formulating Team Development
This slide depicts team development program tracking dashboard to analyze the impact of implementing training plan for the members. It includes training satisfaction rate,engagement score,drop out rate and top 5 trainees. Deliver an outstanding presentation on the topic using this Team Training And Development Program Tracking Formulating Team Development Dispense information and present a thorough explanation of Positive Feedback, Negative Feedback, Neutral Feedback using the slides given. This template can be altered and personalized to fit your needs. It is also available for immediate download. So grab it now.
-
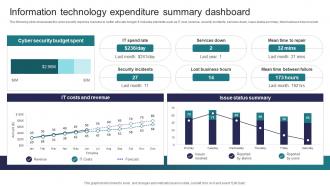 Information Technology Expenditure Summary Implementing Strategies To Mitigate Cyber Security Threats
The following slide showcases the cyber security expense overview to better allocate budget. It includes elements such as IT cost, revenue, security incidents, services down, issue status summary, total business hours lost etc. Deliver an outstanding presentation on the topic using this Information Technology Expenditure Summary Implementing Strategies To Mitigate Cyber Security Threats Dispense information and present a thorough explanation of Cyber Security Budget Spent, It Costs And Revenue, Issue Status Summary using the slides given. This template can be altered and personalized to fit your needs. It is also available for immediate download. So grab it now.
-
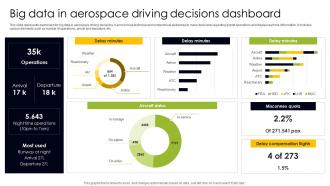 Big Data In Aerospace Driving Decisions Dashboard
This slide represents dashboard for big data in aerospace driving decisions. It aims to help technical and nontechnical audiences to make decisions regarding airport operations and display real time information. It includes various elements such as number of operations, arrival and departure, etc. Introducing our Big Data In Aerospace Driving Decisions Dashboard set of slides. The topics discussed in these slides are Delay Minutes, Aircraft Status, Misconnex Quota. This is an immediately available PowerPoint presentation that can be conveniently customized. Download it and convince your audience.
-
 Use Cases Of Big Data Governance In Companies
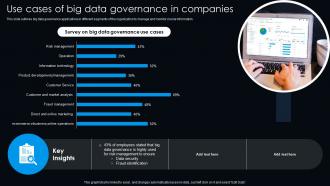
This slide outlines big data governance applications in different segments of the organization to manage and monitor crucial information. Presenting our well structured Use Cases Of Big Data Governance In Companies. The topics discussed in this slide are Survey On Big Data, Governance Use Cases. This is an instantly available PowerPoint presentation that can be edited conveniently. Download it right away and captivate your audience.
-
 Sales Management Performance Dashboard With Metrics
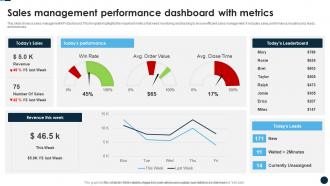
This slide shows a sales management KPI dashboard. This template highlights the important metrics that need monitoring and tracking to ensure efficient sales management. It includes sales, performance, leaderboard, leads, and revenues. Presenting our well structured Sales Management Performance Dashboard With Metrics. The topics discussed in this slide are Revenue This Week, Todays Performance, Todays Leaderboard. This is an instantly available PowerPoint presentation that can be edited conveniently. Download it right away and captivate your audience.
-
 Media Planning Campaign Analysis Media Planning Strategy The Complete Guide Strategy Ss V
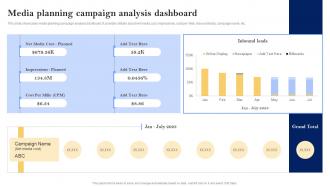
This slide showcases media planning campaign analysis dashboard. It provides details about net media cost, impressions, cost per mille, inbound leads, campaign name, etc. Deliver an outstanding presentation on the topic using this Media Planning Campaign Analysis Media Planning Strategy The Complete Guide Strategy Ss V. Dispense information and present a thorough explanation of Media Planning Campaign, Analysis Dashboard using the slides given. This template can be altered and personalized to fit your needs. It is also available for immediate download. So grab it now.
-
 Budgeting planned actual comparison ppt deck
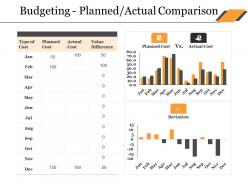
Presenting this set of slides with name - Budgeting Planned Actual Comparison Ppt Deck. This is a two stage process. The stages in this process are Bar Chart, Finance, Marketing, Analysis, Comparison.
-
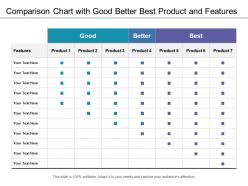 Comparison chart with good better best product and features
Presenting this set of slides with name - Comparison Chart With Good Better Best Product And Features. This is a seven stage process. The stages in this process are Comparison Chart, Comparison Table, Comparison Matrix.
-
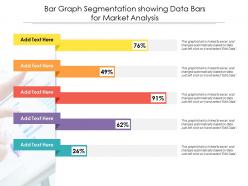 Bar graph segmentation showing data bars for market analysis
Presenting this set of slides with name Bar Graph Segmentation Showing Data Bars For Market Analysis. The topics discussed in these slide is Bar Graph Segmentation Showing Data Bars For Market Analysis. This is a completely editable PowerPoint presentation and is available for immediate download. Download now and impress your audience.
-
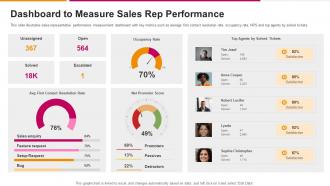 Dashboard Snapshot To Measure Sales Rep Performance Successful Sales Strategy To Launch
This slide illustrates sales representative performance measurement dashboard with key metrics such as average first contact resolution rate, occupancy rate, NPS and top agents by solved tickets. Present the topic in a bit more detail with this Dashboard Snapshot To Measure Sales Rep Performance Successful Sales Strategy To Launch. Use it as a tool for discussion and navigation on Dashboard To Measure Sales Rep Performance. This template is free to edit as deemed fit for your organization. Therefore download it now.
-
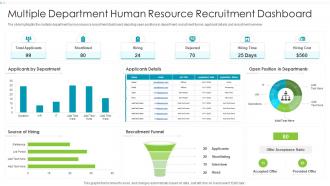 Multiple Department Human Resource Recruitment Dashboard
The slide highlights the multiple department human resource recruitment dashboard depicting open positions in department, recruitment funnel, applicant details and recruitment overview. Presenting our well structured Multiple Department Human Resource Recruitment Dashboard. The topics discussed in this slide are Source Of Hiring, Recruitment Funnel, Offer Acceptance Ratio. This is an instantly available PowerPoint presentation that can be edited conveniently. Download it right away and captivate your audience.
-
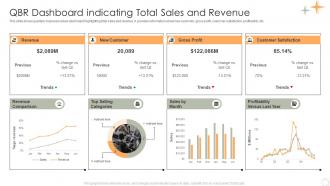 QBR Dashboard Indicating Total Sales And Revenue
This slide shows quarterly business review dashboard highlighting total sales and revenue. It provides information about new customer, gross profit, customer satisfaction, profitability, etc. Presenting our well structured QBR Dashboard Indicating Total Sales And Revenue. The topics discussed in this slide are Revenue, New Customer, Gross Profit, Customer Satisfaction. This is an instantly available PowerPoint presentation that can be edited conveniently. Download it right away and captivate your audience.
-
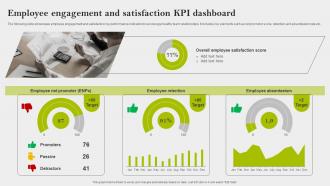 Employee Engagement And Satisfaction KPI Dashboard Implementing Employee Engagement Strategies
The following slide showcases employee engagement and satisfaction key performance indicators to encourage healthy team relationships. It includes key elements such as net promotor score, retention and absenteeism rate etc. Deliver an outstanding presentation on the topic using this Employee Engagement And Satisfaction KPI Dashboard Implementing Employee Engagement Strategies Dispense information and present a thorough explanation of Employee Net Promoter, Employee Retention, Employee Absenteeism using the slides given. This template can be altered and personalized to fit your needs. It is also available for immediate download. So grab it now.
-
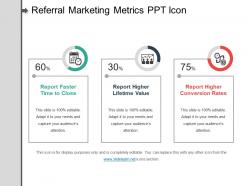 Referral marketing metrics ppt icon
Presenting referral marketing metrics ppt icon. This is a referral marketing metrics ppt icon. This is a three stage process. The stages in this process are Report Faster Time to Close, Report Higher Lifetime Value, Report Higher Conversion Rates.
-
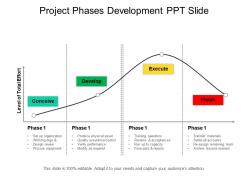 Project phases development ppt slide
Presenting project phases development ppt slide. This is a project phases development ppt slide. This is a four stage process. The stages in this process are project phases templates, project steps, project methods.
-
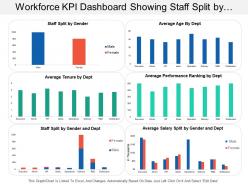 Workforce kpi dashboard showing staff split by gender and average tenure by department
Presenting this set of slides with name - Workforce Kpi Dashboard Showing Staff Split By Gender And Average Tenure By Department. This is a six stage process. The stages in this process are Staff, Personnel, Workforce.
-
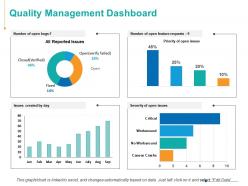 Quality management dashboard marketing ppt powerpoint presentation infographics skills
Presenting this set of slides with name - Quality Management Dashboard Marketing Ppt Powerpoint Presentation Infographics Skills. This is a four stage process. The stages in this process are Finance, Analysis, Business, Investment, Marketing.
-
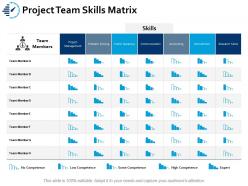 Project team skills matrix ppt portfolio gridlines
Presenting this set of slides with name - Project Team Skills Matrix Ppt Portfolio Gridlines. This is a seven stage process. The stages in this process are Business, Management, Strategy, Sales, Marketing.
-
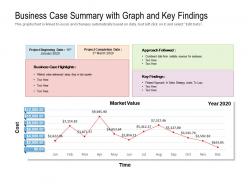 Business case summary with graph and key findings
Presenting this set of slides with name Business Case Summary With Graph And Key Findings. The topics discussed in these slides are Business Case Highlights, Approach Followed, Key Findings, Market Value, Cost. This is a completely editable PowerPoint presentation and is available for immediate download. Download now and impress your audience.
-
 One page vulnerability management compliance summary presentation report infographic ppt pdf document
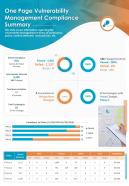
Here we present One Page Vulnerability Management Compliance Summary Presentation Report Infographic PPT PDF Document one pager PowerPoint template. Vulnerability means the inability of a group or an individual to cope up or withstand the impact of hostile environment. Vulnerability management thus helps in identifying, classifying, evaluating and mitigating the vulnerabilities in software. To assist you in mitigating the risks we have come up with risk assessment in vulnerability management PowerPoint slide design one pager. This vulnerability assessment PowerPoint template one pager covers details about risk assessment in vulnerability management with executive summary where you can present the aim of vulnerability scan. It gives you a column to jot down your findings and severity of vulnerability. Manage your network security using vulnerability management approach and safeguard data assets of your organization. The slide being completely customizable and readily available saves a lot of time of the presenter in explaining and showcasing the concepts. You can add or remove any element on this vulnerability scanner one pager template. Incorporate this amazingly curated PowerPoint template to deal with vulnerabilities and make sure that your organization focuses on efficient tactics. Grab this One Page Vulnerability Management Compliance Summary Presentation Report Infographic PPT PDF Document one pager template now.
-
 Kpi of human resource management headcount ppt powerpoint layouts example
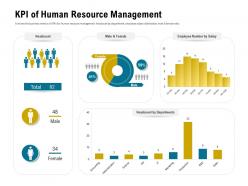
It shows the business metrics and KPIs for human resource management headcount by department, employee salary distribution, male and female ratio. Presenting this set of slides with name KPI Of Human Resource Management Headcount Ppt Powerpoint Layouts Example. The topics discussed in these slides are Accounting, Administration, Finance, Marketing, Sales. This is a completely editable PowerPoint presentation and is available for immediate download. Download now and impress your audience.
-
 Revenue performance update with customer satisfaction
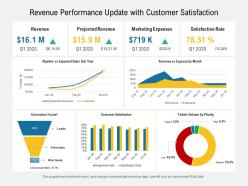
Presenting this set of slides with name Revenue Performance Update With Customer Satisfaction. The topics discussed in these slides are Revenue, Marketing, Sales. This is a completely editable PowerPoint presentation and is available for immediate download. Download now and impress your audience.
-
 Agile Project Management Activities Tracking Agile Transformation Approach Playbook
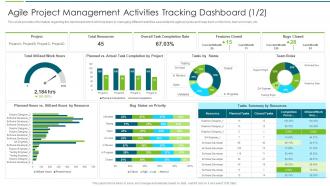
This slide provides information regarding the dashboard which will help team in managing different activities associated to agile projects and keep track on the time, task summary, etc. Deliver an outstanding presentation on the topic using this Agile Project Management Activities Tracking Agile Transformation Approach Playbook. Dispense information and present a thorough explanation of Management, Dashboard, Associated using the slides given. This template can be altered and personalized to fit your needs. It is also available for immediate download. So grab it now.
-
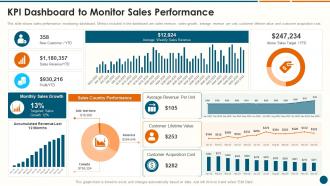 KPI Dashboard To Monitor Sales Performance Structuring A New Product Launch Campaign
This slide shows sales performance monitoring dashboard. Metrics included in the dashboard are sales revenue, sales growth, average revenue per unit, customer lifetime value and customer acquisition cost. Present the topic in a bit more detail with this KPI Dashboard To Monitor Sales Performance Structuring A New Product Launch Campaign. Use it as a tool for discussion and navigation on Dashboard, Monitor Sales Performance, Sales Country Performance. This template is free to edit as deemed fit for your organization. Therefore download it now.
-
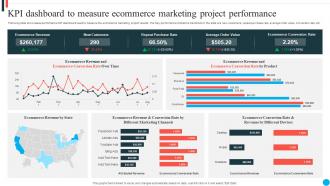 KPI Dashboard To Measure Ecommerce Marketing Project Performance
Following slide showcases performance KPI dashboard used to measure the ecommerce marketing project results. The Key performance indicators mentioned in the slide are new customers, repeat purchase rate, average order value, conversion rate, etc. Presenting our well-structured KPI Dashboard To Measure Ecommerce Marketing Project Performance. The topics discussed in this slide are KPI Dashboard, Measure, Ecommerce Marketing, Project Performance. This is an instantly available PowerPoint presentation that can be edited conveniently. Download it right away and captivate your audience.
-
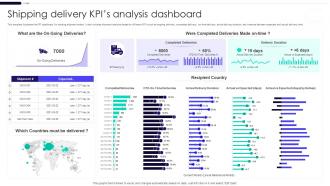 Shipping Delivery KPIs Analysis Dashboard
This template illustrates the KPI dashboard for tracking shipment orders. It also includes shipment analysis based on different KPIs such as ongoing delivery, completed delivery, on time delivery, actual delivery duration, and variance between expected and actual delivery time. Presenting our well-structured Shipping Delivery KPIs Analysis Dashboard. The topics discussed in this slide are Shipping Delivery, KPIS Analysis, Dashboard. This is an instantly available PowerPoint presentation that can be edited conveniently. Download it right away and captivate your audience.
-
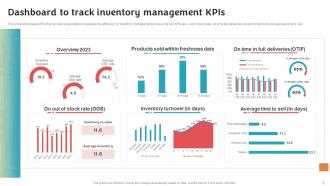 Dashboard To Track Inventory Management Stock Inventory Procurement And Warehouse
This slide showcases KPIs that can help organization to evaluate the efficiency of inventory management process. Its key KPIs are out of stock rate, on time full deliveries, inventory turnover and average time to sell. Present the topic in a bit more detail with this Dashboard To Track Inventory Management Stock Inventory Procurement And Warehouse. Use it as a tool for discussion and navigation on Products Sold, Inventory Turnover, Average Time To Sell. This template is free to edit as deemed fit for your organization. Therefore download it now.
-
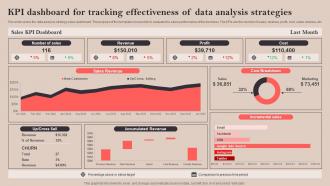 KPI Dashboard For Tracking Effectiveness Of Data Analysis Strategies
This slide covers the data analysis strategy sales dashboard. The purpose of this template is to provide to evaluate the sales performance of the business. The KPIs are the number of sales, revenue, profit, cost, sales revenue, etc. Introducing our KPI Dashboard For Tracking Effectiveness Of Data Analysis Strategies set of slides. The topics discussed in these slides are Number Of Sales, Revenue, Profit. This is an immediately available PowerPoint presentation that can be conveniently customized. Download it and convince your audience.
-
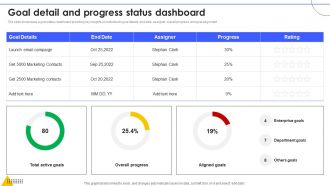 Goal Detail And Progress Status Dashboard
The slide showcases a goal status dashboard providing key insights on individuals goal details, end date, assigner, overall progress, and goal alignment. Introducing our Goal Detail And Progress Status Dashboard set of slides. The topics discussed in these slides are Launch Email Campaign, Marketing Contacts, Status Dashboard. This is an immediately available PowerPoint presentation that can be conveniently customized. Download it and convince your audience.
-
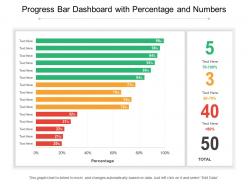 Progress bar dashboard with percentage and numbers
Presenting this set of slides with name Progress Bar Dashboard With Percentage And Numbers. The topics discussed in these slides are Progress Dashboard, Chart And Graph, Finance, Marketing. This is a completely editable PowerPoint presentation and is available for immediate download. Download now and impress your audience.
-
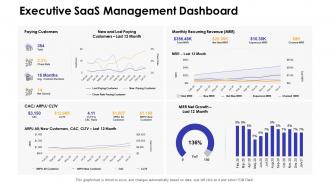 Dashboards by function executive saas management dashboard
Deliver an outstanding presentation on the topic using this Dashboards By Function Executive Saas Management Dashboard. Dispense information and present a thorough explanation of Management, Dashboard, Executive using the slides given. This template can be altered and personalized to fit your needs. It is also available for immediate download. So grab it now.
-
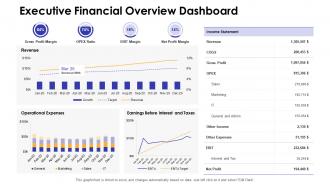 Executive financial overview dashboard snapshot by function
Present the topic in a bit more detail with this Executive Financial Overview Dashboard Snapshot By Function. Use it as a tool for discussion and navigation on Executive Financial Overview Dashboard. This template is free to edit as deemed fit for your organization. Therefore download it now.
-
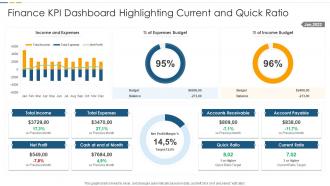 Finance KPI Dashboard Highlighting Current And Quick Ratio
Introducing our Finance KPI Dashboard Highlighting Current And Quick Ratio set of slides. The topics discussed in these slides are Income And Expenses, Expenses Budget, Income Budget. This is an immediately available PowerPoint presentation that can be conveniently customized. Download it and convince your audience.
-
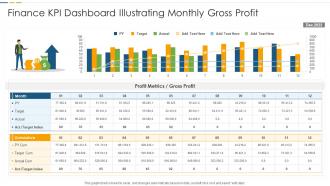 Finance KPI Dashboard Illustrating Monthly Gross Profit
Introducing our Finance KPI Dashboard Illustrating Monthly Gross Profit set of slides. The topics discussed in these slides are Finance KPI Dashboard Illustrating Monthly Gross Profit. This is an immediately available PowerPoint presentation that can be conveniently customized. Download it and convince your audience.
-
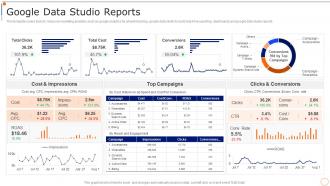 Content Marketing Playbook Google Data Studio Reports
This template covers tools to measure marketing analytics such as google analytics for all web tracking, google data studio to build real time reporting dashboards and google data studio reports. Present the topic in a bit more detail with this Content Marketing Playbook Google Data Studio Reports. Use it as a tool for discussion and navigation on Google Data Studio Reports. This template is free to edit as deemed fit for your organization. Therefore download it now.


