Charts, Graphs PowerPoint Designs, Presentation Charts Designs & PPT Graphics
- Sub Categories
-
- Arrows and Targets
- Bullet and Text Slides
- Charts and Graphs
- Circular Cycle Diagrams
- Concepts and Shapes
- Custom Flat Designs
- Dashboards and Measuring
- Flow Process
- Funnels
- Gears
- Growth
- Harvey Balls
- Idea Innovation and Light Bulbs
- Leadership
- Linear Process Diagrams
- Magnifying Glass
- Misc Other Graphics
- Opportunity and Handshake
- Organization Charts
- Puzzles
- Pyramids
- Roadmaps and Timelines
- Silhouettes
- Steps
- Strategic Planning Analysis
- SWOT Analysis
- Tables and Matrix
- Teamwork
- Technology and Communication
- Venn Diagrams
- Visuals and Illustrations
-
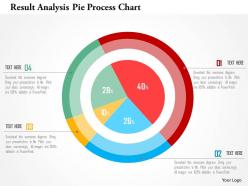 Result analysis pie process chart flat powerpoint design
Widescreen output without the problem of pixilation. 100 percent editable content. Easy inclusion and exclusion of PPT icons, colors, orientation, etc. Personalize the content with company name and logo. Ease of inclusion or exclusion of details in slide background. Ease of download and compatibility with varied software. Significantly useful PowerPoint slide icons by financial analysts, students, teachers and banking professionals.
-
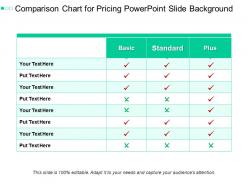 Comparison chart for pricing powerpoint slide background
Presenting comparison chart for pricing powerpoint slide background. This is a comparison chart for pricing powerpoint slide background. This is a three stage process. The stages in this process are comparison chart, comparison table, comparison matrix.
-
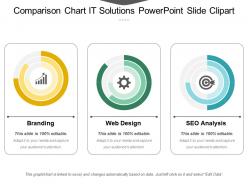 Comparison chart it solutions powerpoint slide clipart
Presenting our comparison chart it solutions PowerPoint slide clipart. This PPT display can be used to represent business it solutions in an approachable way. All the components used here are fully editable by means of color, shape, and orientation, font shape, font type, font size, and text. This PPT plan can be used with Google Slides and can be adjusted in any PowerPoint software. These high-quality graphics can be projected on widescreen forecasts and are available in both standard 4:3, widescreen format 16:9 after downloading.
-
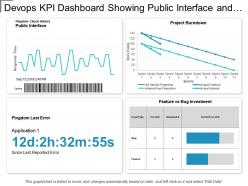 Devops kpi dashboard showing public interface and project burndown
Presenting this set of slides with name - Devops Kpi Dashboard Showing Public Interface And Project Burndown. This is a four stage process. The stages in this process are Development And Operations, Devops.
-
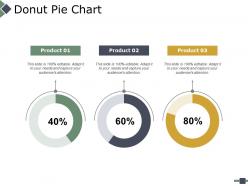 Donut pie chart ppt powerpoint presentation file infographics
Presenting this set of slides with name - Donut Pie Chart Ppt Powerpoint Presentation File Infographics. This is a three stage process. The stages in this process are Percentage, Product, Business, Management, Marketing.
-
 Survey results of customer satisfaction
Presenting this set of slides with name Survey Results Of Customer Satisfaction. The topics discussed in these slides are Very Satisfied, Satisfied, Unsatisfied, Neutral. This is a completely editable PowerPoint presentation and is available for immediate download. Download now and impress your audience.
-
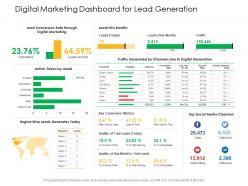 Digital marketing dashboard for lead generation
Presenting this set of slides with name Digital Marketing Dashboard For Lead Generation. The topics discussed in these slides are Digital Marketing, Digital Generation, Corporate. This is a completely editable PowerPoint presentation and is available for immediate download. Download now and impress your audience.
-
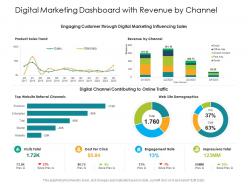 Digital marketing dashboard with revenue by channel
Presenting this set of slides with name Digital Marketing Dashboard With Revenue By Channel. The topics discussed in these slides are Engagement Rate, Revenue, Impressions Total. This is a completely editable PowerPoint presentation and is available for immediate download. Download now and impress your audience.
-
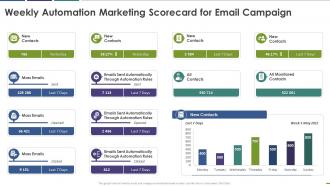 Weekly automation marketing scorecard for email campaign
This graph or chart is linked to excel, and changes automatically based on data. Just left click on it and select Edit Data. Deliver an outstanding presentation on the topic using this Weekly Automation Marketing Scorecard For Email Campaign. Dispense information and present a thorough explanation of Mass Emails, New Contacts, Automation Rules, Mass Emails using the slides given. This template can be altered and personalized to fit your needs. It is also available for immediate download. So grab it now.
-
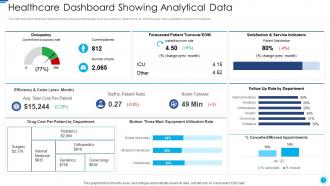 Role of digital twin and iot healthcare dashboard snapshot showing analytical data
This slide shows the healthcare dashboard that presents analytical data such as occupancy, patient turnover, efficiency and costs, satisfaction and service indicators. Deliver an outstanding presentation on the topic using this Role Of Digital Twin And Iot Healthcare Dashboard Snapshot Showing Analytical Data. Dispense information and present a thorough explanation of Healthcare, Dashboard, Analytical using the slides given. This template can be altered and personalized to fit your needs. It is also available for immediate download. So grab it now.
-
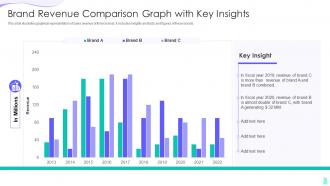 Brand Revenue Comparison Graph With Key Insights
This slide illustrates graphical representation of sales revenue of three brands. It includes insights and facts and figures of these brands. Present the topic in a bit more detail with this Brand Revenue Comparison Graph With Key Insights. Use it as a tool for discussion and navigation on Brand Revenue Comparison Graph With Key Insights. This template is free to edit as deemed fit for your organization. Therefore download it now.
-
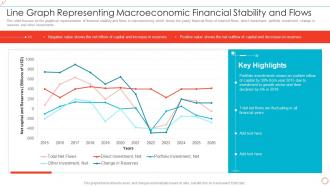 Line Graph Representing Macroeconomic Financial Stability And Flows
This slide focuses on the graphical representation of financial stability and flows in macroeconomy which shows the yearly financial flows of total net flows, direct investment, portfolio investment, change in reserves and other investments. Introducing our Line Graph Representing Macroeconomic Financial Stability And Flows set of slides. The topics discussed in these slides are Total Net Flows, Direct Investment, Net, Portfolio Investment, Net, 2015 To 2025. This is an immediately available PowerPoint presentation that can be conveniently customized. Download it and convince your audience.
-
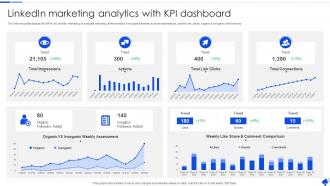 Linkedin Marketing Analytics With KPI Dashboard
The following slide depicts the KPAs of LinkedIn marketing to evaluate marketing effectiveness. It includes elements such as impressions, actions, link clicks, organic and inorganic followers etc. Introducing our Linkedin Marketing Analytics With KPI Dashboard set of slides. The topics discussed in these slides are Comment Comparison, Weekly Like Share, Inorganic Weekly Assessment. This is an immediately available PowerPoint presentation that can be conveniently customized. Download it and convince your audience.
-
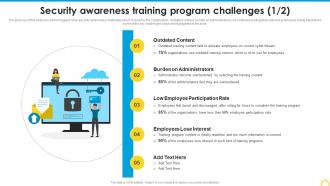 Security Awareness Training Program Challenges Building A Security Awareness Program
The purpose of this slide is to exhibit biggest cyber security awareness challenges which is faced by the organization. Outdated content, burden on administrators, low employee participation rate and employees losing interest are some of the key challenges which are highlighted in the slide. Present the topic in a bit more detail with this Security Awareness Training Program Challenges Building A Security Awareness Program. Use it as a tool for discussion and navigation on Outdated Content, Burden Administrators, Employee Participation Rate. This template is free to edit as deemed fit for your organization. Therefore download it now.
-
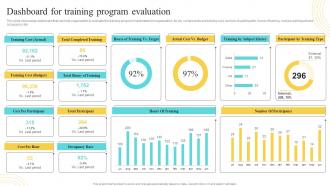 Dashboard For Training Program Evaluation Developing And Implementing
This slide showcases dashboard that can help organization to evaluate the training program implemented in organization. Its key components are training cost, number of participants, hours of training, cost per participant and occupancy rate. Deliver an outstanding presentation on the topic using this Dashboard For Training Program Evaluation Developing And Implementing. Dispense information and present a thorough explanation of Training, Dashboard, Training Program Evaluation using the slides given. This template can be altered and personalized to fit your needs. It is also available for immediate download. So grab it now.
-
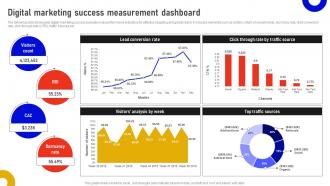 Digital Marketing Success Measurement Dashboard Marketing Data Analysis MKT SS V
The following slide showcases digital marketing success evaluation key performance indicators for effective targeting and global reach. It includes elements such as visitors, return on investments, dormancy rate, lead conversion rate, click through rate CTR, traffic sources etc. Present the topic in a bit more detail with this Digital Marketing Success Measurement Dashboard Marketing Data Analysis MKT SS V Use it as a tool for discussion and navigation on Lead Conversion Rate, Analysis By Week, Top Traffic Sources This template is free to edit as deemed fit for your organization. Therefore download it now.
-
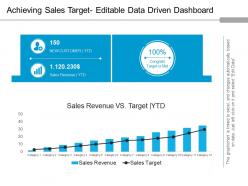 Achieving sales target editable data driven dashboard Snapshot powerpoint ideas
The design allows full editing. You can modify and customize the design the way you want. The design makes use of excel linked chart, where you need to include business related facts on excel sheet and it will automatically get changed in the PPT design. Quick and easy downloading available. You can download the design into JPEG and PDF formats. Design template is fully compatible with Google Slides and MS PowerPoint software.
-
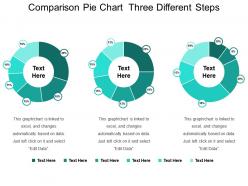 Comparison pie chart three different steps
Presenting comparison pie chart three different steps. This is a comparison pie chart three different steps. This is a three stage process. The stages in this process are comparison pie chart, ratio pie chart, analogy pie chart.
-
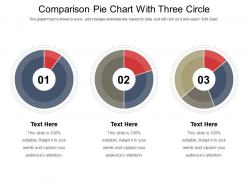 Comparison pie chart with three circle
Presenting comparison pie chart with three circle. This is a comparison pie chart with three circle. This is a three stage process. The stages in this process are comparison pie chart, ratio pie chart, analogy pie chart.
-
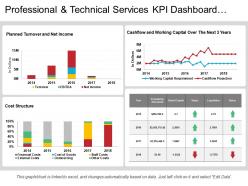 Professional and technical services kpi dashboard showing cost structure
Presenting this set of slides with name - Professional And Technical Services Kpi Dashboard Showing Cost Structure. This is a four stage process. The stages in this process are Professional And Technical Services, Services Management, Technical Management.
-
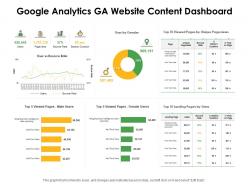 Google analytics ga website content dashboard snapshot ppt powerpoint presentation icon templates
Presenting this set of slides with name Google Analytics GA Website Content Dashboard Snapshot Ppt Powerpoint Presentation Icon Templates. The topics discussed in these slides are Session Duration, Business Intelligence, Data Reporting. This is a completely editable PowerPoint presentation and is available for immediate download. Download now and impress your audience.
-
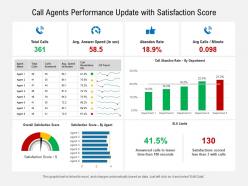 Call agents performance update with satisfaction score
Presenting this set of slides with name Call Agents Performance Update With Satisfaction Score. The topics discussed in these slide is Call Agents Performance Update With Satisfaction Score. This is a completely editable PowerPoint presentation and is available for immediate download. Download now and impress your audience.
-
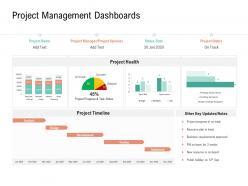 Project management dashboards project management team building ppt topics
Present the topic in a bit more detail with this Project Management Dashboards Project Management Team Building Ppt Topics. Use it as a tool for discussion and navigation on Project Timeline, Analysis, Development, Project Progress In On Track, Business Requirements Approved. This template is free to edit as deemed fit for your organization. Therefore download it now.
-
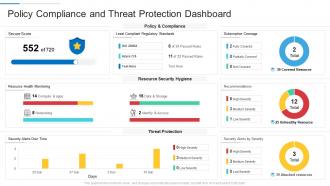 Policy compliance and threat protection dashboard
Introducing our Policy Compliance And Threat Protection Dashboard set of slides. The topics discussed in these slides are Resource Security, Networking, Dashboard. This is an immediately available PowerPoint presentation that can be conveniently customized. Download it and convince your audience.
-
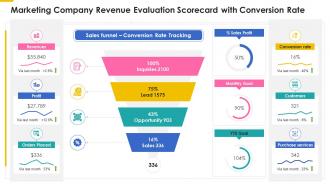 Marketing company revenue evaluation scorecard conversion rate ppt slides ideas
Present the topic in a bit more detail with this Marketing Company Revenue Evaluation Scorecard Conversion Rate Ppt Slides Ideas. Use it as a tool for discussion and navigation on Sales Funnel, Conversion Rate Tracking, Profit, Revenues, Orders Placed. This template is free to edit as deemed fit for your organization. Therefore download it now.
-
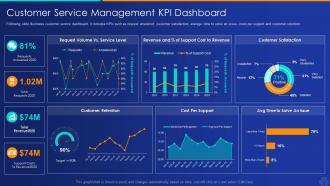 Artificial intelligence and machine learning customer kpi dashboard snapshot
Following slide illustrates customer service dashboard. It includes KPIs such as request answered, customer satisfaction, average time to solve an issue, costs per support and customer retention. Present the topic in a bit more detail with this Artificial Intelligence And Machine Learning Customer KPI Dashboard Snapshot Use it as a tool for discussion and navigation on Customer Service Management KPI Dashboard This template is free to edit as deemed fit for your organization. Therefore download it now.
-
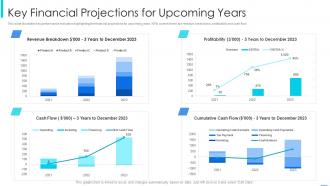 Startup financial pitch deck template key financial projections for upcoming years
This slide illustrates key performance indicators highlighting the financial projections for upcoming years. KPIs covered here are revenue breakdown, profitability and cash flow Present the topic in a bit more detail with this Startup Financial Pitch Deck Template Key Financial Projections For Upcoming Years Use it as a tool for discussion and navigation on Revenue Breakdown, Cumulative Cash Flow, Profitability This template is free to edit as deemed fit for your organization. Therefore download it now.
-
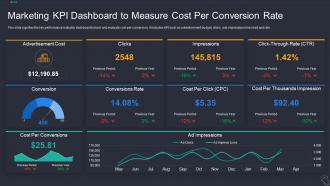 Marketing KPI Dashboard To Measure Cost Per Conversion Rate
This slide signifies the key performance indicator dashboard to track and evaluate cost per conversion. It includes KPI such as advertisement budget, clicks, ads impressions line chart and rate. Presenting our well structured Marketing KPI Dashboard To Measure Cost Per Conversion Rate. The topics discussed in this slide are Advertisement Cost, Conversion Impressions, Cost Per Thousands Impression, Dashboard To Measure Cost, Coat Per Click. This is an instantly available PowerPoint presentation that can be edited conveniently. Download it right away and captivate your audience.
-
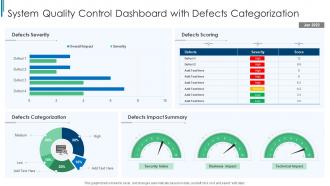 System Quality Control Dashboard Snapshot With Defects Categorization
This graph or chart is linked to excel, and changes automatically based on data. Just left click on it and select edit data. Presenting our well structured System Quality Control Dashboard Snapshot With Defects Categorization. The topics discussed in this slide are Defects Severity, Defects Scoring, Defects Impact Summary, Defects Categorization. This is an instantly available PowerPoint presentation that can be edited conveniently. Download it right away and captivate your audience.
-
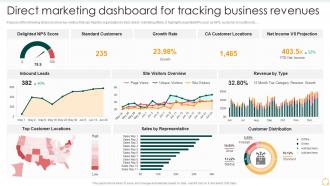 Direct Marketing Dashboard For Tracking Business Revenues Effective B2b Marketing Organization Set 2
Purpose of the following slide is to show key metrics that can help the organization to track direct marketing efforts, it highlights essential KPIs such as NPS, customer by location etc. Present the topic in a bit more detail with this Direct Marketing Dashboard For Tracking Business Revenues Effective B2b Marketing Organization Set 2. Use it as a tool for discussion and navigation on Marketing, Dashboard, Business. This template is free to edit as deemed fit for your organization. Therefore download it now.
-
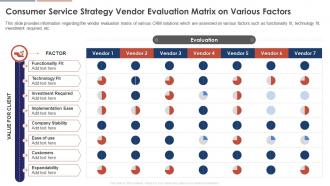 Consumer Service Strategy Vendor Evaluation Matrix On Various Factors Consumer Service Strategy Transformation
This slide provides information regarding the vendor evaluation matrix of various CRM solutions which are assessed on various factors such as functionality fit, technology fit, investment required, etc. Present the topic in a bit more detail with this Consumer Service Strategy Vendor Evaluation Matrix On Various Factors Consumer Service Strategy Transformation. Use it as a tool for discussion and navigation on Functionality Fit, Technology Fit, Investment Required, Implementation Ease. This template is free to edit as deemed fit for your organization. Therefore download it now.
-
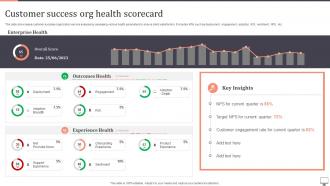 Customer Success Org Health Scorecard
This slide showcases customer success organization service analysis by assessing various health parameters to ensure client satisfaction. It includes KPIs such as deployment, engagement, adoption, ROI, sentiment, NPS, etc. Presenting our well-structured Customer Success Org Health Scorecard. The topics discussed in this slide are Customer Success, Org Health Scorecard. This is an instantly available PowerPoint presentation that can be edited conveniently. Download it right away and captivate your audience.
-
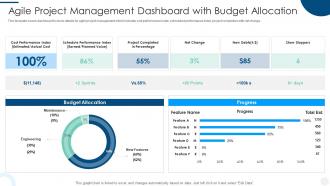 Agile Project Management Dashboard With Budget Allocation
This template covers dashboard to show details for agile project management which includes cost performance index, scheduled performance index, project completion with net change. Introducing our Agile Project Management Dashboard With Budget Allocation set of slides. The topics discussed in these slides are Cost Performance, Schedule Performance, Budget Allocation. This is an immediately available PowerPoint presentation that can be conveniently customized. Download it and convince your audience.
-
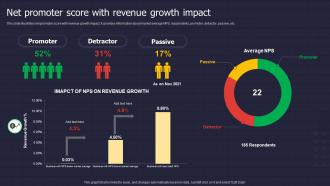 Net Promoter Score With Revenue Growth Impact
This slide illustrates net promoter score with revenue growth impact. It provides information about market average NPS, respondents, promoter, detractor, passive, etc. Introducing our Net Promoter Score With Revenue Growth Impact set of slides. The topics discussed in these slides are Promoter, Detractor, Passive, Revenue Growth. This is an immediately available PowerPoint presentation that can be conveniently customized. Download it and convince your audience.
-
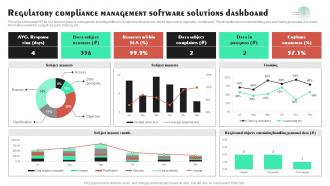 Regulatory Compliance Management Software Solutions Dashboard
This slide showcases KPI for risk and compliance management enabling shift from compliance driven to risk driven approach to regulatory compliance. This template aims on standardizing and automating processes. It includes information related to subject requests, training, etc. Presenting our well structured Regulatory Compliance Management Software Solutions Dashboard The topics discussed in this slide are Data Subject, Subject Request TrendsThis is an instantly available PowerPoint presentation that can be edited conveniently. Download it right away and captivate your audience.
-
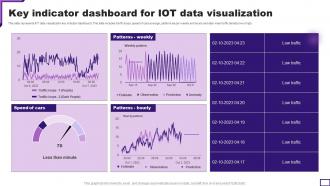 Key Indicator Dashboard For IOT Data Visualization
This slide represents IOT data visualization key indicator dashboard. This slide includes traffic loops, speed of cars average, patterns as per weekly and hourly and date wise traffic density low or high. Introducing our Key Indicator Dashboard For IOT Data Visualization set of slides. The topics discussed in these slides are Key Benefits With Data Visualization In IOT. This is an immediately available PowerPoint presentation that can be conveniently customized. Download it and convince your audience.
-
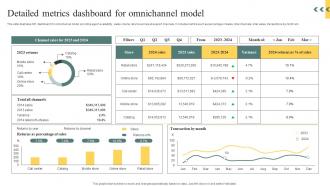 Detailed Metrics Dashboard For Omnichannel Model
This slide illustrates KPI dashboard for omnichannel model providing agent availability, sales volume returns across all support channels. It includes metrics such as percentage of sales, total channels, total sales, transactions by month etc. Presenting our well structured Detailed Metrics Dashboard For Omnichannel Model. The topics discussed in this slide are Dashboard, Omnichannel, Transactions. This is an instantly available PowerPoint presentation that can be edited conveniently. Download it right away and captivate your audience.
-
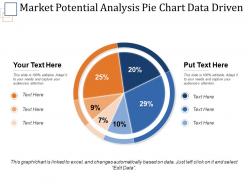 Market potential analysis pie chart data driven ppt slide
Presenting the slide named Market potential analysis Pie chart data driven PPT slide. This template with high-quality graphics is professionally designed. With an option to change the size, style and color of the font, this slide is totally editable. You can customize the text and color of the diagram as well as the background as per your discretion. The slide is compatible with Google Slides which make it easily accessible. You can customize and save the file as JPG or PDF formats. Once the pie chart is linked to excel, it automatically changes based on the data. Use this readymade template to analyse website visits instantly.
-
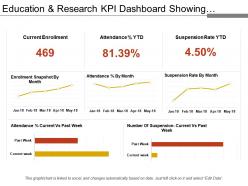 Education and research kpi dashboard showing attendance and suspension rate
Presenting education and research KPI dashboard showing attendance and suspension rate PPT slide. The suspension rate KPI dashboard PPT slide designed by the professional team of SlideTeam. The attendance rate report slide is 100% editable in PowerPoint. The attendance and detention KPI dashboard PowerPoint slide is compatible with Google Slide so a user can share this attendance rate dashboard slide with others. A user can make changes in the font size, font type, color as well as dimensions of the college acceptance rate dashboard PPT template as per the requirement. You may edit the value in the reporting tool KPI dashboard presentation template as the slide gets linked with the Excel sheet.
-
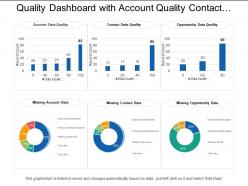 Quality dashboard snapshot with account quality contact data missing account data
Presenting this set of slides with name - Quality Dashboard Snapshot With Account Quality Contact Data Missing Account Data. This is a six stage process. The stages in this process are Quality Dashboard, Quality Kpi, Quality Metircs.
-
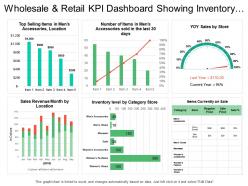 Wholesale and retail kpi dashboard showing inventory level by category sales revenue month
Presenting the retail business slide for PowerPoint. This presentation template is 100% modifiable in PowerPoint and is designed by professionals. You can edit the objects in the slide like font size and font color very easily. This presentation slide is fully compatible with Google Slide and can be saved in JPG or PDF file format without any fuss. Click on the download button to download this template in no time.
-
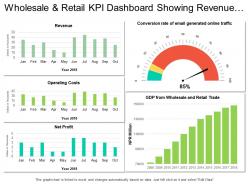 Wholesale and retail kpi dashboard showing revenue operating costs net profit
Presenting the KPI dashboard presentation template. This PowerPoint slide is fully editable in PowerPoint and is professionally designed. The user can bring changes to edit the objects in the slide like font size and font color without going through any hassle. This presentation slide is 100% compatible with Google Slide and can be saved in JPG or PDF file format without any fuss. Fast download this at the click of the button.
-
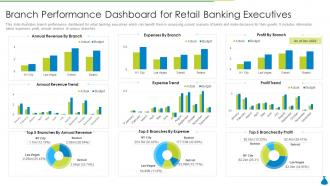 Branch performance dashboard for retail banking executives
Introducing our Branch Performance Dashboard For Retail Banking Executives set of slides. The topics discussed in these slides are Expenses, Revenue, Information. This is an immediately available PowerPoint presentation that can be conveniently customized. Download it and convince your audience.
-
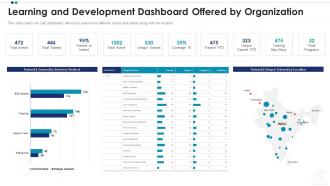 Learning and development dashboard employee professional growth ppt download
This slide covers the L and D dashboard offered by business to different teams and bands along with the location. Deliver an outstanding presentation on the topic using this Learning And Development Dashboard Employee Professional Growth Ppt Download. Dispense information and present a thorough explanation of Location, Product Training, Progress Workshop, Situational Leadership using the slides given. This template can be altered and personalized to fit your needs. It is also available for immediate download. So grab it now.
-
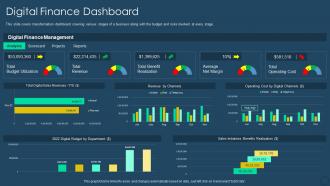 Exhaustive digital transformation deck digital finance dashboard
This slide covers transformation dashboard covering various stages of a business along with the budget and risks involved at every stage. Present the topic in a bit more detail with this Exhaustive Digital Transformation Deck Digital Finance Dashboard. Use it as a tool for discussion and navigation on Digital Finance Dashboard. This template is free to edit as deemed fit for your organization. Therefore download it now.
-
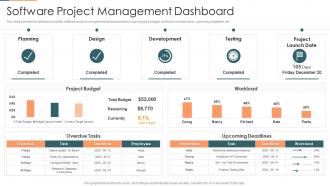 Project management plan for spi software project management dashboard
This slide provides the glimpse about the software project management dashboard which covers project budget, workload, overdue tasks, upcoming deadlines, etc. Present the topic in a bit more detail with this Project Management Plan For Spi Software Project Management Dashboard. Use it as a tool for discussion and navigation on Software Project Management Dashboard. This template is free to edit as deemed fit for your organization. Therefore download it now.
-
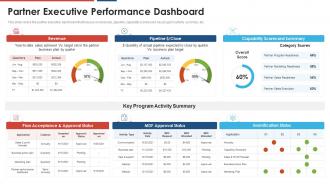 Partner executive performance dashboard build a dynamic partnership
This slide covers the partner executive dashboard that focuses on revenues, pipeline, capability scoreboard, key program activity summary, etc.Deliver an outstanding presentation on the topic using this Partner Executive Performance Dashboard Build A Dynamic Partnership. Dispense information and present a thorough explanation of Business Plan By Quarter, Business Plan Target, Quantity Of Actual Pipeline using the slides given. This template can be altered and personalized to fit your needs. It is also available for immediate download. So grab it now.
-
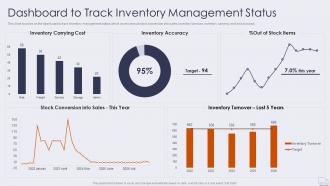 Dashboard to track inventory improving logistics management operations
This slide focuses on the dashboard to track inventory management status which covers annual stock conversion into sales, inventory turnover, inventory carrying cost and accuracy.Deliver an outstanding presentation on the topic using this Dashboard To Track Inventory Improving Logistics Management Operations. Dispense information and present a thorough explanation of Inventory Carrying Cost, Inventory Accuracy, Stock Conversion using the slides given. This template can be altered and personalized to fit your needs. It is also available for immediate download. So grab it now.
-
 Cost Management Dashboard Snapshot Cloud Complexity Challenges And Solution
This slide covers dashboard platform for the resource organization, resource security, auditing, and cost. It also includes reporting, dashboards, budgets, optimizations, etc. Deliver an outstanding presentation on the topic using this Cost Management Dashboard Cloud Complexity Challenges And Solution. Dispense information and present a thorough explanation of Entity Summary, Potential Savings, Cost By Service using the slides given. This template can be altered and personalized to fit your needs. It is also available for immediate download. So grab it now.
-
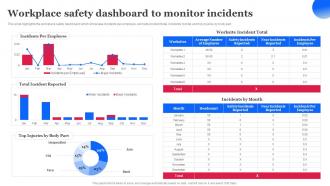 Workplace Safety Dashboard To Monitor Incidents Workplace Safety Management Hazard
This slide highlights the workplace safety dashboard which showcase incidents per employee, worksite incident total, incidents by total and top injuries by body part. Deliver an outstanding presentation on the topic using this Workplace Safety Dashboard To Monitor Incidents Workplace Safety Management Hazard. Dispense information and present a thorough explanation of Workplace Safety, Dashboard, Monitor Incidents using the slides given. This template can be altered and personalized to fit your needs. It is also available for immediate download. So grab it now.
-
 Project Data Quality Metrics Summary Dashboard With Threshold
This slide covers different KPIs to measure performance of data quality for project completion. It includes metric such as consistency, completeness, orderliness, timeliness, accuracy, auditability and uniqueness with thresholds. Presenting our well structured Project Data Quality Metrics Summary Dashboard With Threshold. The topics discussed in this slide are Consistency, Dashboard, Completeness. This is an instantly available PowerPoint presentation that can be edited conveniently. Download it right away and captivate your audience.
-
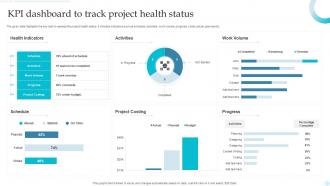 Kpi Dashboard To Track Project Health Status
The given slide highlights the key task to assess the project health status. It includes indicators such as schedule, activities, work volume, progress, costs, actual, planned etc. Introducing our Kpi Dashboard To Track Project Health Status set of slides. The topics discussed in these slides are Health Indicators, Activities, Work Volume. This is an immediately available PowerPoint presentation that can be conveniently customized. Download it and convince your audience.
-
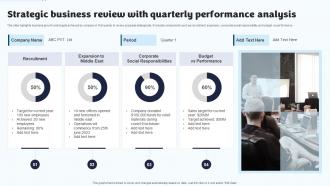 Strategic Business Review With Quarterly Performance Analysis
This slide highlights business growth and targets achieved by company in first quarter to review progress strategically. It includes components such as recruitment, expansion, corporate social responsibility and budget vs performance. Introducing our Strategic Business Review With Quarterly Performance Analysis set of slides. The topics discussed in these slides are Analysis Recruitment, Expansion To Middle East, Corporate Social Responsibilities. This is an immediately available PowerPoint presentation that can be conveniently customized. Download it and convince your audience.
-
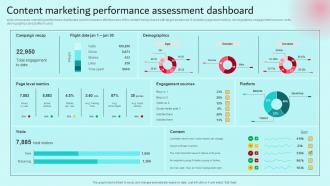 Content Marketing Performance Assessment Dashboard Brand Content Strategy Guide MKT SS V
slide showcases marketing performance dashboard used to measure effectiveness of the content being shared with target audiences. It includes page level metrics, demographics, engagement sources, visits, demographics and platform used. Deliver an outstanding presentation on the topic using this Content Marketing Performance Assessment Dashboard Brand Content Strategy Guide MKT SS V. Dispense information and present a thorough explanation of Marketing, Performance, Sources using the slides given. This template can be altered and personalized to fit your needs. It is also available for immediate download. So grab it now.
-
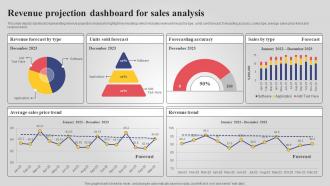 Revenue Projection Dashboard For Sales Analysis
This slide depicts dashboard representing revenue projection analysis to highlight key headings which includes revenue forecast by type, units sold forecast, forecasting accuracy, sales type, average sales price trend and revenue trend. Introducing our Revenue Projection Dashboard For Sales Analysis set of slides. The topics discussed in these slides are Revenue Forecast By Type, Units Sold Forecast. This is an immediately available PowerPoint presentation that can be conveniently customized. Download it and convince your audience.
-
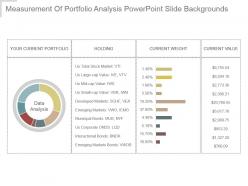 Measurement of portfolio analysis powerpoint slide backgrounds
Presenting measurement of portfolio analysis powerpoint slide backgrounds. This is a measurement of portfolio analysis powerpoint slide backgrounds. This is a seven stage process. The stages in this process are data analysis, your current portfolio, holding, current weight, current value.
-
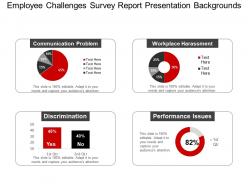 Employee challenges survey report presentation backgrounds
Presenting employee challenges survey report presentation backgrounds. This is a employee challenges survey report presentation backgrounds. This is a four stage process. The stages in this process are survey, forecasting, statistics.
-
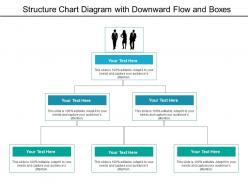 Structure chart diagram with downward flow and boxes
Presenting this set of slides with name - Structure Chart Diagram With Downward Flow And Boxes. This is a three stage process. The stages in this process are Structure Chart, Structured Programming, Software Engineering.
-
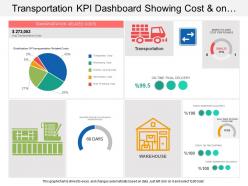 Transportation kpi dashboard showing cost and on time final delivery
Presenting transportation KPI dashboard showing cost and on time final delivery PPT slide. This deck offers you plenty of space to put in titles and sub titles. This template is Excel linked just right click to input your information. High resolution based layout, does not change the image even after resizing. This presentation icon is fully compatible with Google slides. Quick downloading speed and simple editing options in color text and fonts.PPT icons can easily be changed into JPEG and PDF applications.
-
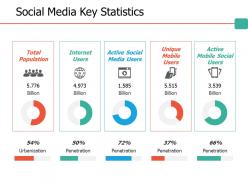 Social media key statistics ppt professional files
Presenting this set of slides with name - Social Media Key Statistics Ppt Professional Files. This is a five stage process. The stages in this process are Business, Management, Strategy, Analysis, Icons.


