Operational Efficiency Ratios Powerpoint Presentation Slides
Operational Efficiency Ratios PowerPoint Presentation Slides are ideal to present efficiency of company management. In today’s competitive market world managers are required to track performances without going through a pile of paperwork, our professional slides can assist them to overview operations in a visual and easy manner. Management efficiency PowerPoint template is a useful presentation for the business professionals that contains slides like inventory ratios, company target, sales dashboard, business timeline, financial ratio, operating ratio etc. All of them are arranged in the profession looking layout. Dashboard given in this deck can be used to present critical interrelated indicators. This financial efficiency ratio PowerPoint design also fits well with business concepts such as ratio analysis, liquidity and profitability, financial management and many more. Download turnover ratio PowerPoint complete deck to compare operating expense to net sales. Folks feel jovial due to our Operational Efficiency Ratios Powerpoint Presentation Slides. Present boring ratios in a new and creative manner.
- Google Slides is a new FREE Presentation software from Google.
- All our content is 100% compatible with Google Slides.
- Just download our designs, and upload them to Google Slides and they will work automatically.
- Amaze your audience with SlideTeam and Google Slides.
-
Want Changes to This PPT Slide? Check out our Presentation Design Services
- WideScreen Aspect ratio is becoming a very popular format. When you download this product, the downloaded ZIP will contain this product in both standard and widescreen format.
-

- Some older products that we have may only be in standard format, but they can easily be converted to widescreen.
- To do this, please open the SlideTeam product in Powerpoint, and go to
- Design ( On the top bar) -> Page Setup -> and select "On-screen Show (16:9)” in the drop down for "Slides Sized for".
- The slide or theme will change to widescreen, and all graphics will adjust automatically. You can similarly convert our content to any other desired screen aspect ratio.
Compatible With Google Slides

Get This In WideScreen
You must be logged in to download this presentation.
PowerPoint presentation slides
Presenting Operational Efficiency Ratios PowerPoint Presentation Slides. The presentation includes 24 PowerPoint slides. The deck is 100% editable in PowerPoint. Edit the font size, font type, text and color as per your requirements. Downloaded in both widescreen (16:9) and standard (4:3) screen aspect ratio. Includes visually appealing images, charts, layouts, and icons. Compatible with Google Slides, PDF and JPG formats.
People who downloaded this PowerPoint presentation also viewed the following :
Content of this Powerpoint Presentation
Slide 1: This is an introductory slide for Operational Efficiency Ratios.
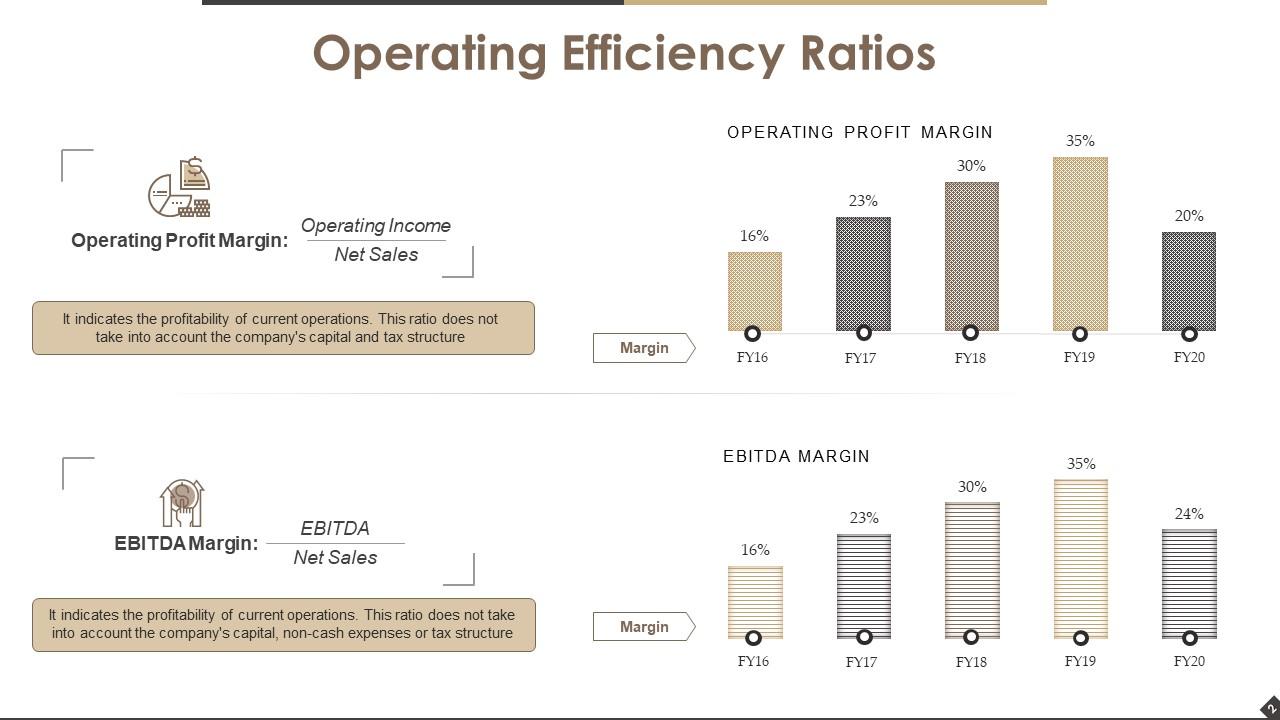
Slide 2: This slide presents Operating Efficiency Ratios with the following sub headings- Operating Profit Margin, EBITDA Margin.
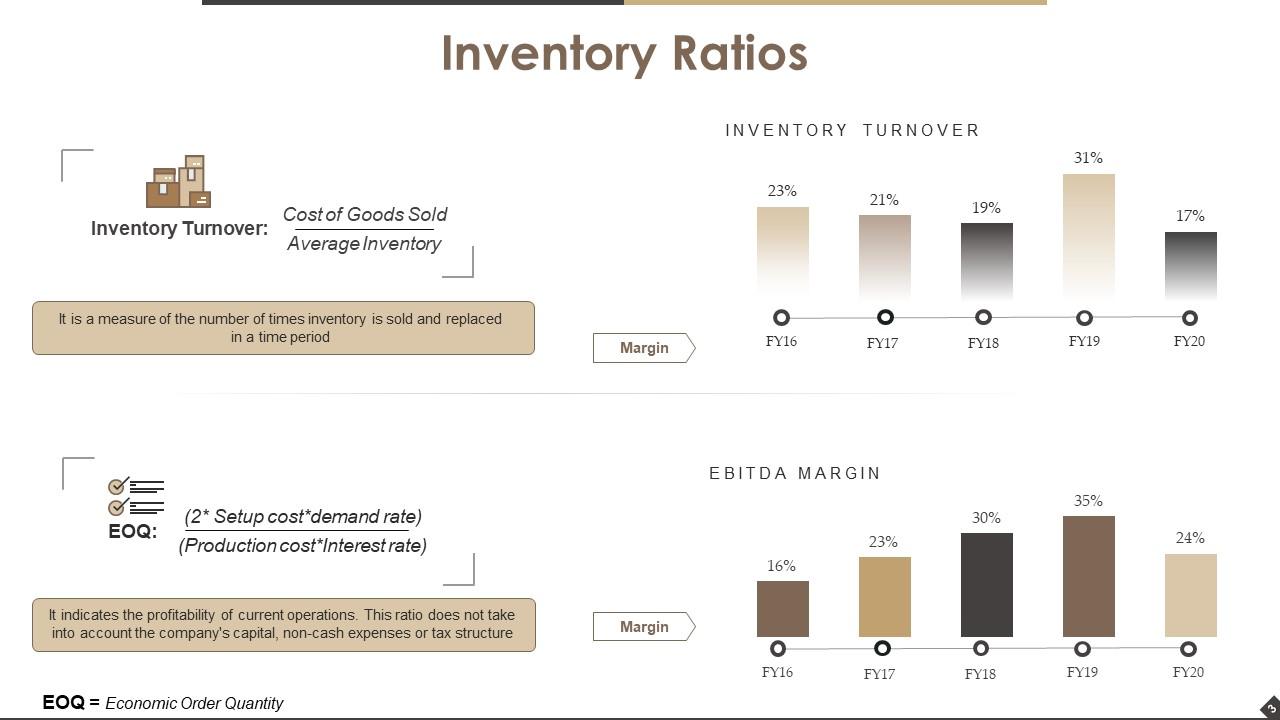
Slide 3: This slide shows Inventory Ratios with Inventory Turnover and EOQ (Economic Order Quantity).
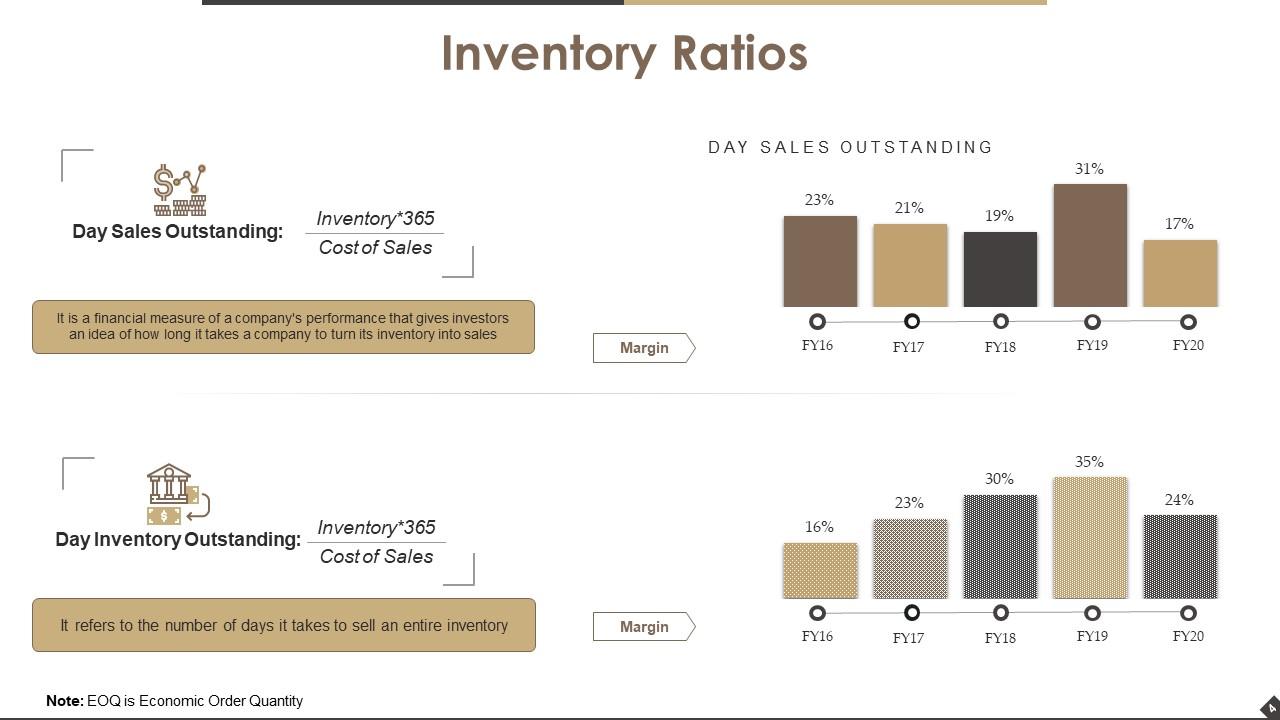
Slide 4: This slide shows Inventory Ratios with subheadings of- Day Sales Outstanding and Day Inventory Outstanding.
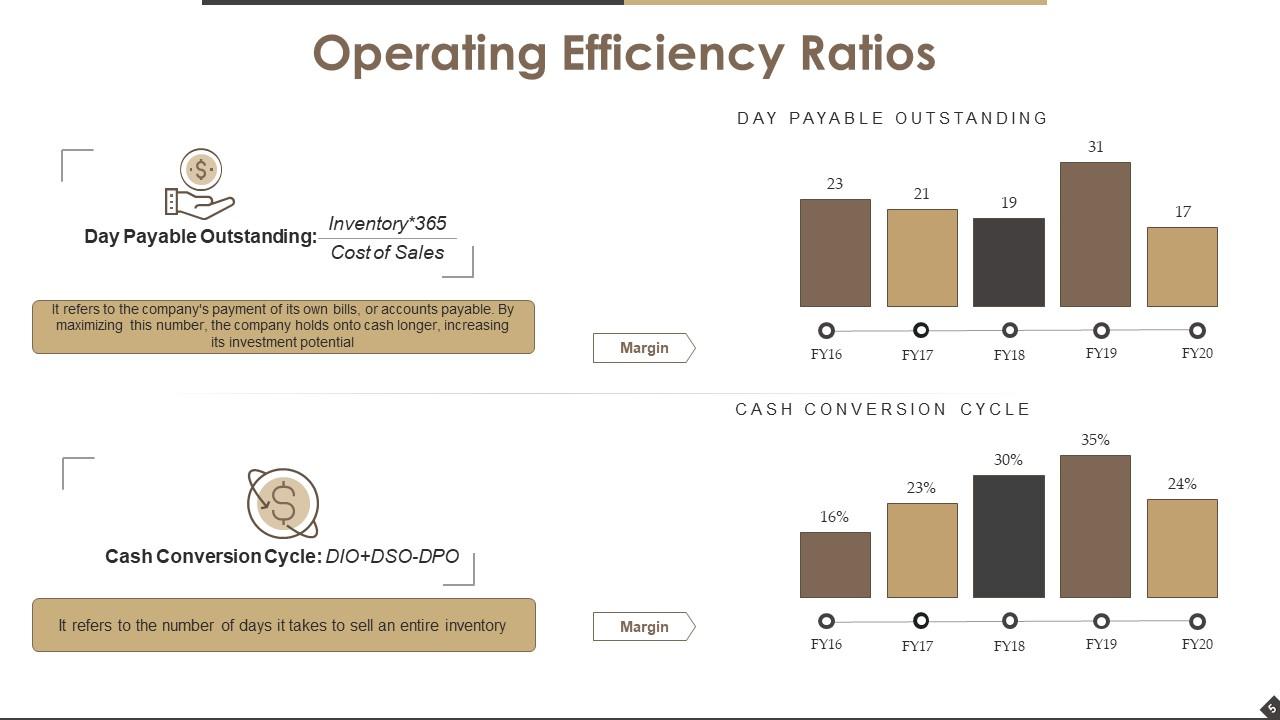
Slide 5: This slide shows Operating Efficiency Ratios with the following subheadings- Day Payable Outstanding and Cash Conversion cycle.
Slide 6: This is a Coffee Break slide to halt.
Slide 7: This slide is titled Additional slides to move forward.
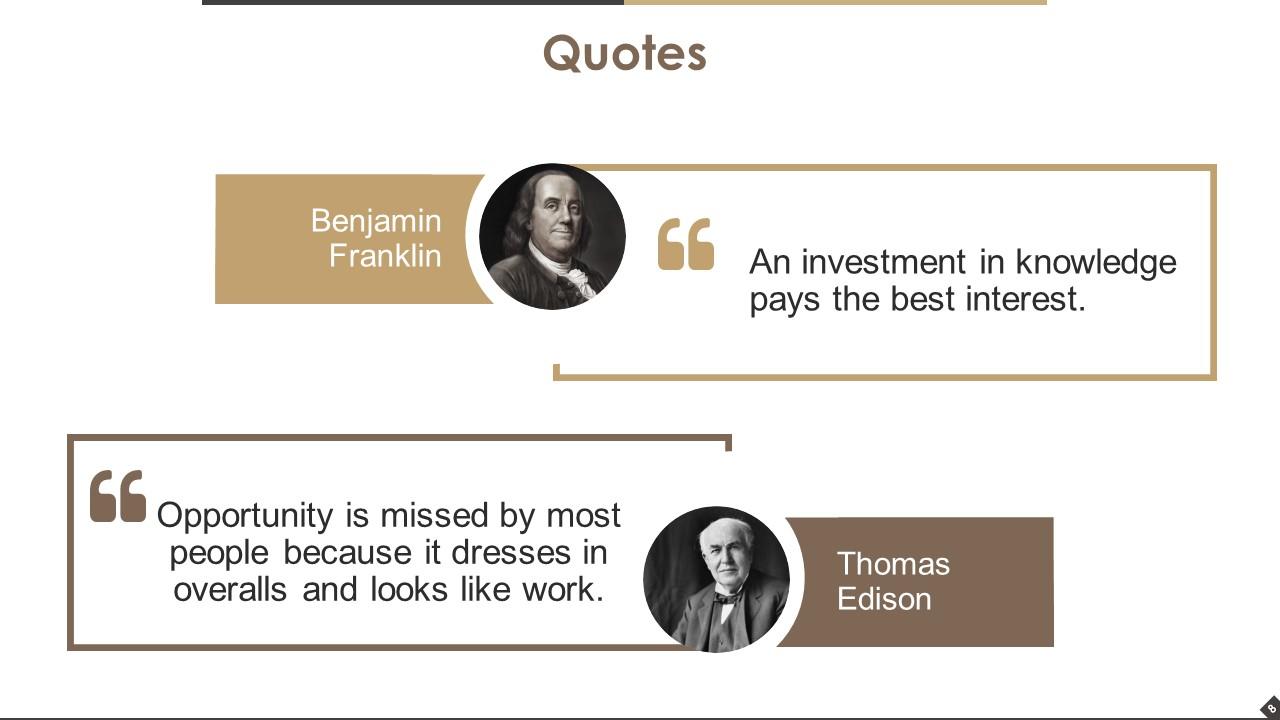
Slide 8: This is a Quotes slide. State any highlighting factor, values through Quote.
Slide 9: This slide presents Our Team with name, image & text boxes.
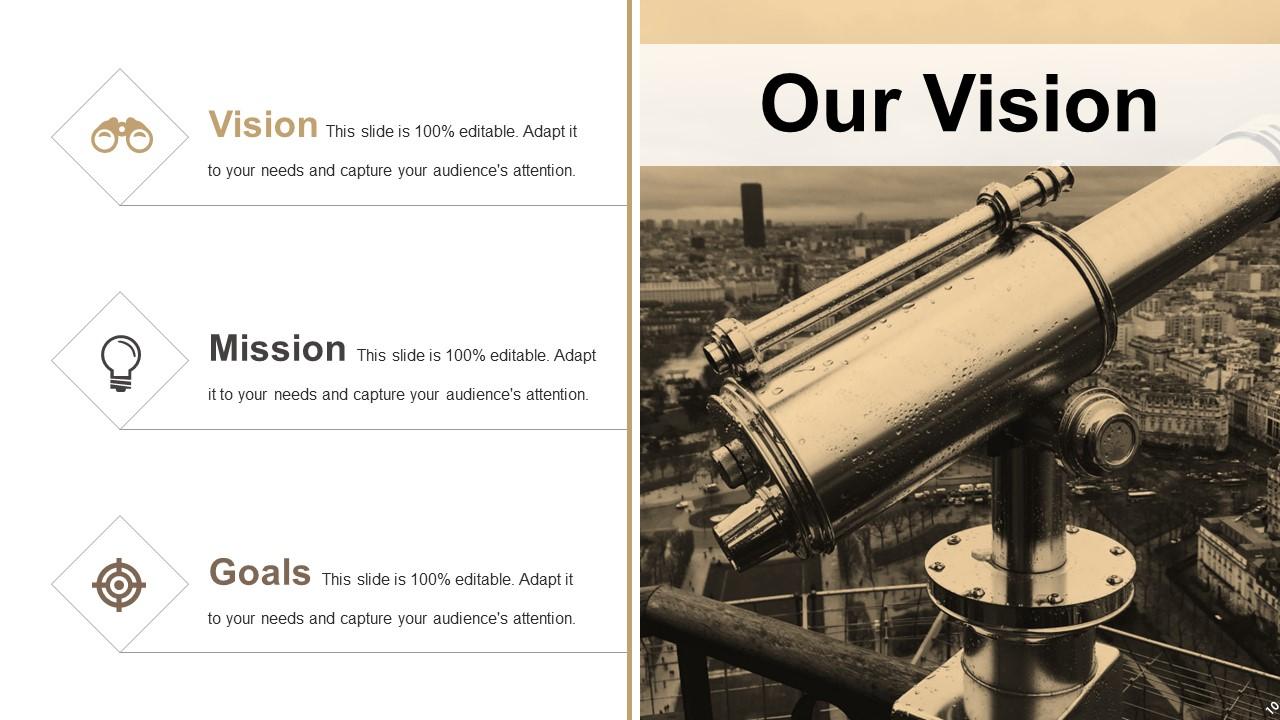
Slide 10: This is Our Vision slide showing Vision, Mission and Goals. State them here.
Slide 11: This is an About Us slide. State about your company team, company essentials, highlights etc. here.
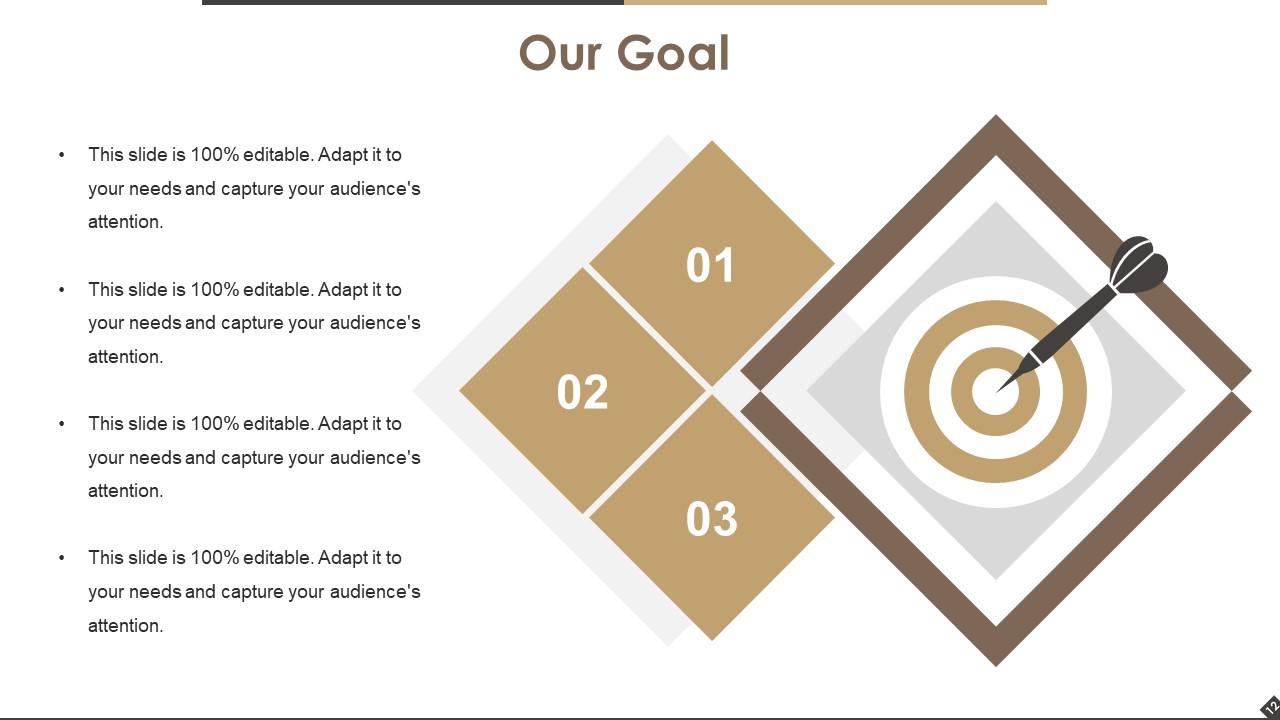
Slide 12: This is an Our Goal slide. State your goals here.
Slide 13: This is a Target slide. State your targets etc. here.
Slide 14: This slide shows a Bulb or Idea. State creative, innovative aspects etc. here.
Slide 15: This is a Venn diagram slide. Show information, etc. here.
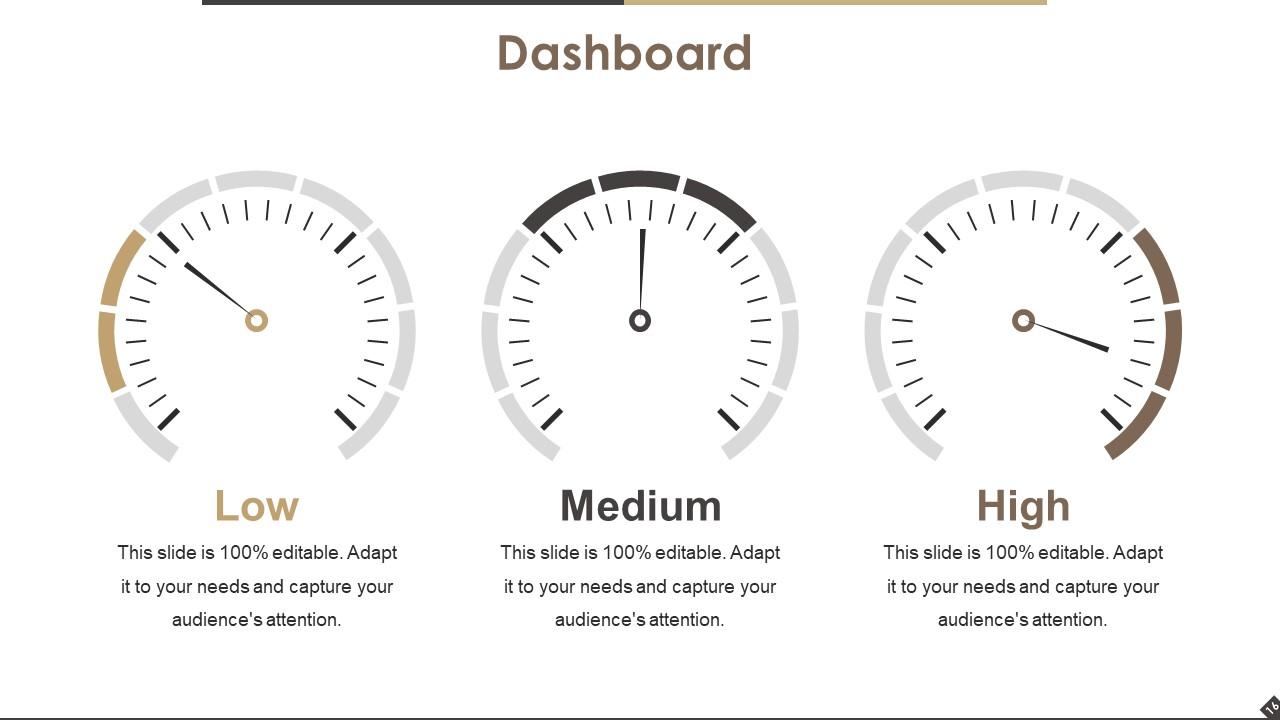
Slide 16: This is a Dashboard slide. Present High Low and Medium aspects etc. here.
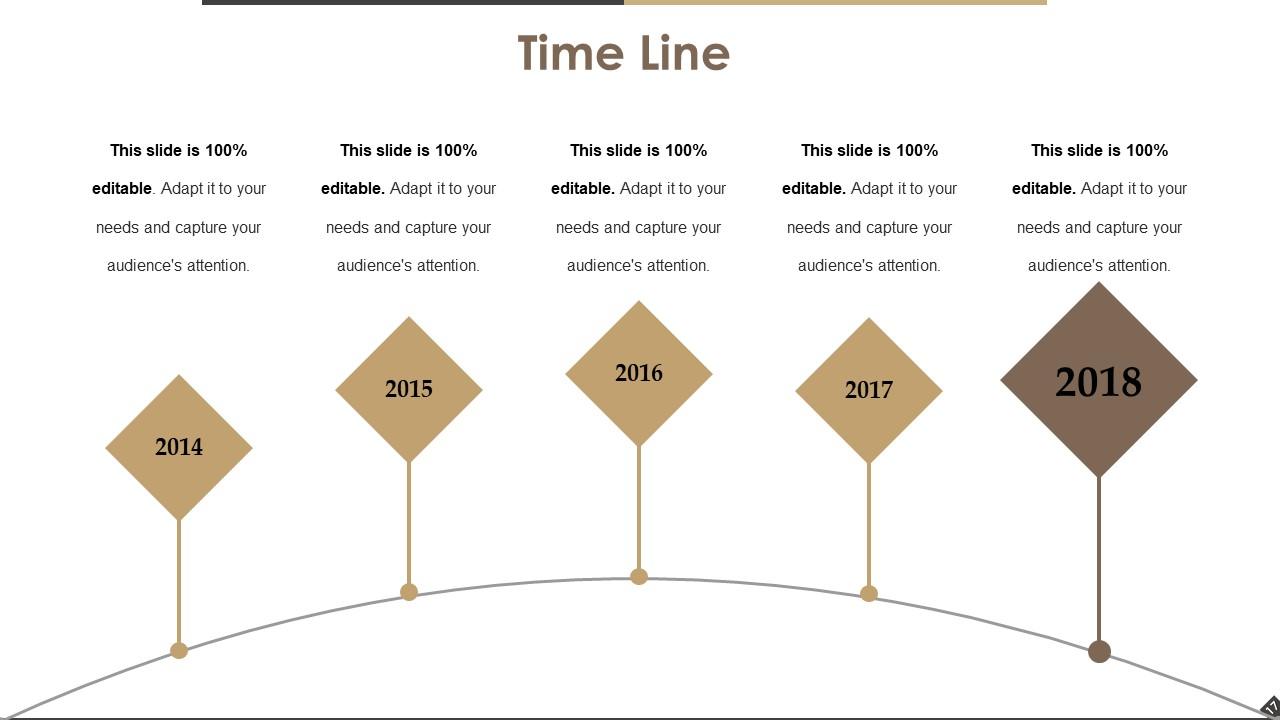
Slide 17: This is a Time Line slide to show company/product growth, position, milestones etc.
Slide 18: This is a Bar Graph titled heading slide. Edit as per your requirement.
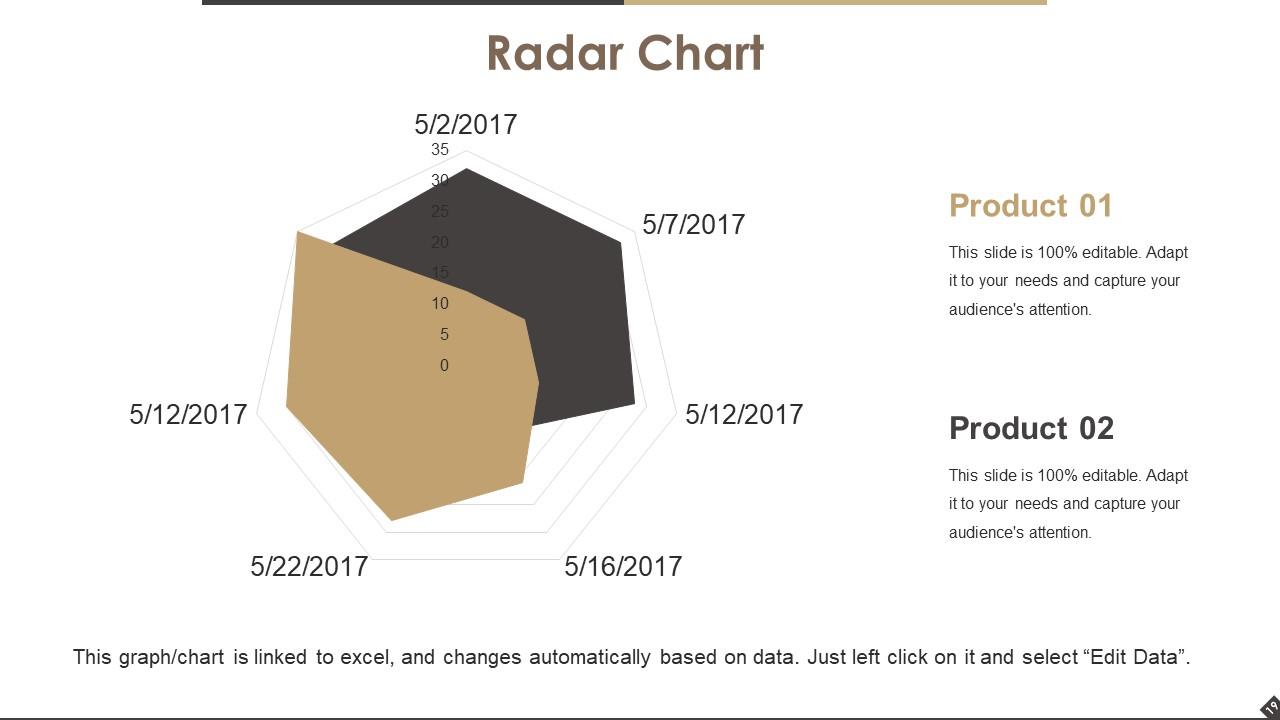
Slide 19: This is a Radar Chart to show product comparison.
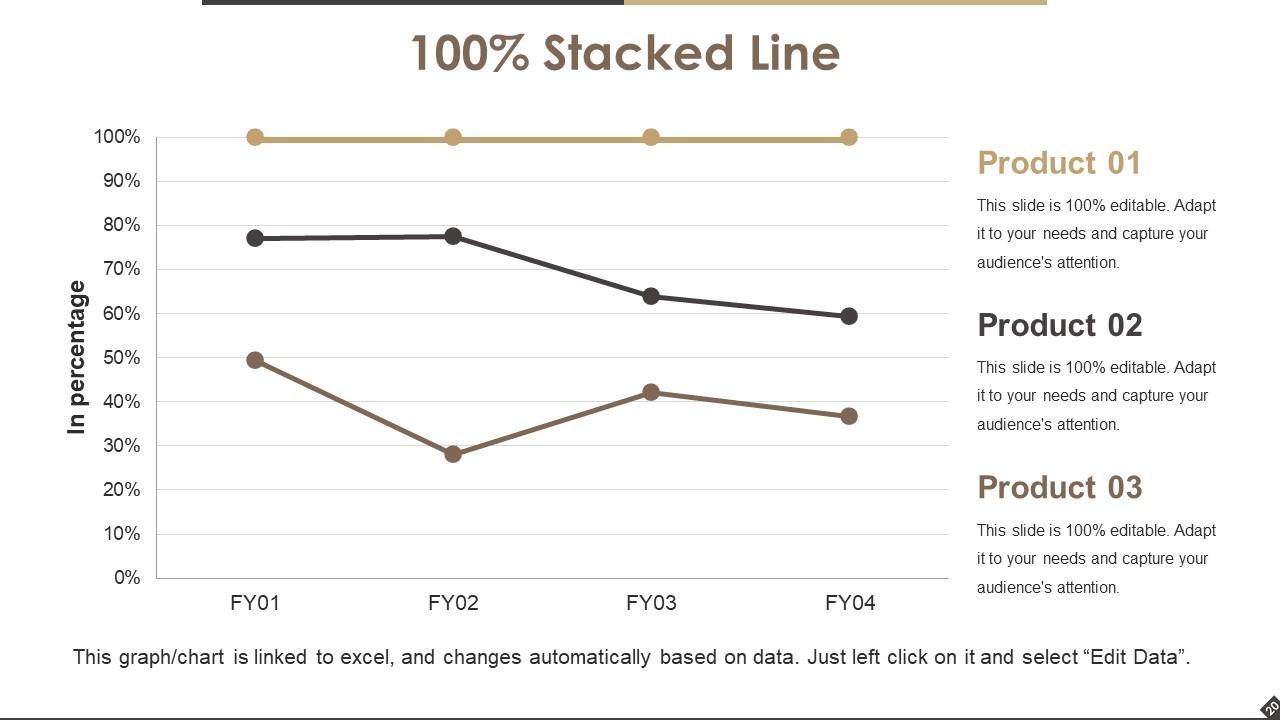
Slide 20: This slide shows a Stacked Line for product perfomance etc.
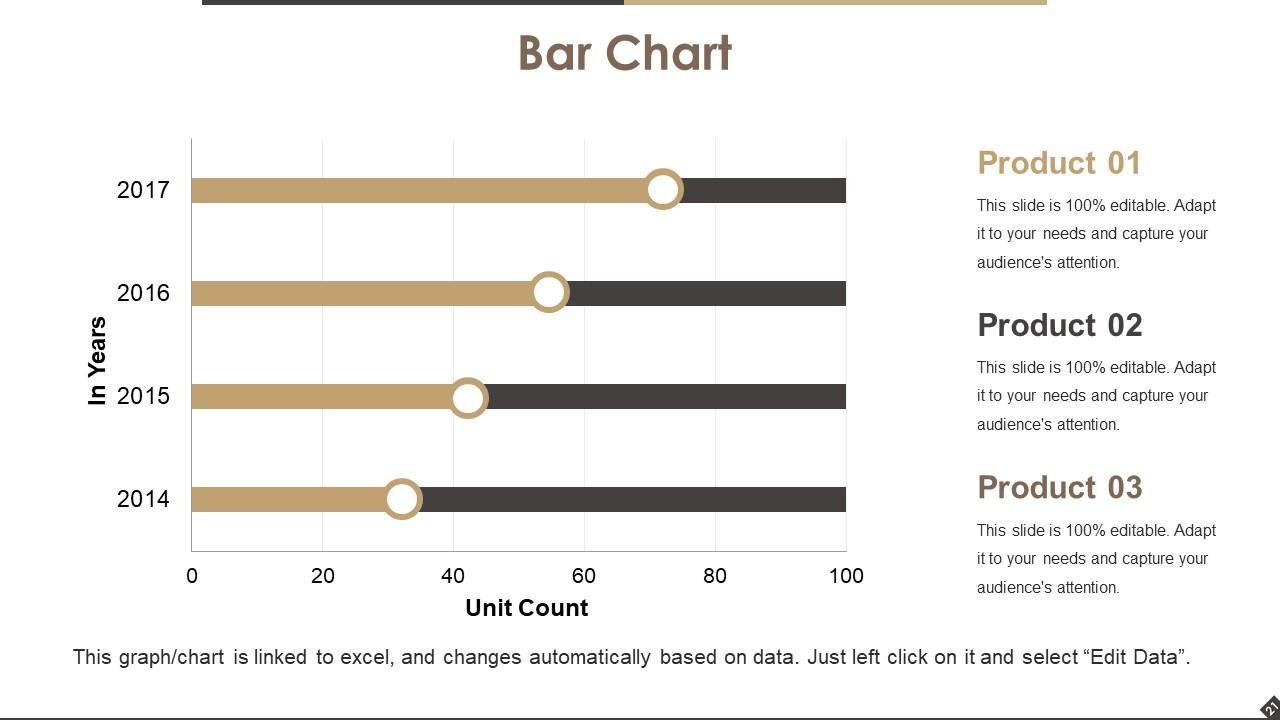
Slide 21: This is a Bar Chart to showcase product comparison.
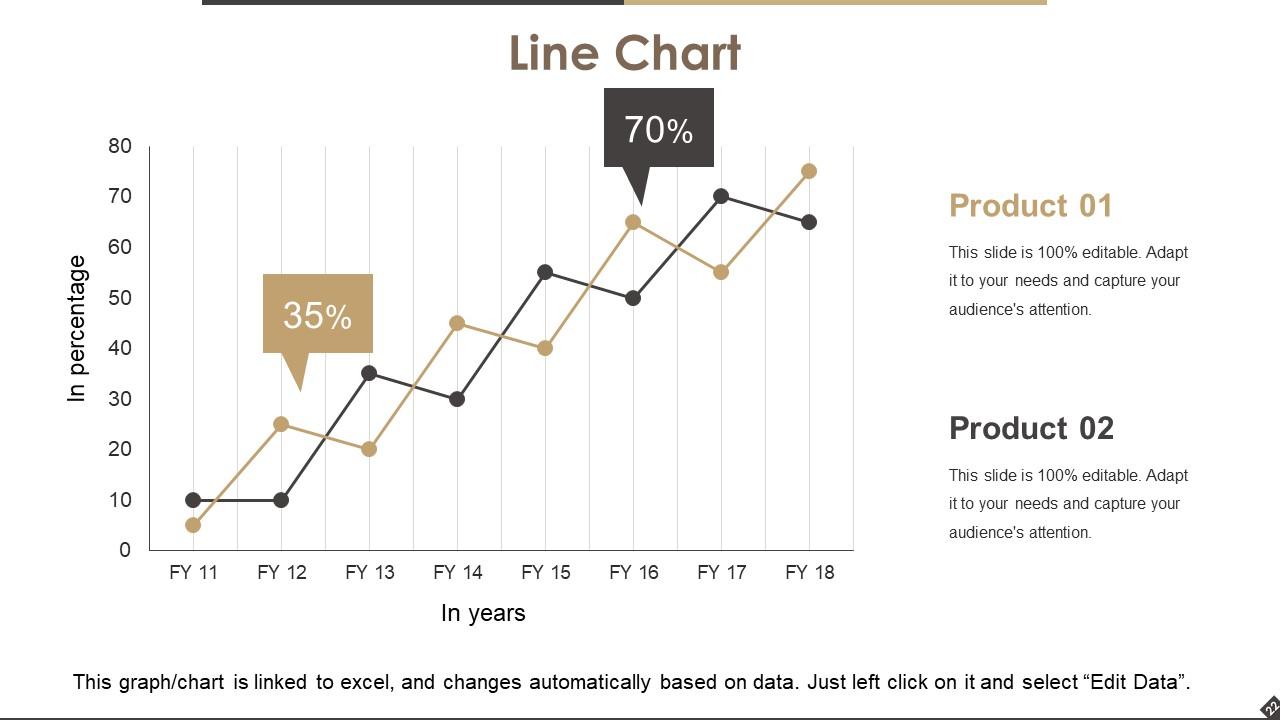
Slide 22: This slide presents a Line Chart for showcasing product/company growth etc.
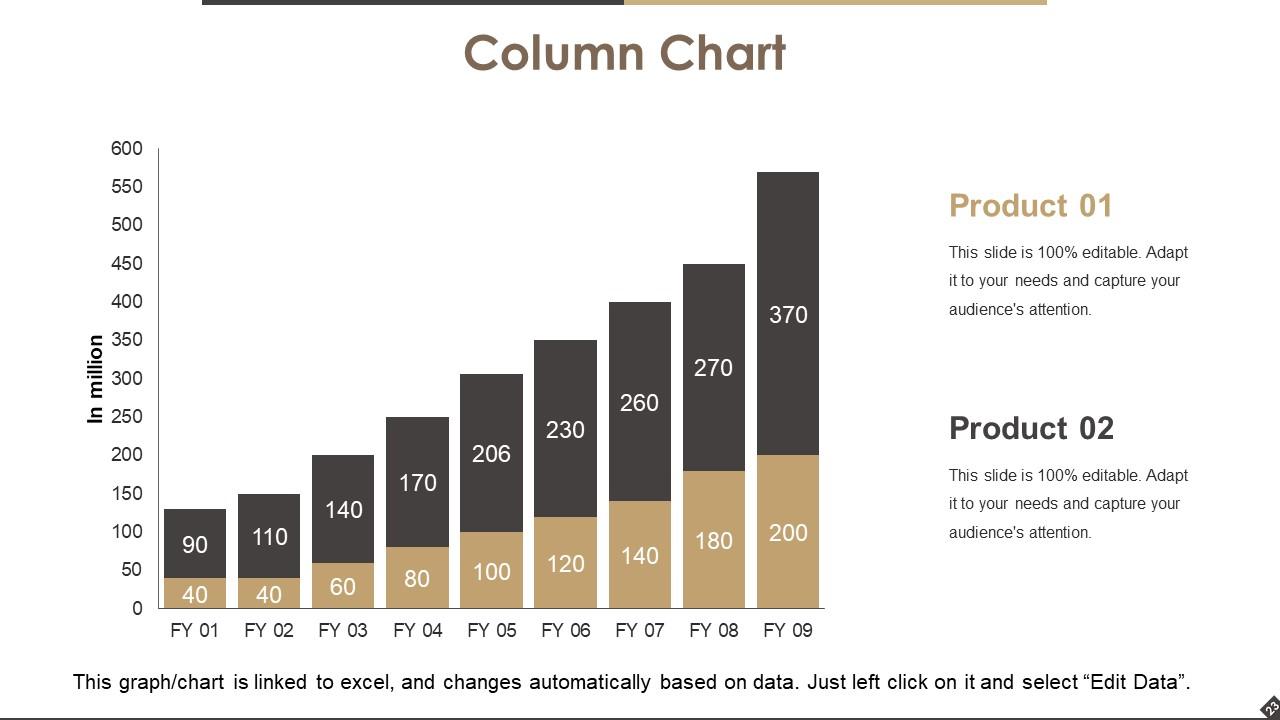
Slide 23: This slide shows a Column Chart for product comparison etc.
Slide 24: This is a Thank You slide with Address:# Street Number, City, State, Contact Number, Email Address.
Operational Efficiency Ratios Powerpoint Presentation Slides with all 24 slides:
Broaden the database with our Operational Efficiency Ratios Powerpoint Presentation Slides. Get a bigger bandwidth to choose from.
-
Very unique, user-friendly presentation interface.
-
Really like the color and design of the presentation.


