Dashboards Measuring PowerPoint Designs, Presentations Slides & PPT Shapes
- Sub Categories
-
- Arrows and Targets
- Bullet and Text Slides
- Charts and Graphs
- Circular Cycle Diagrams
- Concepts and Shapes
- Custom Flat Designs
- Dashboards and Measuring
- Flow Process
- Funnels
- Gears
- Growth
- Harvey Balls
- Idea Innovation and Light Bulbs
- Leadership
- Linear Process Diagrams
- Magnifying Glass
- Misc Other Graphics
- Opportunity and Handshake
- Organization Charts
- Puzzles
- Pyramids
- Roadmaps and Timelines
- Silhouettes
- Steps
- Strategic Planning Analysis
- SWOT Analysis
- Tables and Matrix
- Teamwork
- Technology and Communication
- Venn Diagrams
- Visuals and Illustrations
-
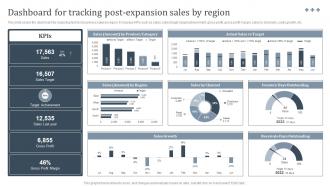 Dashboard For Tracking International Strategy To Expand Global Strategy SS V
This slide covers the dashboard for analyzing fast food business sales by region. It includes KPIs such as sales, sales target, target achievement, gross profit, gross profit margin, sales by channels, sales growth, etc. Deliver an outstanding presentation on the topic using this Dashboard For Tracking International Strategy To Expand Global Strategy SS V. Dispense information and present a thorough explanation of Tracking, Sales, Actual using the slides given. This template can be altered and personalized to fit your needs. It is also available for immediate download. So grab it now.
-
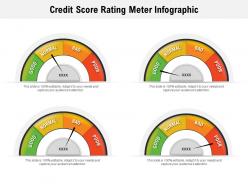 Credit score rating meter infographic
Presenting Credit Score Rating Meter Infographic slide. This PPT supports both the standard(4:3) and widescreen(16:9) sizes. This presentation is very easy to download and can be converted into numerous images or document formats including JPEG, PNG, or PDF. It is also compatible with Google Slides and editable in PowerPoint. Alter the style, size, color, background, and other attributes according to your requirements. Moreover, high-quality images prevent the lowering of quality.
-
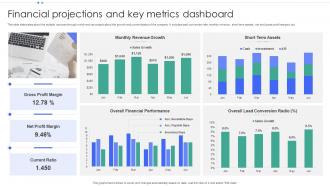 Financial Projections And Key Metrics Dashboard
This slide elaborates about the multiple sources through which one can project about the growth and current status of the company. It includes lead conversion rate, monthly revenue , short term assets , net and gross profit margins, etc. Presenting our well structured Financial Projections And Key Metrics Dashboard. The topics discussed in this slide are Gross Profit Margin, Net Profit Margin, Current Ratio. This is an instantly available PowerPoint presentation that can be edited conveniently. Download it right away and captivate your audience.
-
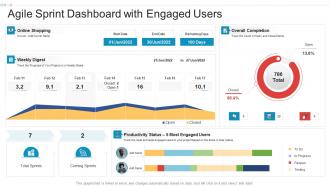 Agile sprint dashboard with engaged users
Introducing our Agile Sprint Dashboard With Engaged Users set of slides. The topics discussed in these slides are Agile Sprint Dashboard With Engaged Users. This is an immediately available PowerPoint presentation that can be conveniently customized. Download it and convince your audience.
-
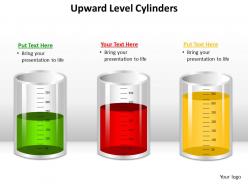 Upward Level Cylinders Glass Beakers Measuring With Liquid Half Filled Powerpoint Diagram Templates Graphics 712
These high quality, editable pre-designed upward level cylinders glass beakers measuring with liquid half filled powerpoint diagram templates graphics 712 powerpoint slides and powerpoint templates have been carefully created by our professional team to help you impress your audience. Each graphic in every powerpoint slide is vector based and is 100% editable in powerpoint.
-
 Essential Construction Activities Management Dashboard Construction Playbook
This slide provides information regarding essential construction activities management dashboard with details about site inspection, rework costs, safety meetings, etc. Deliver an outstanding presentation on the topic using this Essential Construction Activities Management Dashboard Construction Playbook. Dispense information and present a thorough explanation of Customer Satisfaction Ratio, Project Type, Net Promoter Score, Customer Complaints using the slides given. This template can be altered and personalized to fit your needs. It is also available for immediate download. So grab it now
-
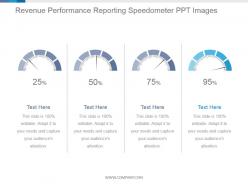 Revenue performance reporting speedometer ppt images
Presenting revenue performance reporting speedometer ppt images. This is a revenue performance reporting speedometer ppt images. This is a four stage process. The stages in this process are dashboard, measure, percentage, business, marketing.
-
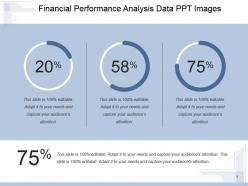 Financial performance analysis data ppt images
Presenting financial performance analysis data ppt images. This is a financial performance analysis data ppt images. This is a three stage process. The stages in this process are business, success, strategy, finance, management, analysis.
-
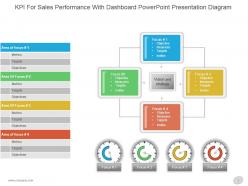 Kpi for sales performance with dashboard powerpoint presentation diagram
Presenting kpi for sales performance with dashboard powerpoint presentation diagram. This is a kpi for sales performance with dashboard powerpoint presentation diagram. This is a four stage process. The stages in this process are area of focus, metrics, objectives, focus, objective, measures, targets, invites, vision and strategy.
-
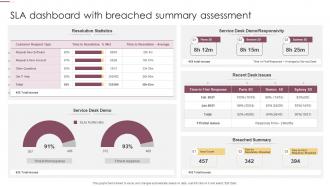 SLA Dashboard With Breached Summary Assessment
Presenting our well structured SLA Dashboard With Breached Summary Assessment. The topics discussed in this slide are Resolution Statistics, Service Desk Demo, Recent Desk Issues. This is an instantly available PowerPoint presentation that can be edited conveniently. Download it right away and captivate your audience.
-
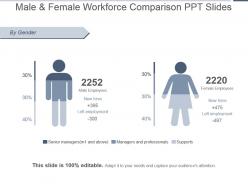 Male and female workforce comparison ppt slides
Presenting male and female workforce comparison ppt slides. This is a male and female workforce comparison ppt slides. This is a two stage process. The stages in this process are by gender, male employees, new hires, left employment, female employees, senior managers m1 and above, managers and professionals, supports.
-
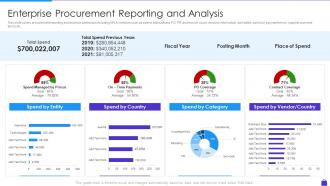 Enterprise Procurement Reporting And Analysis Purchasing Analytics Tools And Techniques
This slide covers procurement reporting and analysis dashboard including KPI and metrices such as spend, transactions, PO, PR and invoice count, invoices information, due dates, spend by payment terms, supplier payment terms etc. Deliver an outstanding presentation on the topic using this Enterprise Procurement Reporting And Analysis Purchasing Analytics Tools And Techniques. Dispense information and present a thorough explanation of On Time Payments, PO Coverage, Contract Coverage using the slides given. This template can be altered and personalized to fit your needs. It is also available for immediate download. So grab it now.
-
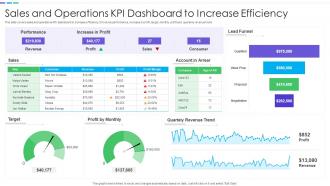 Sales And Operations KPI Dashboard To Increase Efficiency
This slide covers sales and operations KPI dashboard to increase efficiency. It involves performance, increase in profit, target, monthly profit and quarterly revenue trend. Introducing our Sales And Operations KPI Dashboard To Increase Efficiency set of slides. The topics discussed in these slides are Increase In Profit, Quartely Revenue Trend, Account In Arrear. This is an immediately available PowerPoint presentation that can be conveniently customized. Download it and convince your audience.
-
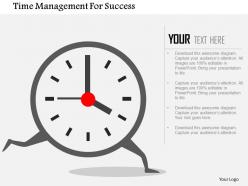 Time management for success flat powerpoint design
We are proud to present our time management for success flat powerpoint design. Concept of time management for success has been displayed in this PPT diagram. This PPT diagram contains the graphic of alarm clock with foot. Use this PPT diagram for business and management related presentations.
-
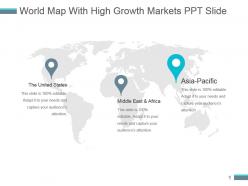 World map with high growth markets ppt slide
Presenting world map with high growth markets ppt slide. Presenting world map with high growth markets ppt slide. This is a world map with high growth markets ppt slide. This is a three stage process. The stages in this process are the united states, middle east and africa, asia pacific.
-
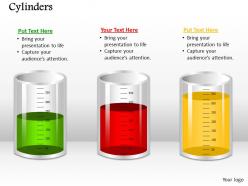 0514 Three Liquid Measuring Cylinders Medical Images For Powerpoint
We are proud to present our 0514 three liquid measuring cylinders medical images for powerpoint. To display the liquid measurement techniques use our three liquid measuring cylinders Power Point template. This Power Point template is very useful for scientific measurement display of any liquid quantity. To display any measurement related data you can use this template in your presentation and create a good impression during presentation.
-
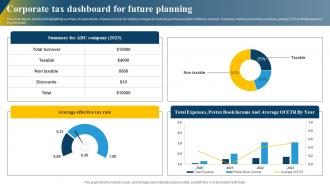 Corporate Tax Dashboard For Future Planning
This slide depicts dashboard highlighting summary of corporate tax of particular year for helping company to make proper financial plan in future to save tax. It involves metrics such as tax summary, average ETR and total expense income graph. Introducing our Corporate Tax Dashboard For Future Planning set of slides. The topics discussed in these slides are Average, Income, Planning. This is an immediately available PowerPoint presentation that can be conveniently customized. Download it and convince your audience.
-
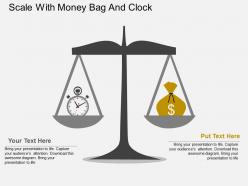 Scale with money bag and clock flat powerpoint design
All images are 100% editable in the presentation design. Good quality images can be used to compliment and reinforce message. Works well in Windows 7, 8, 10, XP, Vista and Citrix. Editing in presentation slide show can be done from anywhere by any device. Students, teachers, businessmen or industrial managers can put to use the PPT layout as per their requirement.
-
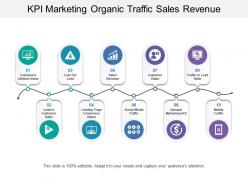 Kpi marketing organic traffic sales revenue
Presenting this set of slides with name - Kpi Marketing Organic Traffic Sales Revenue. This is a ten stage process. The stages in this process are Kpi, Dashboard, Metrics.
-
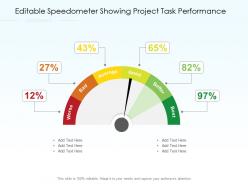 Editable speedometer showing project task performance
Presenting this set of slides with name Editable Speedometer Showing Project Task Performance. The topics discussed in these slide is Editable Speedometer Showing Project Task Performance. This is a completely editable PowerPoint presentation and is available for immediate download. Download now and impress your audience.
-
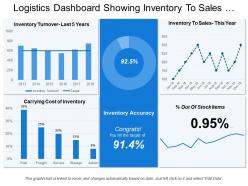 Logistics dashboard showing inventory to sales and inventory turnover
Presenting Logistics Dashboard Showing Inventory To Sales And Inventory Turnover PPT slide. The inventory to sale dashboard PowerPoint template designed professionally by the team of SlideTeam to present the annual report to clients and investors too. The different charts such as bar, line and many other, along with that the text in the inventory dashboard slide are customizable in PowerPoint. The logistics inventory dashboard slide is compatible with Google Slide. An individual can make changes in the font size, font type, color and dimensions of the different icons according to the requirement. This graphical inventory slide gets linked with Excel Data Sheet.
-
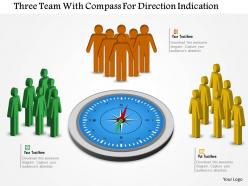 Three teams with compass for direction indication flat powerpoint design
We are proud to present our three teams with compass for direction indication flat powerpoint design. This power point template diagram has been designed with graphic of three teams and compass. These teams are used to show teamwork and direction indication. Use this PPT diagram for business and management related presentations.
-
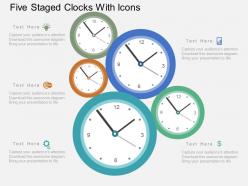 Ce five staged clocks with icons flat powerpoint design
Presenting five staged clocks with icons flat PowerPoint design. This deck offers you plenty of space to put in titles and sub titles. High resolution based layout, does not change the image even after resizing. This presentation icon is fully compatible with Google slides. Quick downloading speed and simple editing options in color text and fonts.PPT icons can easily be changed into JPEG and PDF applications. This diagram has been designed for entrepreneurs, corporate and business managers. Easy to use, edit and you can design attractive slides within few minutes.
-
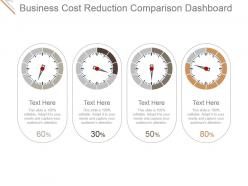 Business cost reduction comparison dashboard snapshot ppt ideas
Presenting business cost reduction comparison dashboard ppt ideas. This is a business cost reduction comparison dashboard snapshot ppt ideas. This is a four stage process. The stages in this process are business, meter, measure, reduction, cost.
-
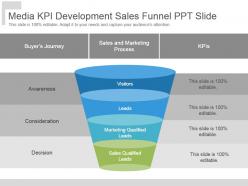 Media kpi development sales funnel ppt slide
Presenting media kpi development sales funnel ppt slide. This is a media kpi development sales funnel ppt slide. This is a four stage process. The stages in this process are visitors, leads, marketing qualified leads, sales qualified leads, decision, consideration, awareness.
-
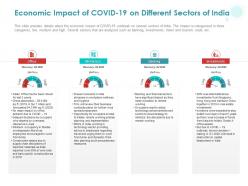 Economic impact of covid 19 on different sectors of india ppt powerpoint presentation icon
This slide provides details about the economic impact of COVID 19 outbreak on several sectors of India. The impact is categorized in three categories, low, medium and high. Several sectors that are analyzed such as banking, investments, travel and tourism, retail, etc. Presenting this set of slides with name Economic Impact Of COVID 19 On Different Sectors Of India Ppt Powerpoint Presentation Icon. This is a four stage process. The stages in this process are Office, Workplace, Banking, Investments. This is a completely editable PowerPoint presentation and is available for immediate download. Download now and impress your audience.
-
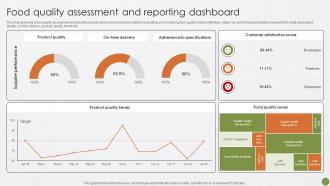 Food Quality Assessment And Reporting Food Quality Best Practices For Food Quality And Safety Management
This slide presents a food quality assessment and reporting dashboard to present real-time data for evaluating and monitoring food quality metrics effectively. Major key performance indicators covered in the slide are product, quality, on time, delivery, product, quality, trends etc. Present the topic in a bit more detail with this Food Quality Assessment And Reporting Food Quality Best Practices For Food Quality And Safety Management. Use it as a tool for discussion and navigation on Product Quality Trends, Customer Satisfaction Score, Food Quality Issues. This template is free to edit as deemed fit for your organization. Therefore download it now.
-
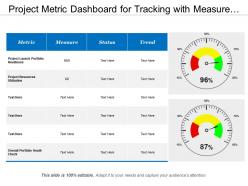 Project metric dashboard for tracking with measure status trend
Presenting this set of slides with name - Project Metric Dashboard For Tracking With Measure Status Trend. This is a two stage process. The stages in this process are Project Kpis, Project Dashboard, Project Metrics.
-
 Performance meter high productivity level gauge
Presenting, the performance meter PowerPoint Presentation Slide. This Presentation has been designed professionally and is fully editable. You can customize the font size, font type, colors, and even the background. This Template is obedient with Google Slide and can be saved in JPG or PDF format without any hassle. Fast download at the click of the button.
-
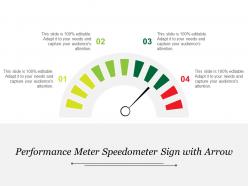 Performance meter speedometer sign with arrow
This highly versatile, innovative design is completely editable; you can modify the design the way you want. Slides are fully compatible with Google Slides and MS PowerPoint software. Instant and quick downloading available; you can save the design into your system into various formats such as JPEG or PDF. Both standard and wide screen view are available; no effect on design quality when opened on wide screen view.
-
 0514 Four Measuring Test Tubes For Medical Use Medical Images For Powerpoint
We are proud to present our 0514 four measuring test tubes for medical use medical images for powerpoint. To show the measurement concepts use this 3d graphic four measuring test tubes Power Point template. This Power Point template is very useful for scientific measurement display of any liquid quantity. Use this slide in your medical or science related presentation.
-
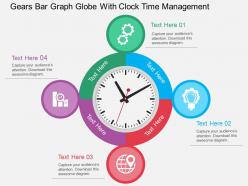 Gears bar graph globe with clock time management flat powerpoint design
We are proud to present our gears bar graph globe with clock time management flat powerpoint design. Graphic of gears and bar graph with clock has been used to craft this power point template diagram. This PPT diagram contains the concept of time management and result analysis .Use this PPT diagram for marketing and business related presentations.
-
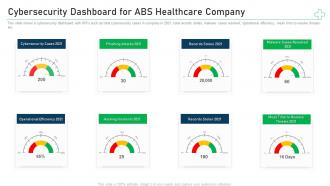 Cybersecurity dashboard for abs minimize cybersecurity threats in healthcare company
This slide shows a cybersecurity dashboard with KPIs such as total cybersecurity cases in company in 2021, total records stoles, malware cases resolved, operational efficiency, mean time to resolve threats etc. Deliver an outstanding presentation on the topic using this Cybersecurity Dashboard For Abs Minimize Cybersecurity Threats In Healthcare Company. Dispense information and present a thorough explanation of Cybersecurity Cases, Phishing Attacks, Records Stolen, Operational Efficiency, Hacking Incidents using the slides given. This template can be altered and personalized to fit your needs. It is also available for immediate download. So grab it now.
-
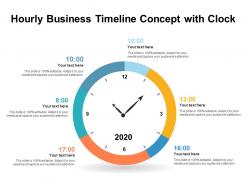 Hourly business timeline concept with clock
Presenting this set of slides with name Hourly Business Timeline Concept With Clock. This is a six stage process. The stages in this process are Hourly Business Timeline Concept With Clock. This is a completely editable PowerPoint presentation and is available for immediate download. Download now and impress your audience.
-
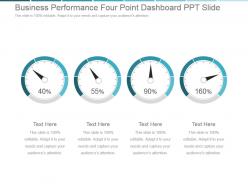 Business performance four point dashboard snapshot ppt slide
Presenting business performance four point dashboard snapshot ppt slide. This is a business performance four point dashboard ppt slide. This is a four stage process. The stages in this process are business, success, dashboard, finance, strategy.
-
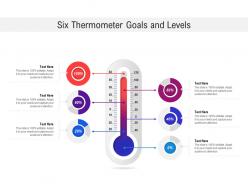 Six thermometer goals and levels
Presenting this set of slides with name Six Thermometer Goals And Levels. This is a six stage process. The stages in this process are Six Thermometer Goals And Levels. This is a completely editable PowerPoint presentation and is available for immediate download. Download now and impress your audience.
-
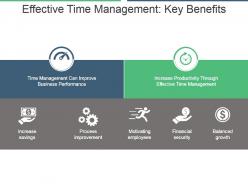 Effective time management key benefits powerpoint graphics
Presenting effective time management key benefits powerpoint graphics. This is a effective time management key benefits powerpoint graphics. This is a two stage process. The stages in this process are increase savings, process improvement, motivating employees, financial security balanced, growth.
-
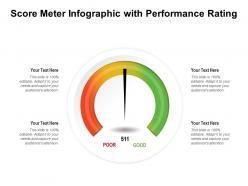 Score meter infographic with performance rating
Presenting Score Meter Infographic With Performance Rating slide. This PPT supports both the standard(4:3) and widescreen(16:9) sizes. This presentation is very easy to download and can be converted into numerous images or document formats including JPEG, PNG, or PDF. It is also compatible with Google Slides and editable in PowerPoint. Alter the style, size, color, background, and other attributes according to your requirements. Moreover, high-quality images prevent the lowering of quality.
-
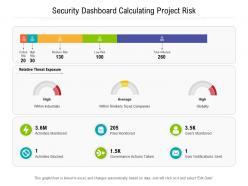 Security dashboard calculating project risk
Presenting this set of slides with name Security Dashboard Calculating Project Risk. The topics discussed in these slides are Medium Risk, Low Risk, Activities Monitored, Files Monitored, Users Monitored. This is a completely editable PowerPoint presentation and is available for immediate download. Download now and impress your audience.
-
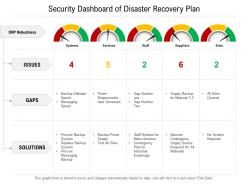 Security dashboard of disaster recovery plan
Presenting this set of slides with name Security Dashboard Of Disaster Recovery Plan. The topics discussed in these slides are Messaging Speed, Power Requirements, Gap Number, Supply Backup, Procure Backup System. This is a completely editable PowerPoint presentation and is available for immediate download. Download now and impress your audience.
-
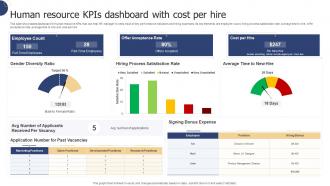 Human Resource KPIs Dashboard With Cost Per Hire
This slide showcases dashboard for human resource KPIs that can help HR manager to keep track of key performance indicators and hiring expenses. Its key elements are employee count, hiring process satisfaction rate, average time to hire, offer acceptance rate, average time to hire and cost per hire. Introducing our Human Resource KPIs Dashboard With Cost Per Hire set of slides. The topics discussed in these slides are Gender Diversity Ratio, Hiring Process Satisfaction Rate, Signing Bonus Expense. This is an immediately available PowerPoint presentation that can be conveniently customized. Download it and convince your audience.
-
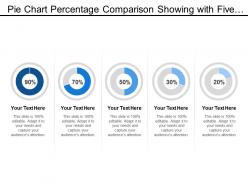 Pie chart percentage comparison showing with five categories
Presenting this set of slides with name - Pie Chart Percentage Comparison Showing With Five Categories. This is a five stage process. The stages in this process are Percentage Comparison, Percentage Compare, Percentage Balancing.
-
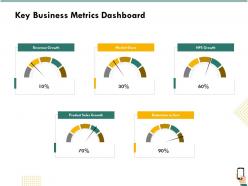 Key business metrics dashboard snapshot growth ppt powerpoint gallery slides
Presenting this set of slides with name Key Business Metrics Dashboard Snapshot Growth Ppt Powerpoint Gallery Slides. This is a five stage process. The stages in this process are Revenue Growth, Market Share, NPS Growth, Product Sales Growth, Reduction In Cost. This is a completely editable PowerPoint presentation and is available for immediate download. Download now and impress your audience.
-
 Newspaper headlines sensation breaking report extra weekly world
Explore, newspaper headlines sensation PowerPoint Presentation Slide. This Presentation has been designed by professionals and is fully editable. You can have access to play with the font size, font type, colors, and even the background. This Template is friendly with Google Slide and can be saved in JPG or PDF format without any obstacle created. Fast download at the click of the button. .
-
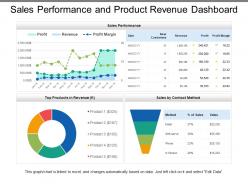 Sales performance and product revenue dashboard
Presenting this set of slides with name - Sales Performance And Product Revenue Dashboard. Amazing representation of content used in the PowerPoint slide. Good quality pixels used in the designing. High resolution presentation design does not affect the quality even when projected on wide screen. Easy convert into different formats such as JPG and PDF. Compatible with maximum number of software and Google slides. Easy to add and remove content as per business need. Totally modifiable PPT template as text, icons and graphics are editable. Insert Company’s personalized content and logo.
-
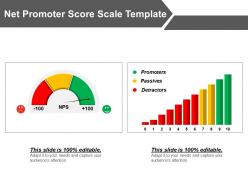 Net promoter score scale template powerpoint graphics
Presenting net promoter score scale PPT template. This Presentation graphic is eloquent and beneficial for the students, researchers, specialists from various fields. The composition features of this PowerPoint image allow you to modify the appearance and layout. This PPT design has enough scope to insert the title or subtitles respectively. The impeccable Presentation design is well acquainted with all Google Slides. They also provide an option to add your business logo too.
-
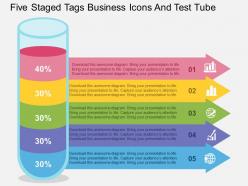 Five staged tags business icons and test tube flat powerpoint design
They are much embellished PowerPoint templates. They are comfortably adaptable into different compositions like PDF or JPG. They have completely alterable fonts, designs, text, colors, PowerPoint images etc. They can be used with Google slide and other applicable software applications. They have an immensely high quality PPT designs. They are also very beneficial for the business analyst, mangers etc.
-
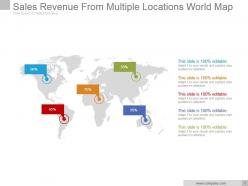 Sales revenue from multiple locations world map powerpoint ideas
Presenting sales revenue from multiple locations world map powerpoint ideas. This is a sales revenue from multiple locations world map powerpoint ideas. This is a five stage process. The stages in this process are business, marketing, location, world map, global.
-
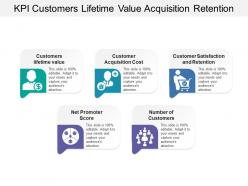 Kpi customers lifetime value acquisition retention
Presenting this set of slides with name - Kpi Customers Lifetime Value Acquisition Retention. This is a five stage process. The stages in this process are Kpi, Dashboard, Metrics.
-
 Shipping KPI Icon For Tracking Order Delivery Delays
Introducing our premium set of slides with Shipping KPI Icon For Tracking Order Delivery Delays. Elucidate the three stages and present information using this PPT slide. This is a completely adaptable PowerPoint template design that can be used to interpret topics like Shipping KPI, Icon, Tracking, Order Delivery Delays. So download instantly and tailor it with your information.
-
 Thermometer goal with pointer and stars
Presenting this set of slides with name Thermometer Goal With Pointer And Stars. This is a three stage process. The stages in this process are Thermometer Goal With Pointer And Stars. This is a completely editable PowerPoint presentation and is available for immediate download. Download now and impress your audience.
-
 Lead time icon with speed lines
Presenting Lead Time Icon With Speed Lines slide. This PPT supports both the standard(4:3) and widescreen(16:9) sizes. This presentation is very easy to download and can be converted into numerous images or document formats including JPEG, PNG, or PDF. It is also compatible with Google Slides and editable in PowerPoint. Alter the style, size, color, background, and other attributes according to your requirements. Moreover, high-quality images prevent the lowering of quality.
-
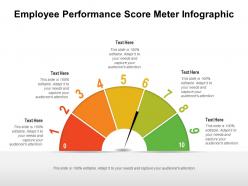 Employee performance score meter infographic
Presenting our Employee Performance Score Meter Infographic. This PPT theme is available in both 4:3 and 16:9 aspect ratios. Choose this PPT graphic to display apt and suitable comparative graphs, charts, and images. This PPT layout is 100% adaptable allowing you to modify the font, color, font size, and shapes. This PPT presentation is also Google Slides compatible making it easily accessible. Without further ado, click the download button!
-
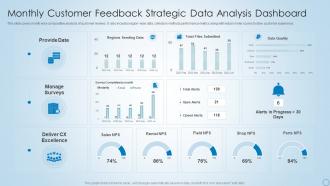 Monthly Customer Feedback Strategic Data Analysis Dashboard Snapshot
This slide covers month wise comparative analysis of customer reviews . It also includes region- wise data, collection methods performance metrics along with net promoter scores to drive customer experience. Introducing our Monthly Customer Feedback Strategic Data Analysis Dashboard Snapshoset of slides. The topics discussed in these slides are Provide Data, Manage Surveys, Deliver CX Excellence. This is an immediately available PowerPoint presentation that can be conveniently customized. Download it and convince your audience.
-
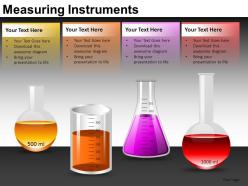 Measuring Instruments Powerpoint Presentation Slides Db
These high quality, editable pre-designed powerpoint slides and powerpoint templates have been carefully created by our professional team to help you impress your audience. Each graphic in every powerpoint slide is vector based and is 100% editable in powerpoint. Each and every property of any slide - color, size, shading etc can be modified to build an effective powerpoint presentation. Use these slides to convey complex business concepts in a simplified manner. Any text can be entered at any point in the powerpoint slide. Simply DOWNLOAD, TYPE and PRESENT!
-
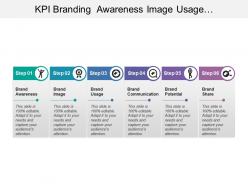 Kpi branding awareness image usage communication
Presenting this set of slides with name - Kpi Branding Awareness Image Usage Communication. This is a six stage process. The stages in this process are Kpi, Dashboard, Metrics.
-
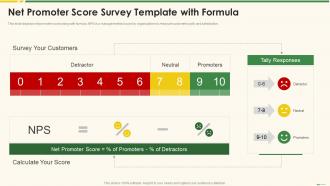 Net Promoter Score Survey Template With Formula Marketing Best Practice Tools And Templates
This slide displays net promoter score along with formula. NPS is a management tool used by organizations to measure customer loyalty and satisfaction. Increase audience engagement and knowledge by dispensing information using Net Promoter Score Survey Template With Formula Marketing Best Practice Tools And Templates. This template helps you present information on three stages. You can also present information on Net Promoter Score Survey Template With Formula using this PPT design. This layout is completely editable so personaize it now to meet your audiences expectations.
-
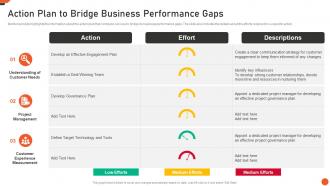 Action Plan To Bridge Business Performance Gaps M And A Playbook
Mentioned slide highlights the information about the action plan that company can use to bridge its business performance gaps. The slide also includes the details about the efforts required for a specific action. Present the topic in a bit more detail with this Action Plan To Bridge Business Performance Gaps M And A Playbook. Use it as a tool for discussion and navigation on Target Technology And Tools, Effective Engagement Plan, Deal Winning Team, Develop Governance Plan. This template is free to edit as deemed fit for your organization. Therefore download it now.
-
 3d meter for calculation flat powerpoint design
We are proud to present our 3d meter for calculation flat powerpoint design. This power point template diagram has been crafted with graphic of 3d meter. This PPT diagram contains the concept of calculation. Use this PPT diagram for business and technology related presentations.
-
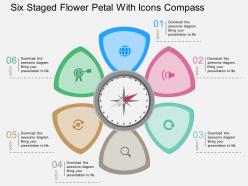 Six staged flower petal with icons compass flat powerpoint design
We are proud to present our six staged flower petal with icons compass flat powerpoint design. Six staged flower petal with icons has been used to craft this power point diagram. This PPT diagram contains the concept of process flow. Use this PPT diagram for business and marketing related presentations.


