Continuous Service Enhancement Powerpoint Presentation Slides
Identify opportunities for improvement using Continuous Service Enhancement PowerPoint presentation slides. Analyse which metrics need to be monitored and measure the impact of improvement efforts with the help of content-ready continuous service enhancement PPT templates. Let these professionally designed continuous service enhancement PPT slides take methods from quality management to learn from past success and failures. Work towards improving the efficiency of IT processes and services by adding ITIL continual service improvement PowerPoint templates. This ready-to-use continuous service enhancement complete PowerPoint deck consists of templates like CSI strategy and goals, continual service improvement methods, CSI process, lifecycle of service, the service portfolio, and more. Use CSI PowerPoint templates as a tool to analyse, document and plan for improvements. These ready-made continuous service PowerPoint templates will help you align services with changing needs of business by determining and executing improvements to IT services that support business process. Grab your hands on this professionally designed IT continual service PPT slides to make the improvements to the processes, infrastructure, services and more. Grow in their eyes with our Continuous Service Enhancement Powerpoint Presentation Slides. Do better than they ever expected.
- Google Slides is a new FREE Presentation software from Google.
- All our content is 100% compatible with Google Slides.
- Just download our designs, and upload them to Google Slides and they will work automatically.
- Amaze your audience with SlideTeam and Google Slides.
-
Want Changes to This PPT Slide? Check out our Presentation Design Services
- WideScreen Aspect ratio is becoming a very popular format. When you download this product, the downloaded ZIP will contain this product in both standard and widescreen format.
-

- Some older products that we have may only be in standard format, but they can easily be converted to widescreen.
- To do this, please open the SlideTeam product in Powerpoint, and go to
- Design ( On the top bar) -> Page Setup -> and select "On-screen Show (16:9)” in the drop down for "Slides Sized for".
- The slide or theme will change to widescreen, and all graphics will adjust automatically. You can similarly convert our content to any other desired screen aspect ratio.
Compatible With Google Slides

Get This In WideScreen
You must be logged in to download this presentation.
PowerPoint presentation slides
Presenting continuous service enhancement PowerPoint presentation slide. This deck has a set of 24 slides. This presentation has been crafted with an extensive research done by the research experts. Our PowerPoint designers have designed this PPT by incorporating appropriate diagrams, layouts, templates and icons related to the topic. These slides are completely customizable. Edit the colour, text and icon as per your need. Click the download button below to grab this content-ready PPT deck.
People who downloaded this PowerPoint presentation also viewed the following :
Content of this Powerpoint Presentation
Slide 1: This slide introduces Continuous Service Enhancement. State Your Company Name and get started.
Slide 2: This is an Agenda slide. State your company agendas here.
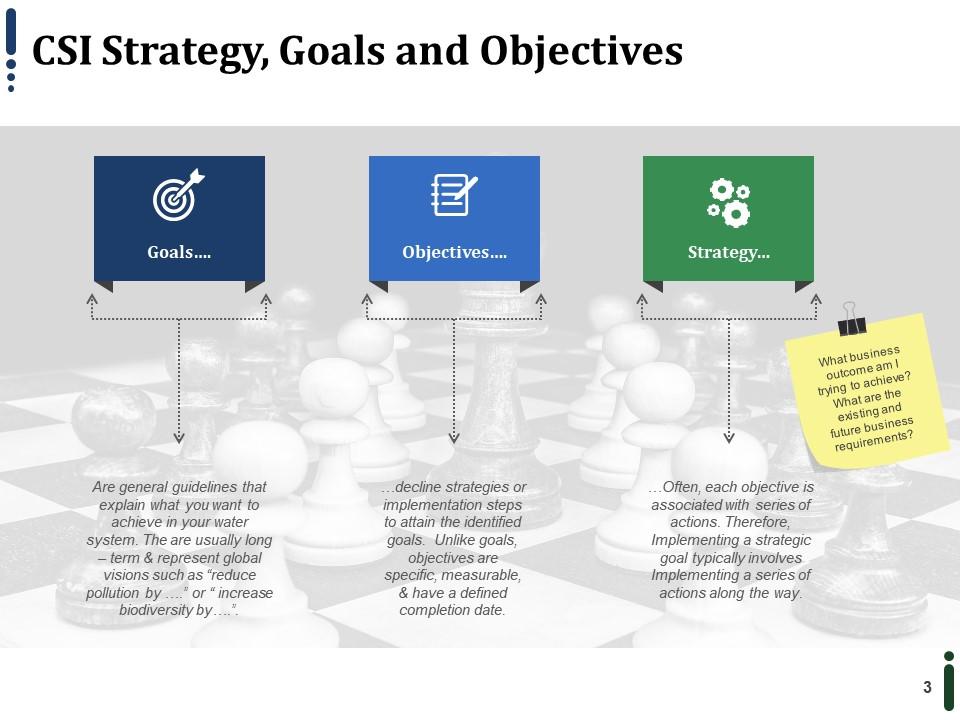
Slide 3: This slide showcases CSI Strategy, Goals and Objectives. Strategy- (Often, each objective is associated with series of actions. Therefore, Implementing a strategic goal typically involves Implementing a series of actions along the way). Objectives- (decline strategies or implementation steps to attain the identified goals. Unlike goals, objectives are specific, measurable, & have a defined completion date). Goals- (Are general guidelines that explain what you want to achieve in your water system. The are usually long – term & represent global visions such as “reduce pollution by ” or “ increase biodiversity by…”What business outcome am I trying to achieve? What are the existing and future business requirements?).
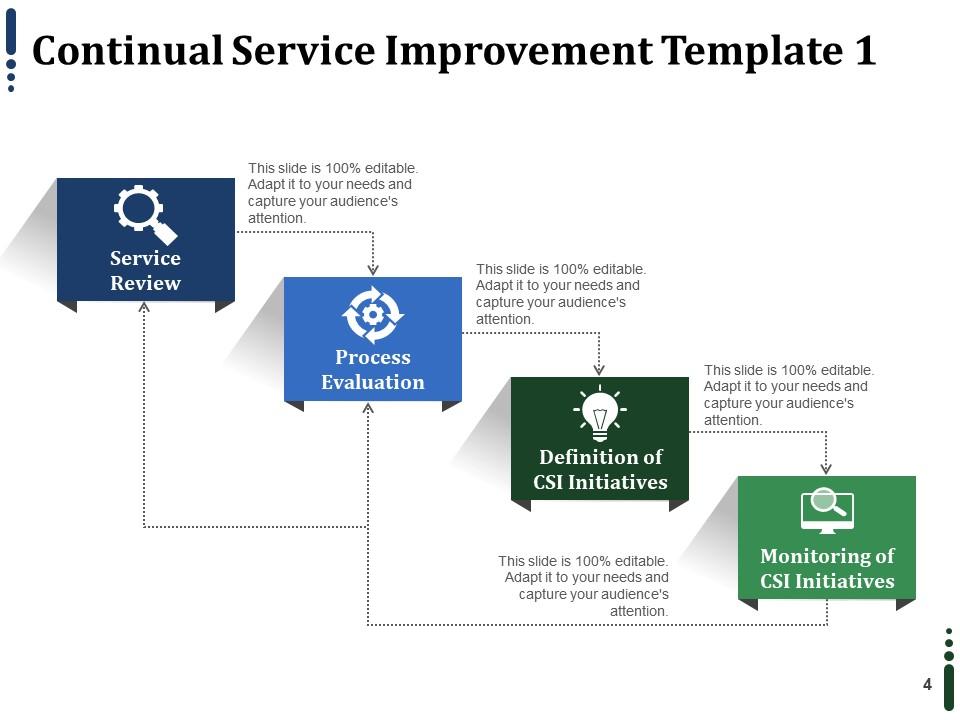
Slide 4: This slide displays Continual Service Improvement Template with the following sub headings- Process Evaluation, Definition of CSI Initiatives, Monitoring of CSI Initiatives, Service Review.
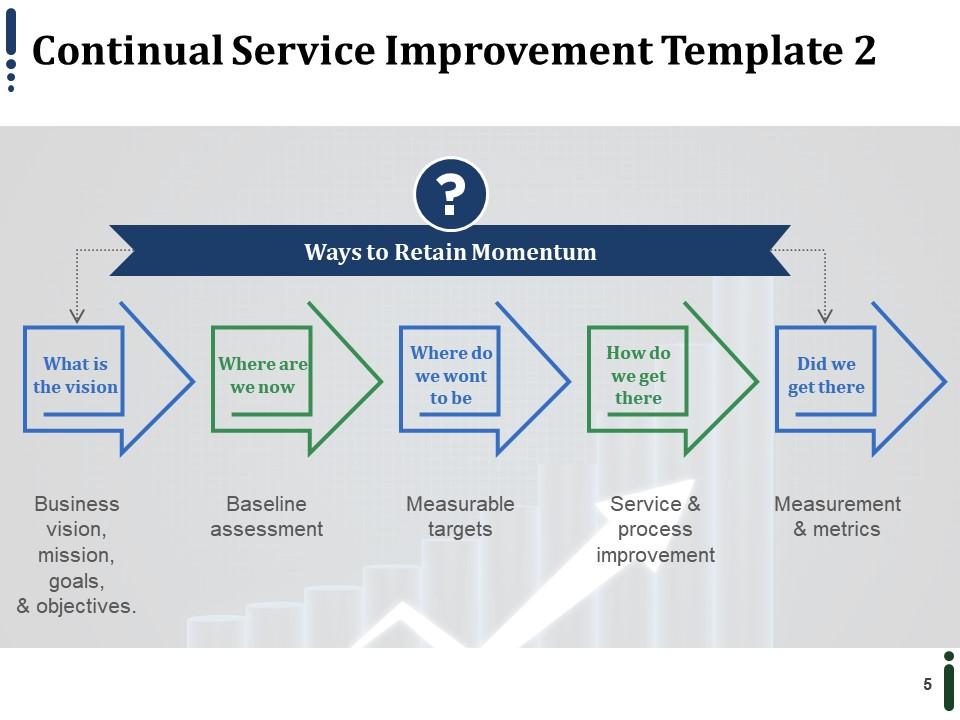
Slide 5: This slide showcases Continual Service Improvement Template with sub heading of Ways to Retain Momentum. The constituents of this sub heading are- What is the vision, (Business vision, mission, goals,& objectives). Where do we want to be, (Measurable targets) Where are we now, (Baseline assessment) How do we get there, (Service & process improvement), Did we get there, (Measurement & metrics).
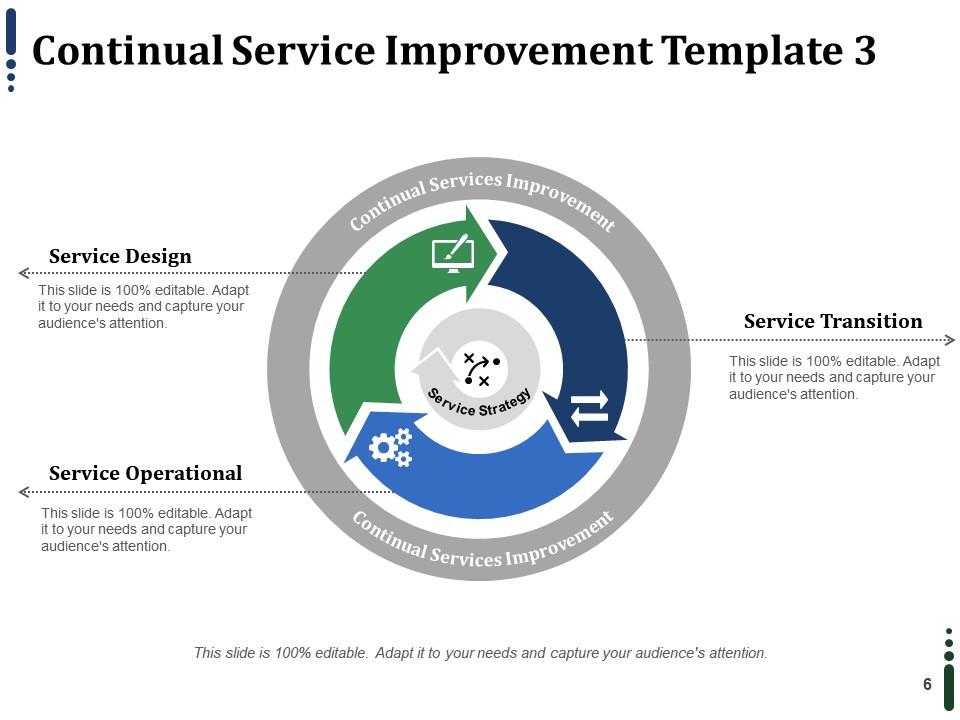
Slide 6: This slide presents Continual Service Improvement Template with the following sub headings with Service strategy in center- Service Transition, Service Design, Service Operational.
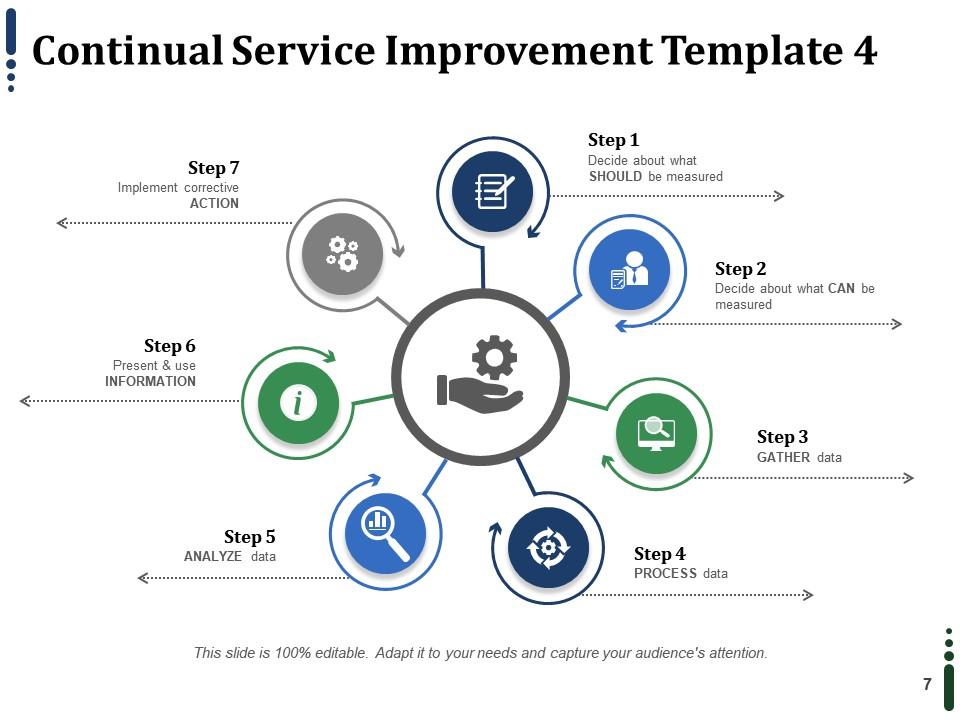
Slide 7: This slide presents Continual Service Improvement Template with steps. The steps shown are: Step 1- Decide about what SHOULD be measured. Step 2- Decide about what CAN be measured. Step 3- GATHER data. Step 4- PROCESS data. Step 5- ANALYZE data. Step 6- Present & use INFORMATION. Step 7- Implement corrective ACTION.
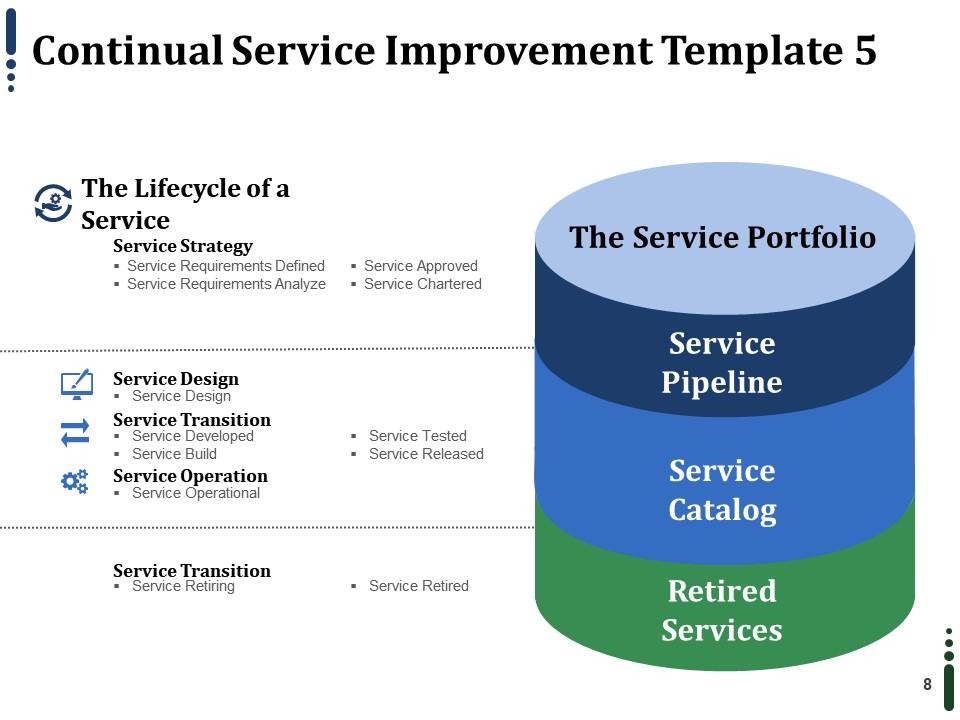
Slide 8: This slide presents Continual Service Improvement Template with The Lifecycle of a Service as the main sub heading. The main points include- Service Strategy: Service Requirements Defined, Service Requirements Analyze, Service Approved, Service Chartered ,Service Transition: Service Developed, Service Build, ,Service Design: Service Design ,Service Operation: Service Operational ,Service Transition: Service Retiring, Service Retired, Service Tested, Service Released. The Service Portfolio includes- Service Pipeline, Service Catalog, Retired Services,
Slide 9: This is a Coffee Break slide to halt.
Slide 10: This slide is titled Additional Slides to proceed.
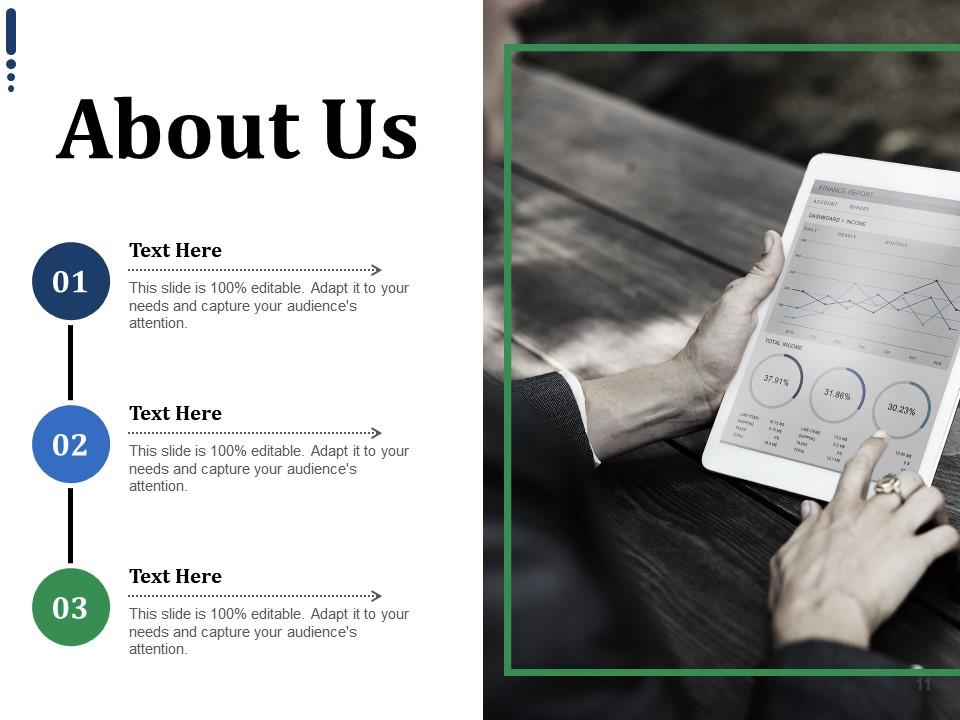
Slide 11: This is an About Us slide. State highlights, specifications etc. here.
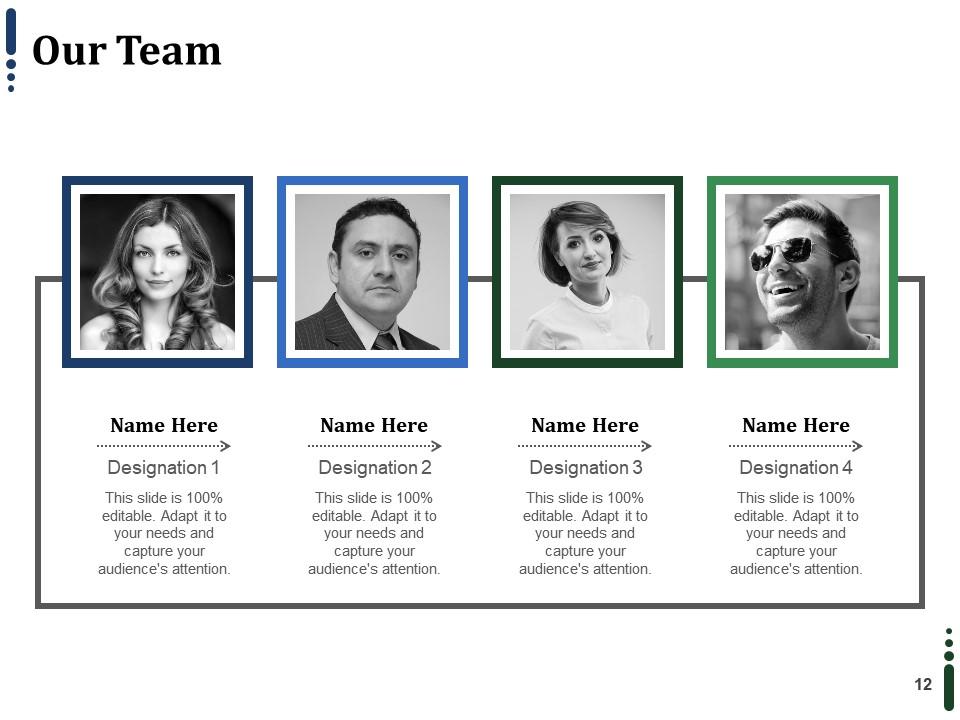
Slide 12: This slide presents Our Team with name, image box and designation.
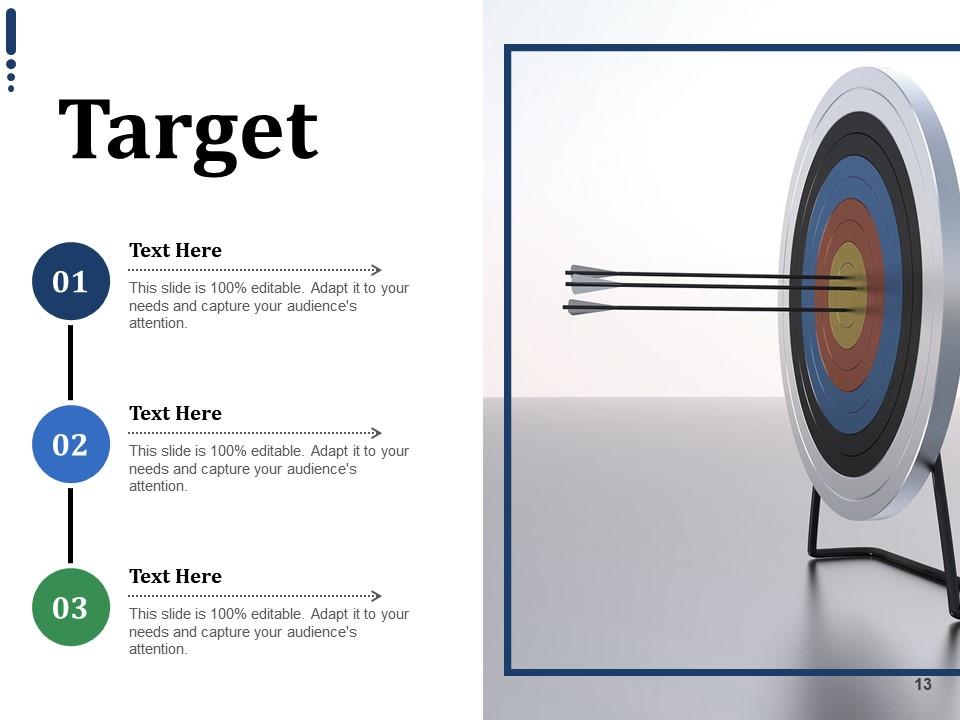
Slide 13: This is a Target slide with image and text boxes to go with.
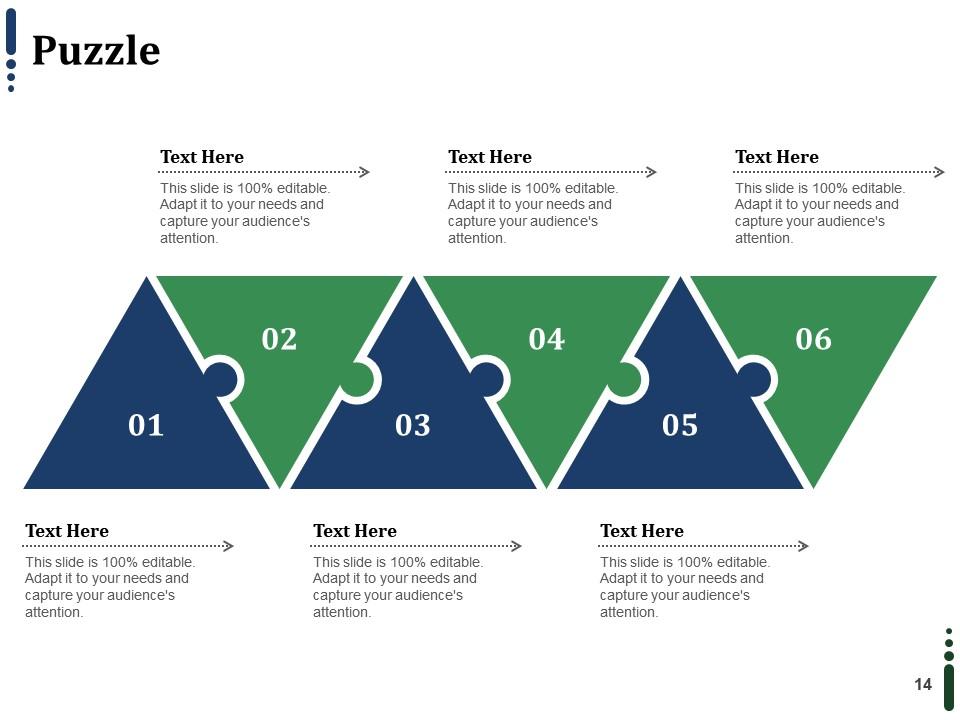
Slide 14: This is a Puzzle slide to show information, specifications etc.
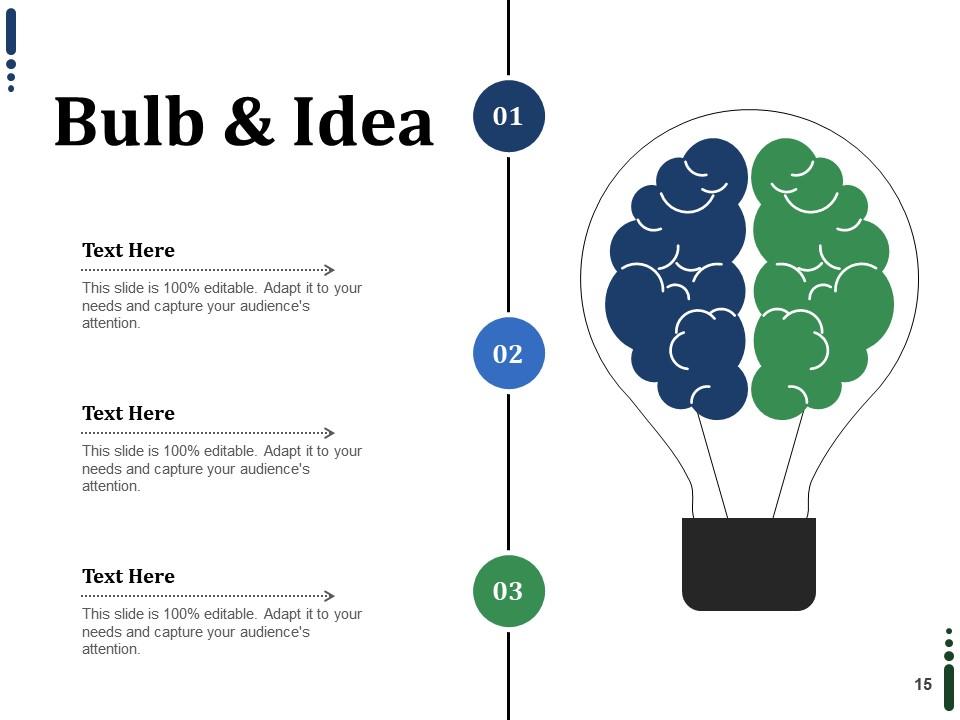
Slide 15: This is a Bulb & Idea slide to show information, specifications etc.
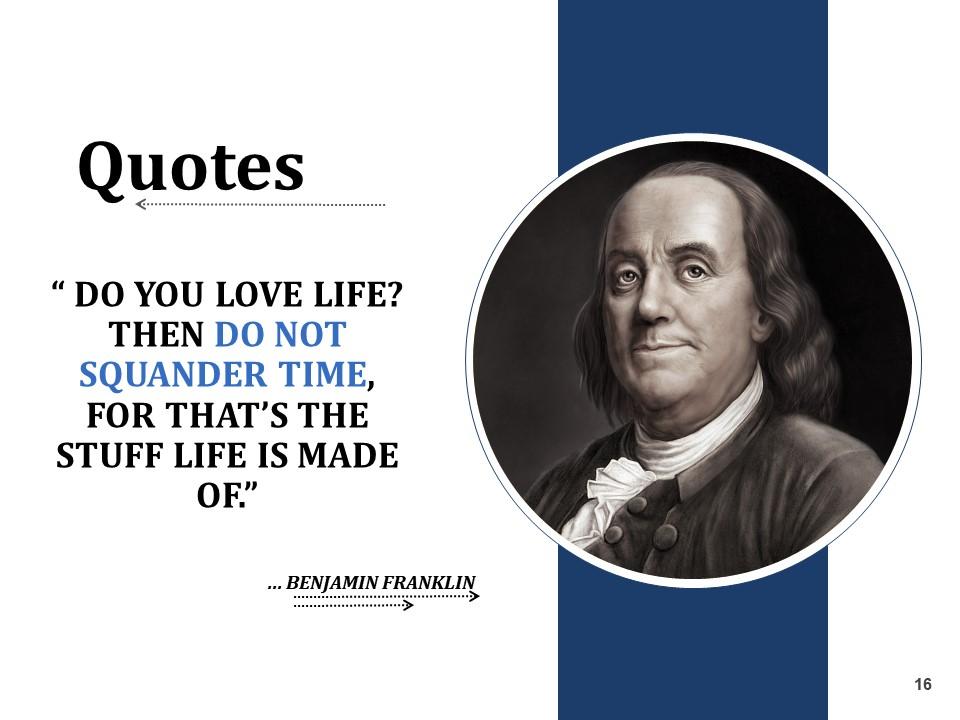
Slide 16: This is a Quotes slide. The following quote has been showed as an example- “ DO YOU LOVE LIFE? THEN DO NOT SQUANDER TIME, FOR THAT’S THE STUFF LIFE IS MADE OF.” ... BENJAMIN FRANKLIN. State a quote, highlights etc here.
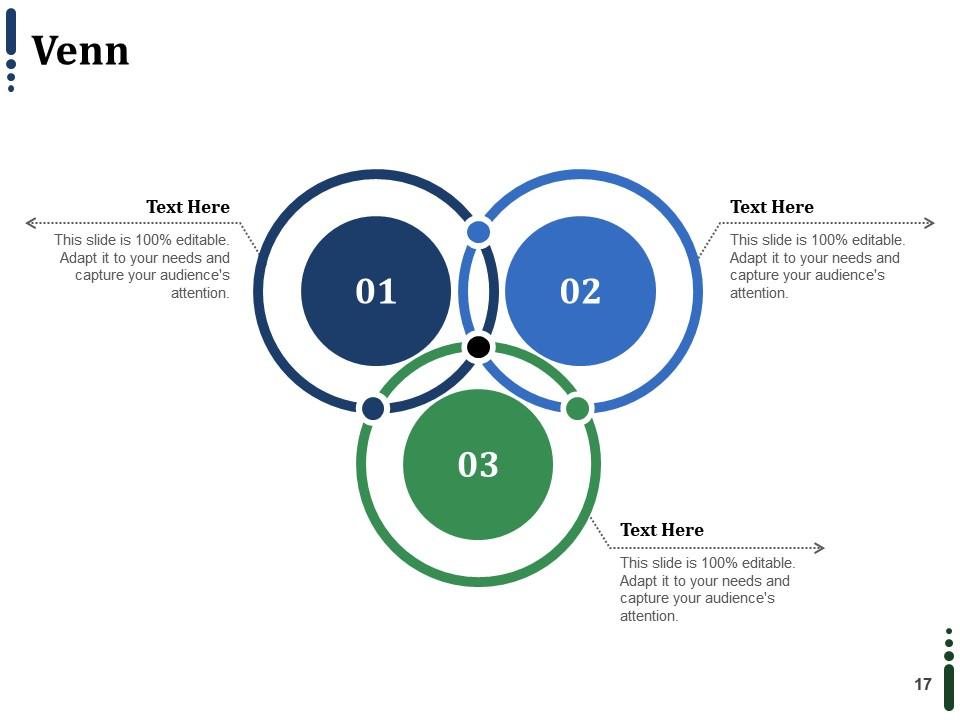
Slide 17: This is a Venn diagram slide to show information.
Slide 18: This slide is titled Charts & Graphs to proceed forward.
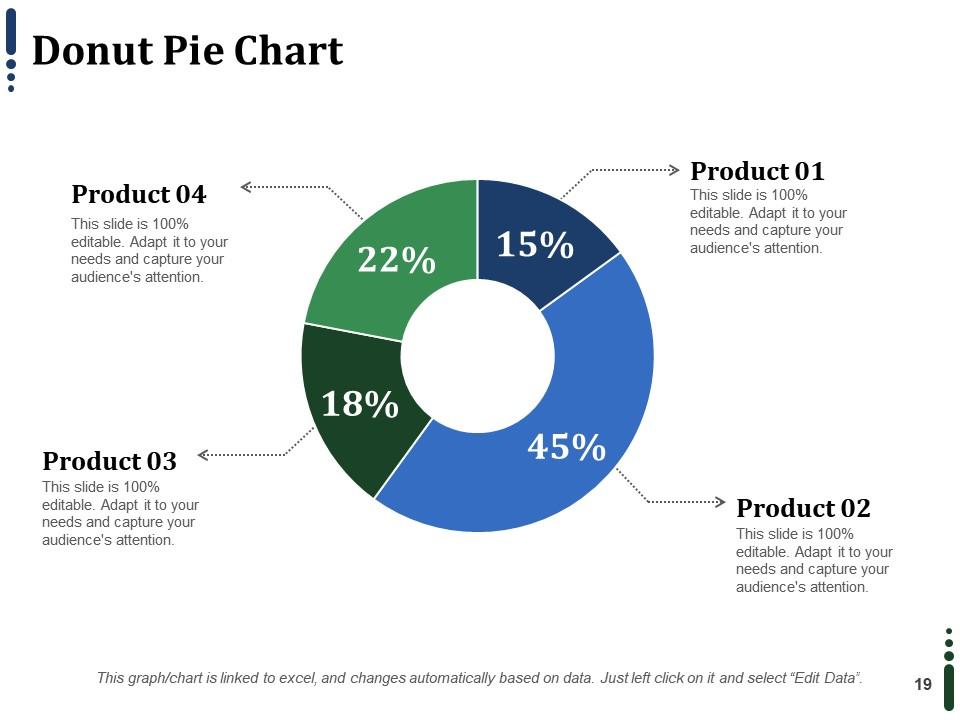
Slide 19: This slide shows a Donut Pie Chart for product comparison etc.
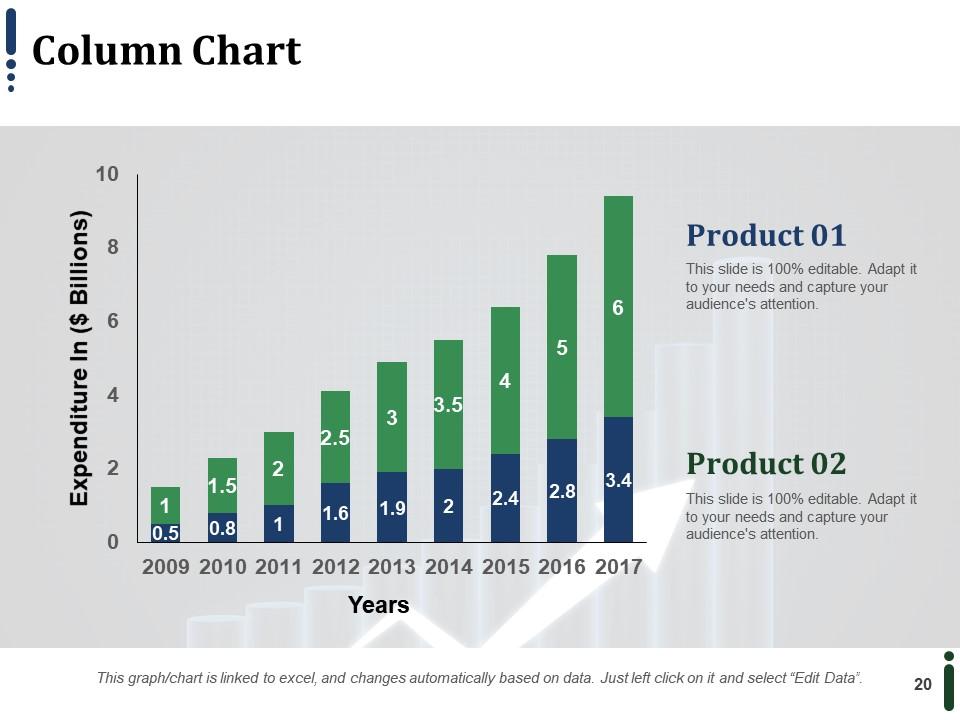
Slide 20: This is a Column Chart slide to show growth, share etc. in terms of years.
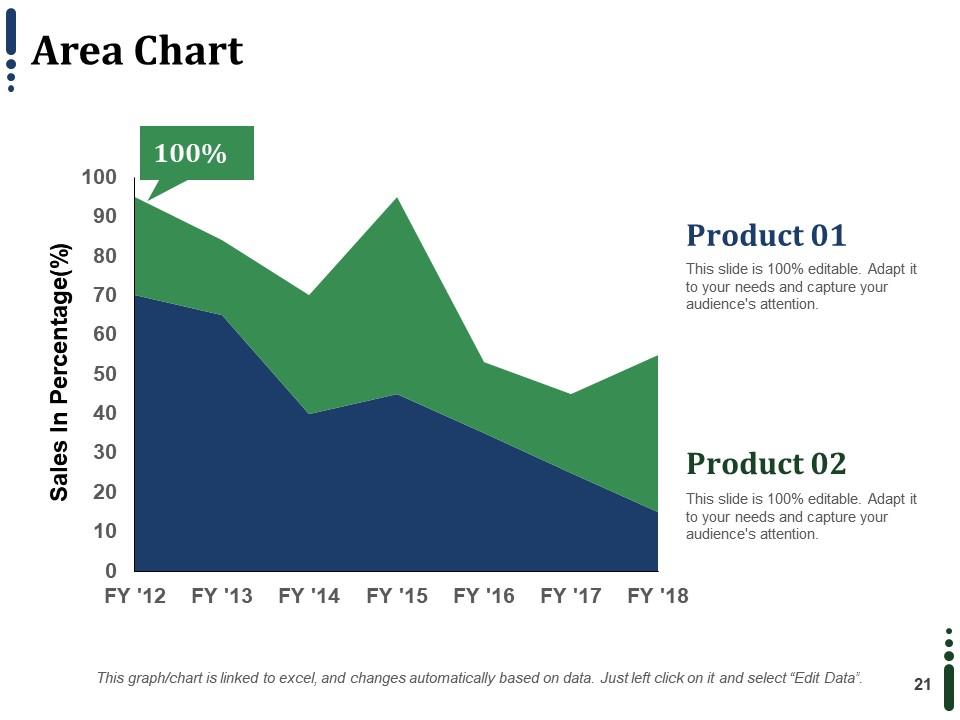
Slide 21: This is an Area Chart slide to show sales etc. of two products.
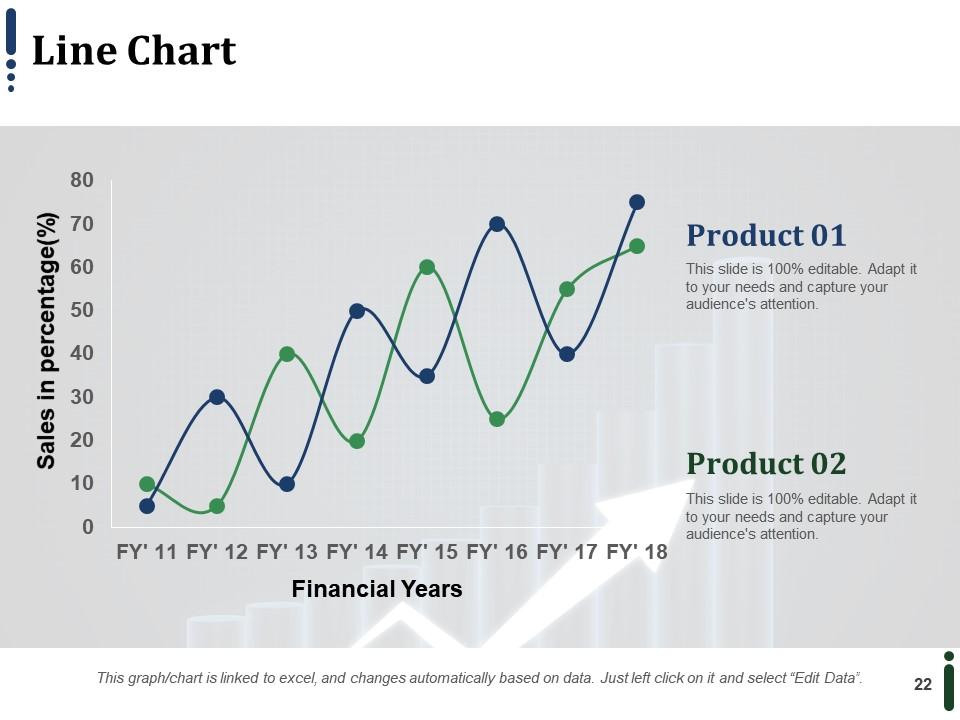
Slide 22: This slide presents a Line Chart for two product comparison.
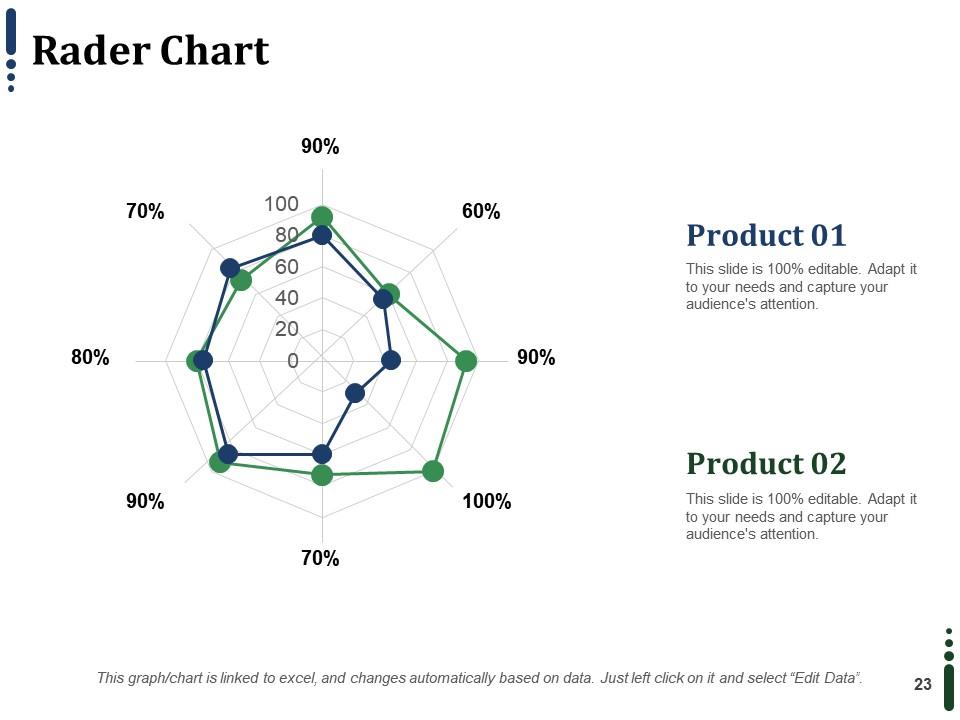
Slide 23: This is a Radar Chart to show products in comparison.
Slide 24: This is a Thank You slide with Address# Street number, city, state, Email Address, Contact Numbers.
Continuous Service Enhancement Powerpoint Presentation Slides with all 24 slides:
Caution folks about insanitary conditions with our Continuous Service Enhancement Powerpoint Presentation Slides. Initiate action to establish a healthy environment.
-
Perfect template with attractive color combination.
-
Unique and attractive product design.


