Global energy outlook challenges and recommendations case competition complete deck
Our Global Energy Outlook Challenges And Recommendations Case Competition Complete Deck are topically designed to provide an attractive backdrop to any subject. Use them to look like a presentation pro.
Our Global Energy Outlook Challenges And Recommendations Case Competition Complete Deck are topically designed to provide a..
- Google Slides is a new FREE Presentation software from Google.
- All our content is 100% compatible with Google Slides.
- Just download our designs, and upload them to Google Slides and they will work automatically.
- Amaze your audience with SlideTeam and Google Slides.
-
Want Changes to This PPT Slide? Check out our Presentation Design Services
- WideScreen Aspect ratio is becoming a very popular format. When you download this product, the downloaded ZIP will contain this product in both standard and widescreen format.
-

- Some older products that we have may only be in standard format, but they can easily be converted to widescreen.
- To do this, please open the SlideTeam product in Powerpoint, and go to
- Design ( On the top bar) -> Page Setup -> and select "On-screen Show (16:9)” in the drop down for "Slides Sized for".
- The slide or theme will change to widescreen, and all graphics will adjust automatically. You can similarly convert our content to any other desired screen aspect ratio.
Compatible With Google Slides

Get This In WideScreen
You must be logged in to download this presentation.
PowerPoint presentation slides
Deliver this complete deck to your team members and other collaborators. Encompassed with stylized slides presenting various concepts, this Global Energy Outlook Challenges And Recommendations Case Competition Complete Deck is the best tool you can utilize. Personalize its content and graphics to make it unique and thought provoking. All the thirty eight slides are editable and modifiable, so feel free to adjust them to your business setting. The font, color, and other components also come in an editable format making this PPT design the best choice for your next presentation. So, download now.
People who downloaded this PowerPoint presentation also viewed the following :
Content of this Powerpoint Presentation
Slide 1: This slide displays title i.e. 'Global Energy Outlook – Challenges and Recommendations (Case Competition)' and your Company Name.
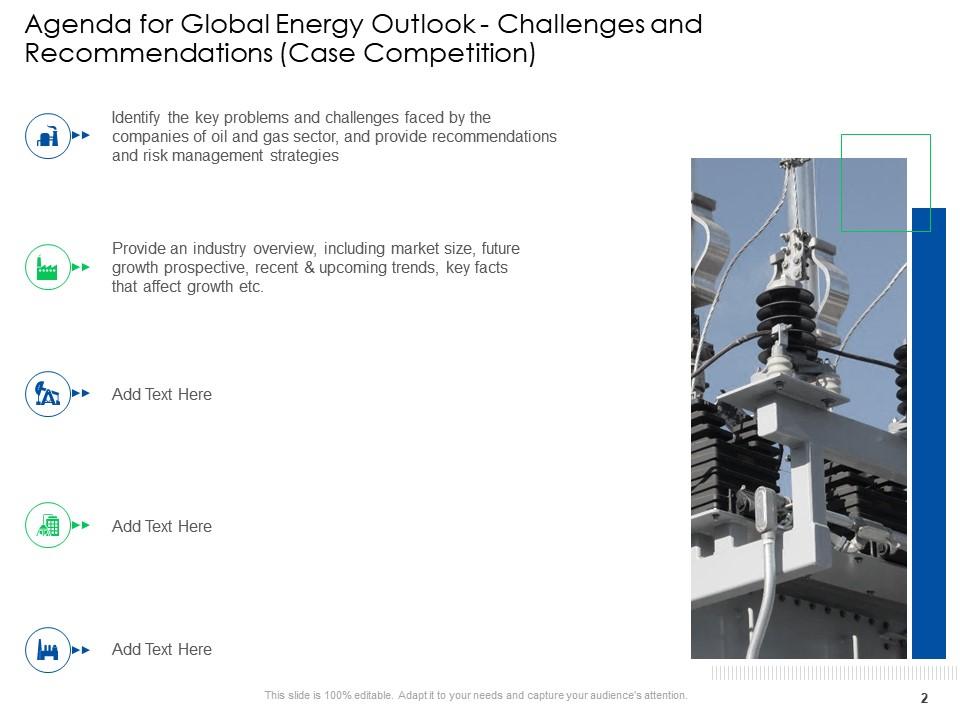
Slide 2: This slide presents agenda.
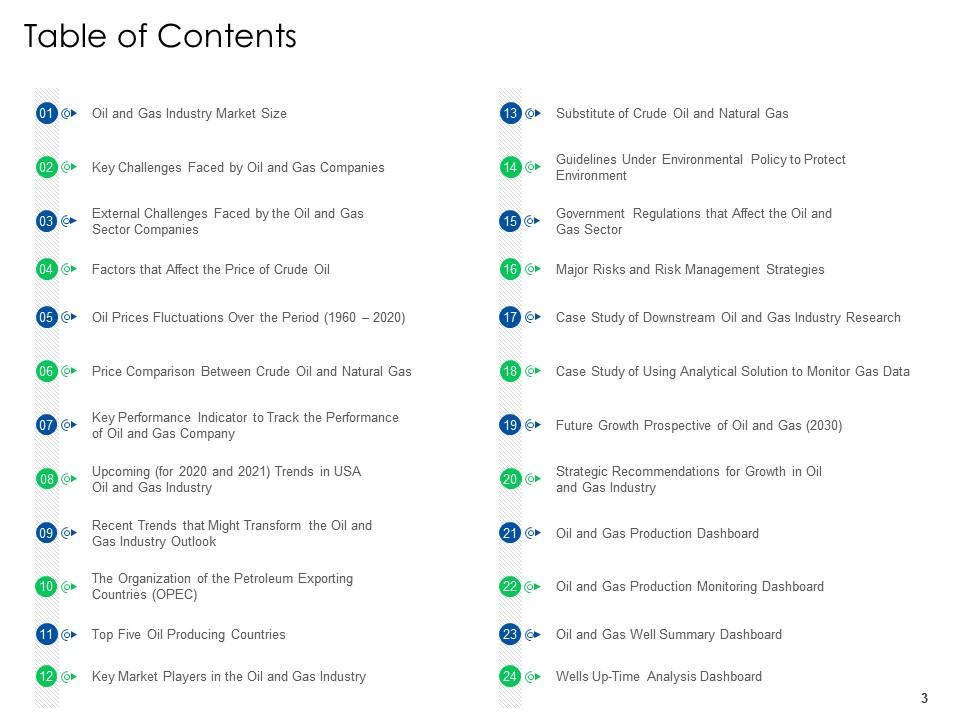
Slide 3: This slide exhibits table of contents.
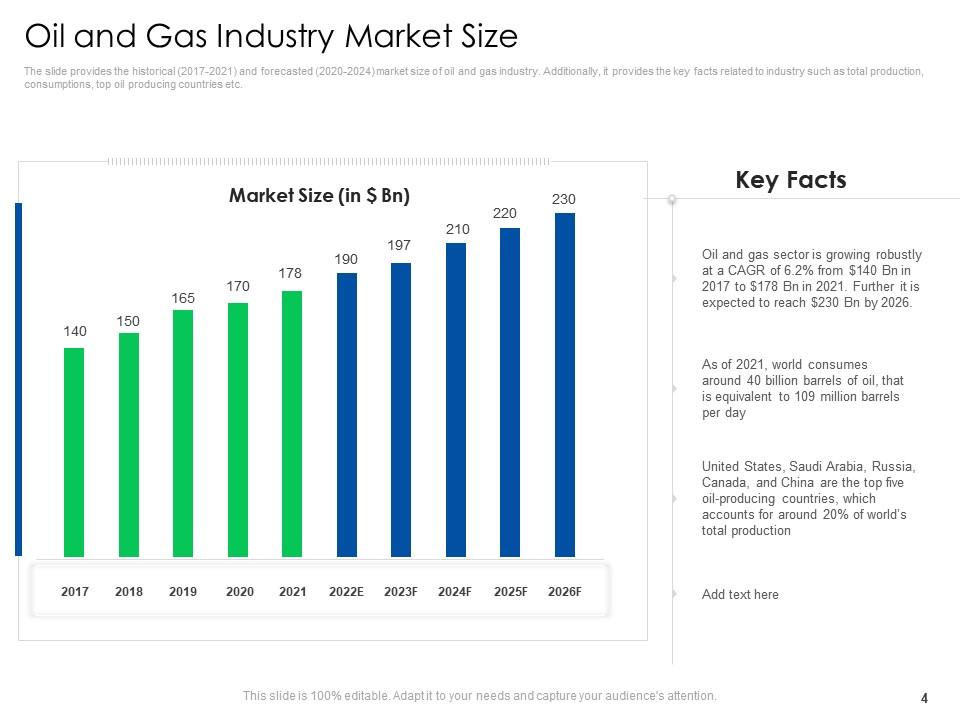
Slide 4: The slide provides the historical (2017-2021) and forecasted (2020-2024) market size of oil and gas industry.
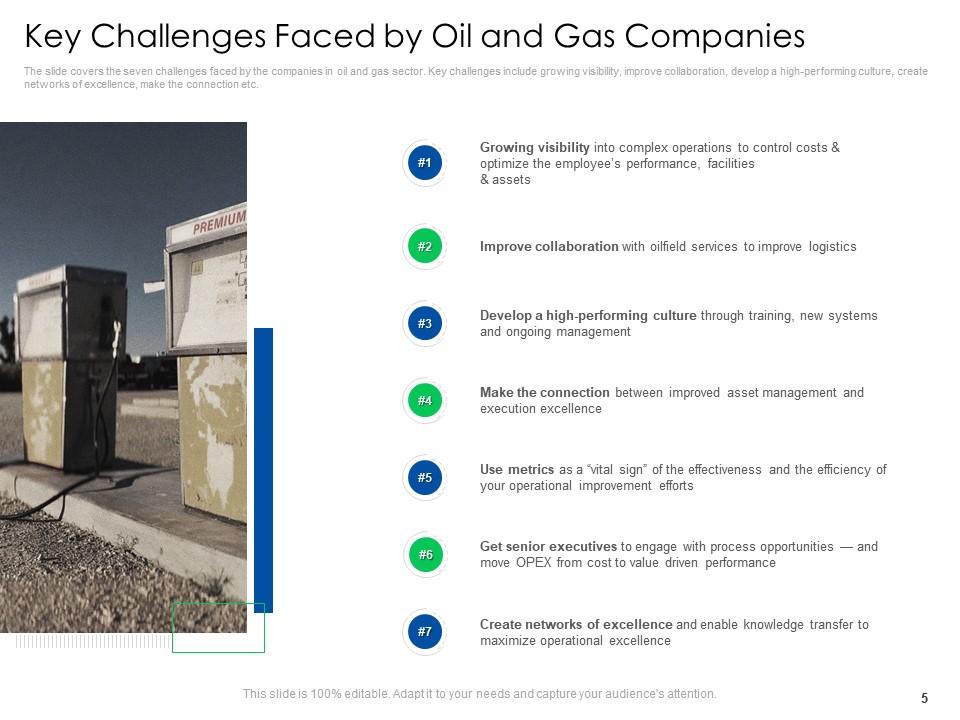
Slide 5: The slide covers the seven challenges faced by the companies in oil and gas sector.
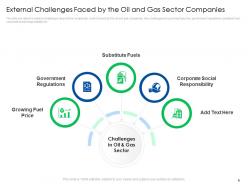
Slide 6: The slide provides the external challenges (beyond the companies’ control) faced by the oil and gas companies.
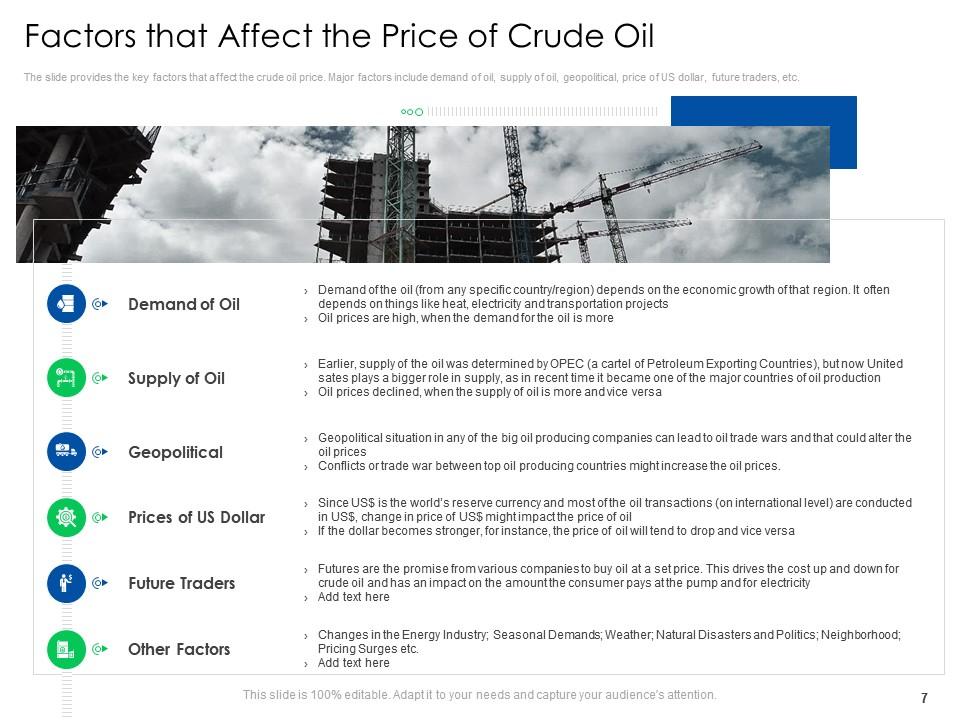
Slide 7: The slide provides the key factors that affect the crude oil price.
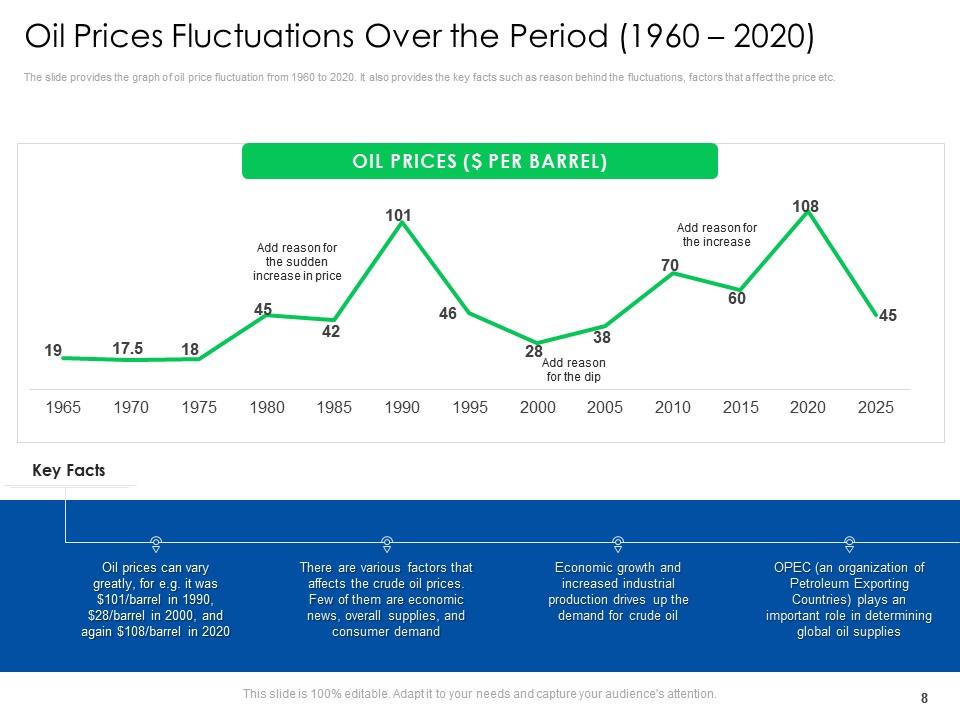
Slide 8: The slide provides the graph of oil price fluctuation from 1960 to 2020.
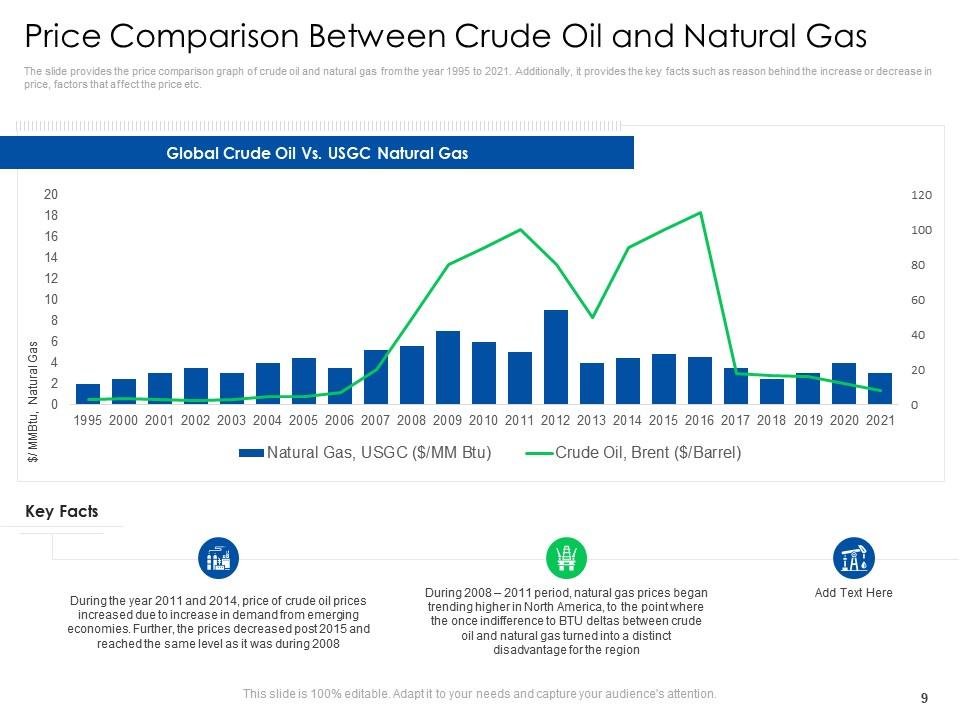
Slide 9: The slide provides the price comparison graph of crude oil and natural gas from the year 1995 to 2021.
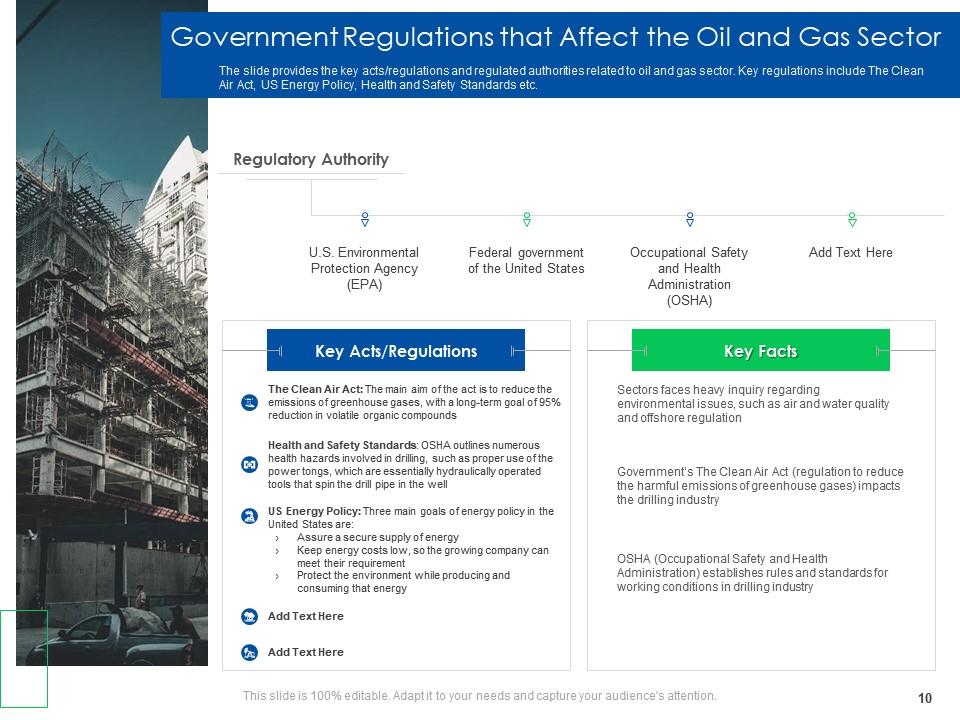
Slide 10: The slide provides the key acts/regulations and regulated authorities related to oil and gas sector.
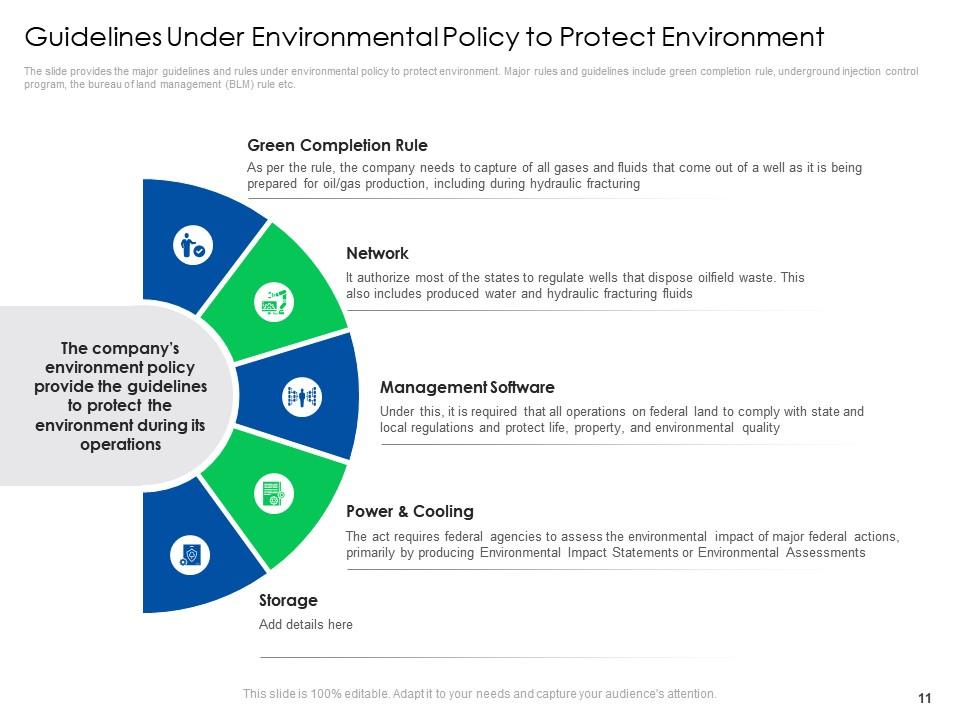
Slide 11: The slide provides the major guidelines and rules under environmental policy to protect environment.
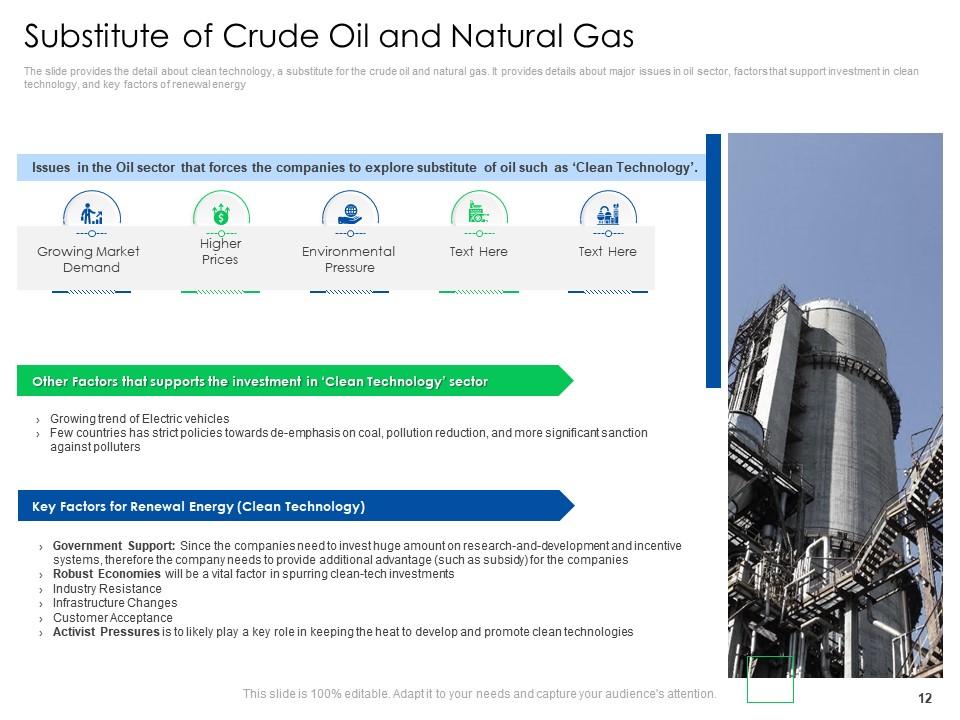
Slide 12: The slide provides the detail about clean technology, a substitute for the crude oil and natural gas.
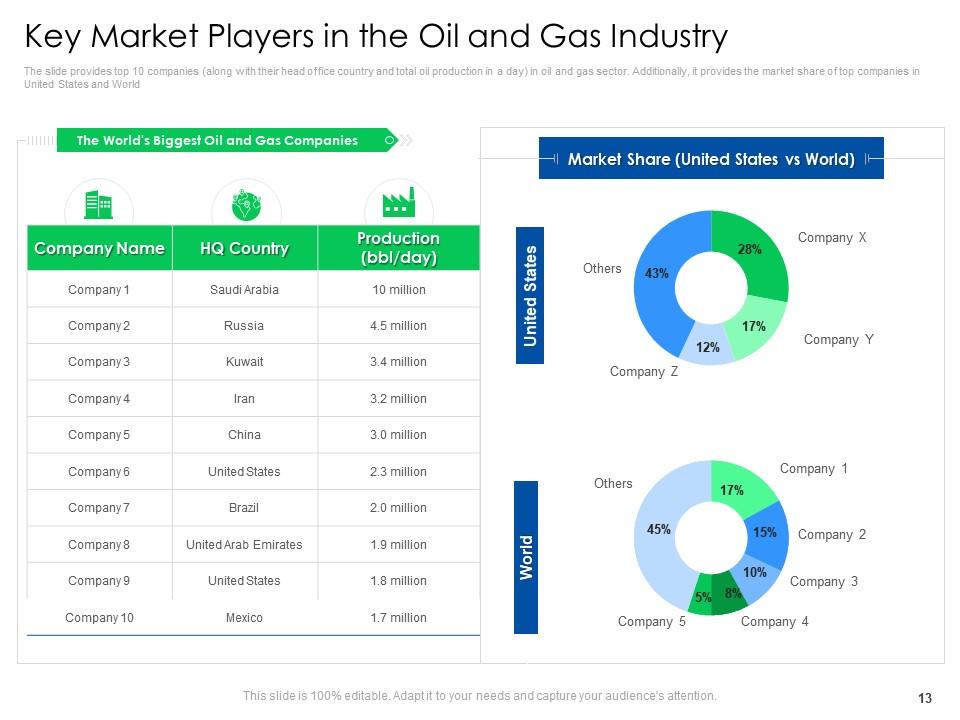
Slide 13: The slide provides top 10 companies (along with their head office country and total oil production in a day) in oil and gas sector.
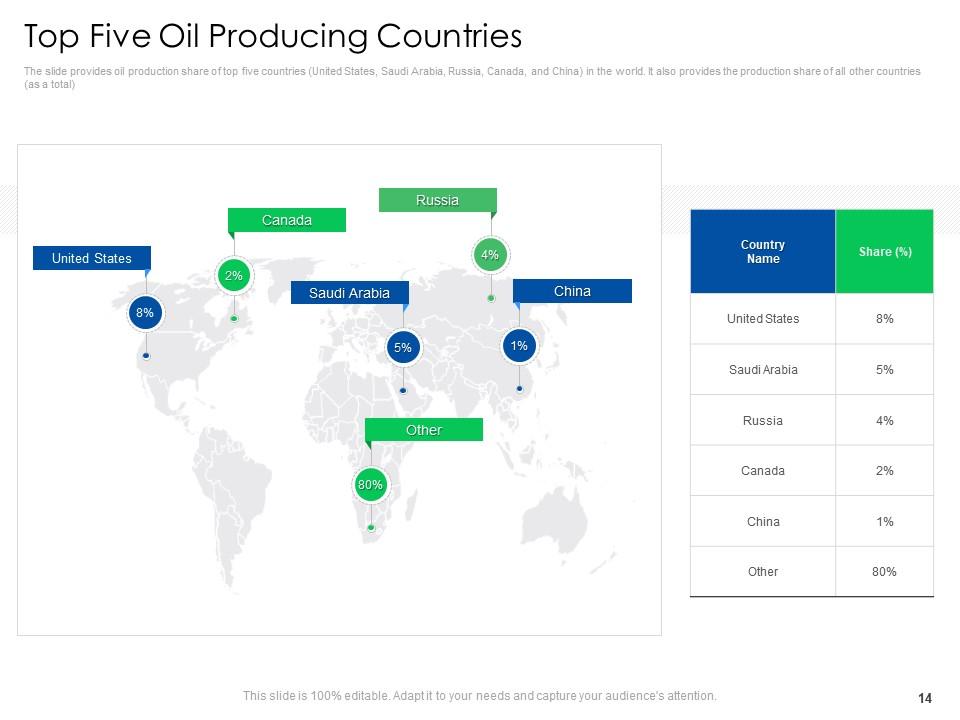
Slide 14: The slide provides oil production share of top five countries (United States, Saudi Arabia, Russia, Canada, and China) in the world.
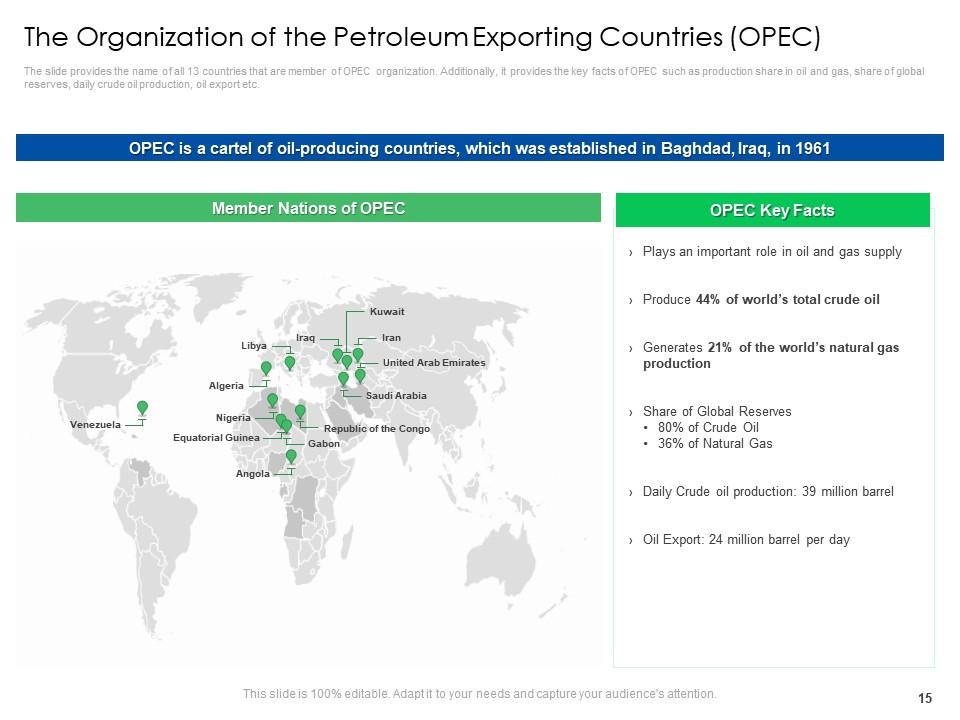
Slide 15: The slide provides the name of all 13 countries that are member of OPEC organization.
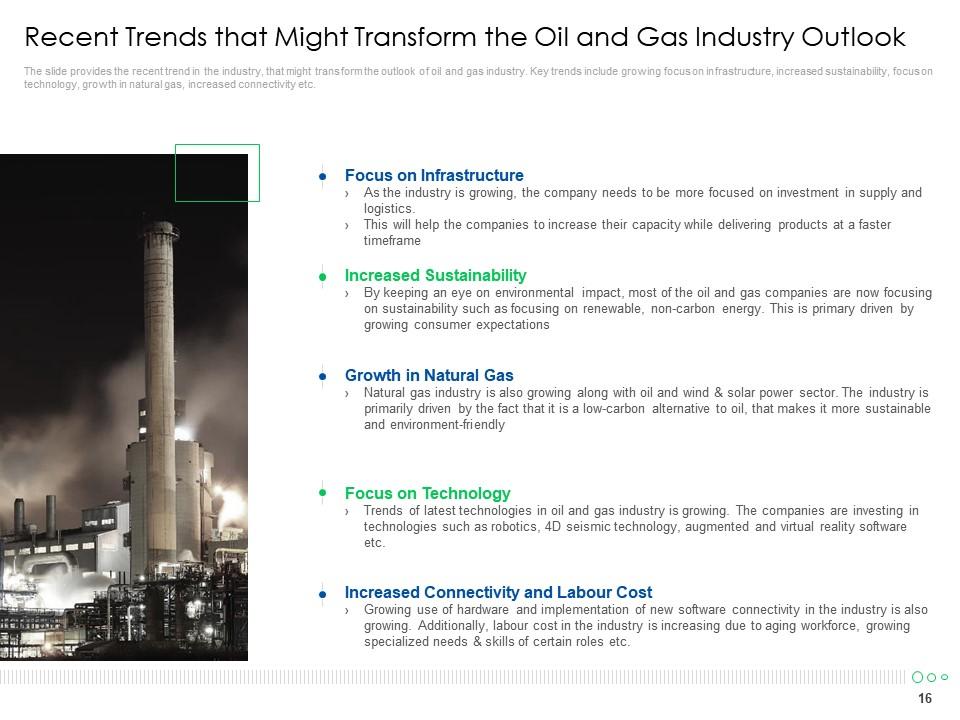
Slide 16: The slide provides the recent trend in the industry, that might transform the outlook of oil and gas industry.
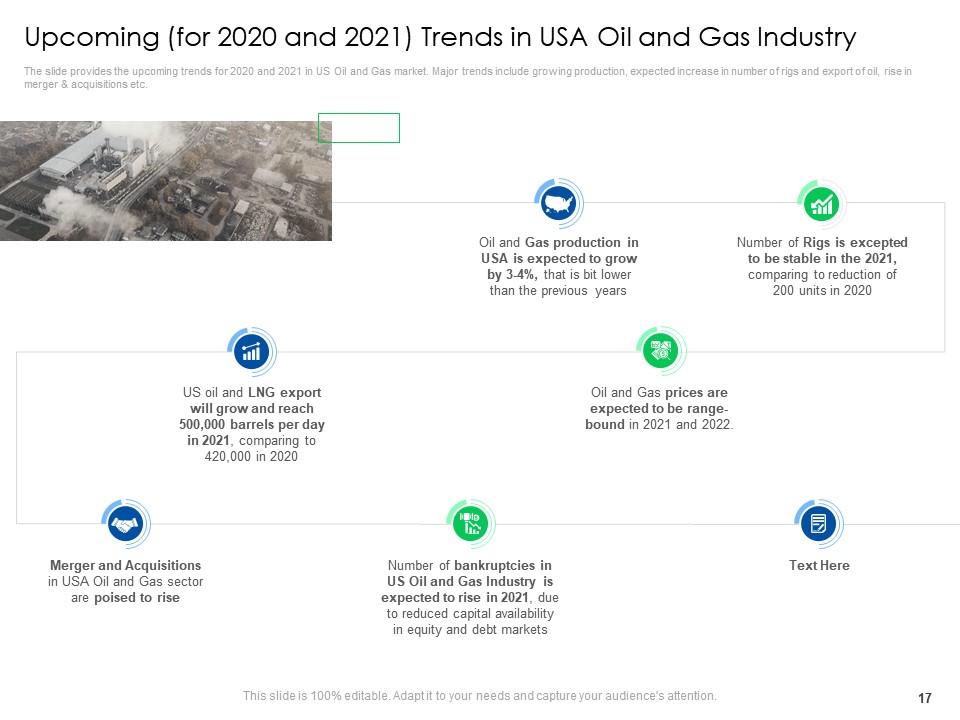
Slide 17: The slide provides the upcoming trends for 2020 and 2021 in US Oil and Gas market.
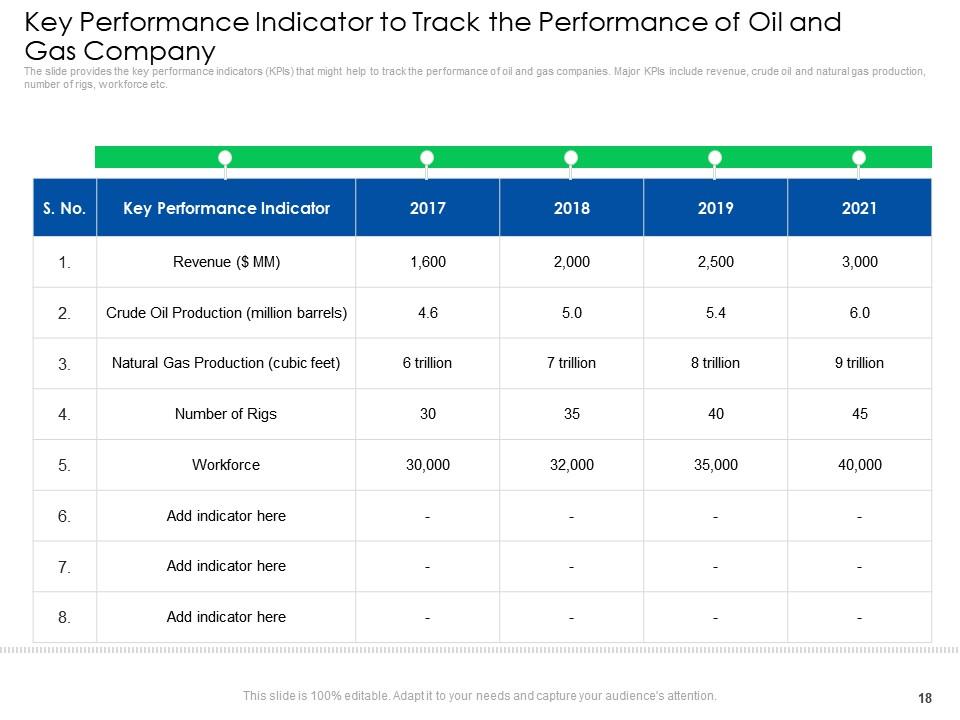
Slide 18: The slide provides the key performance indicators (KPIs) that might help to track the performance of oil and gas companies.
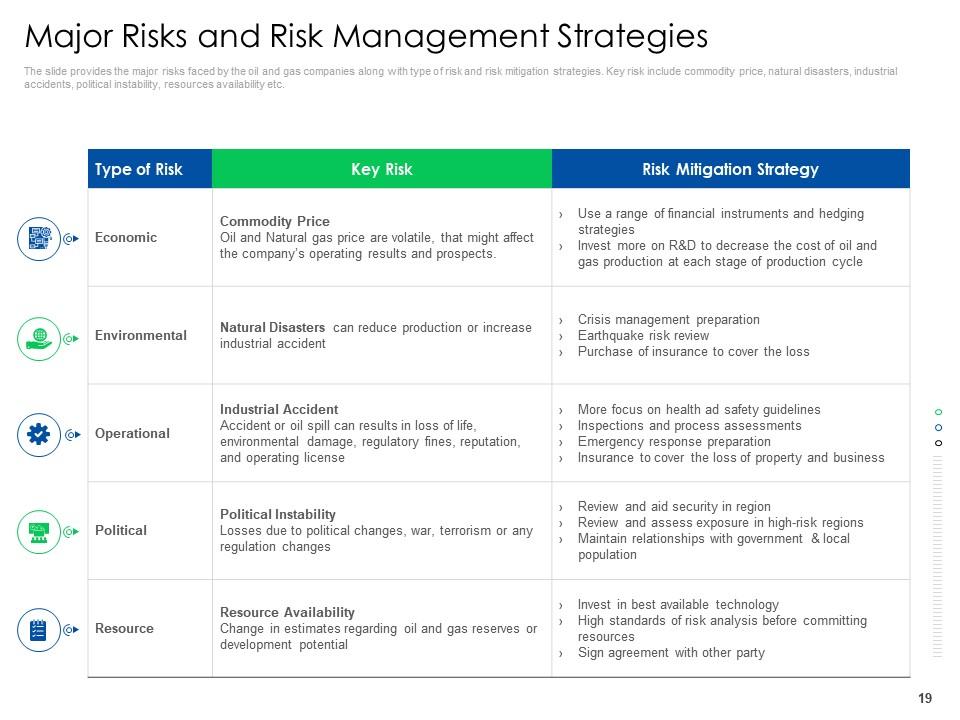
Slide 19: The slide provides the major risks faced by the oil and gas companies along with type of risk and risk mitigation strategies.
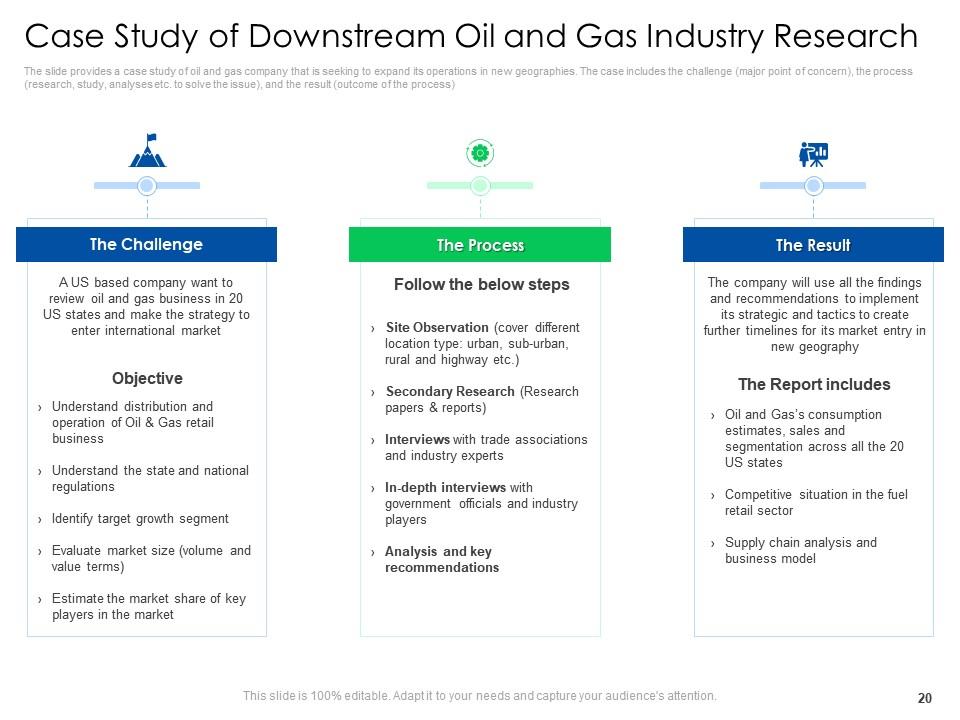
Slide 20: The slide provides a case study of oil and gas company that is seeking to expand its operations in new geographies.
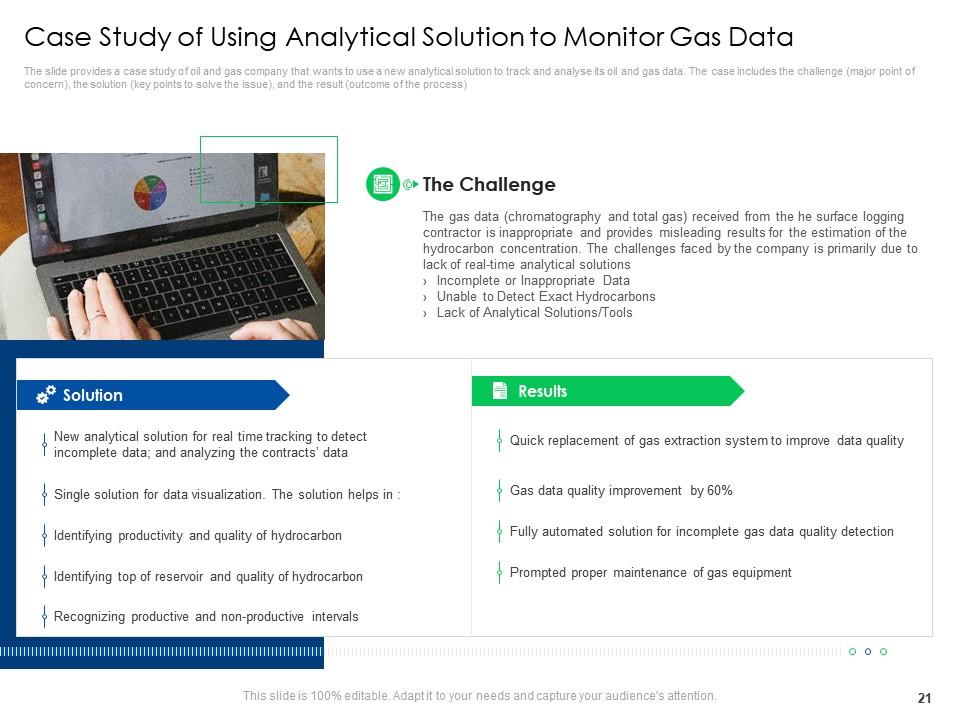
Slide 21: The slide provides a case study of oil and gas company that wants to use a new analytical solution to track and analyse its oil and gas data.
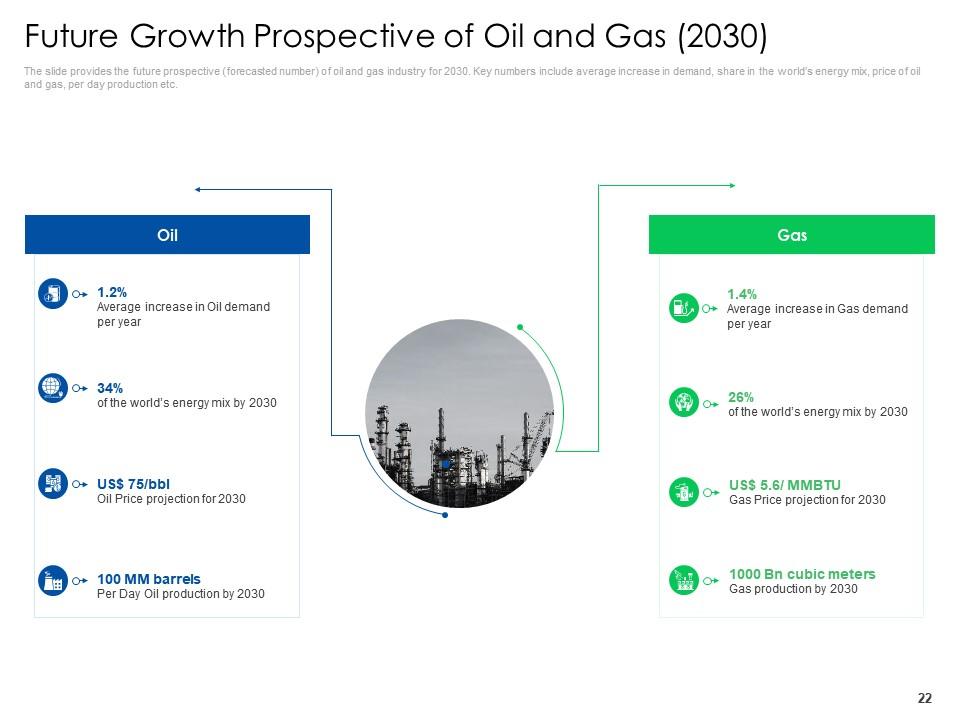
Slide 22: The slide provides the future prospective (forecasted number) of oil and gas industry for 2030.
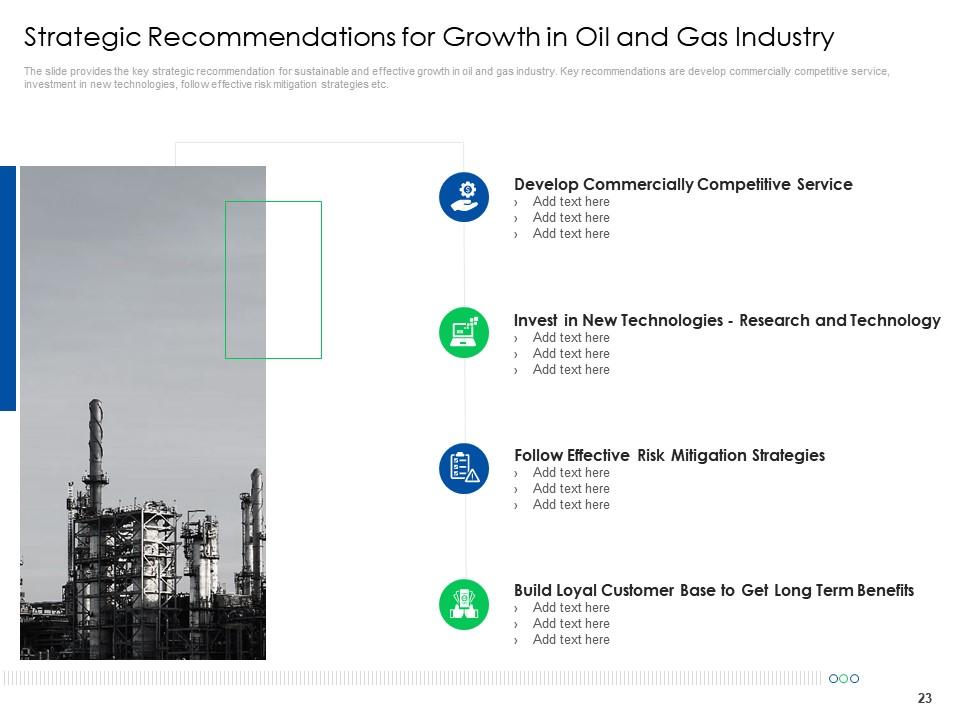
Slide 23: The slide provides the key strategic recommendation for sustainable and effective growth in oil and gas industry.
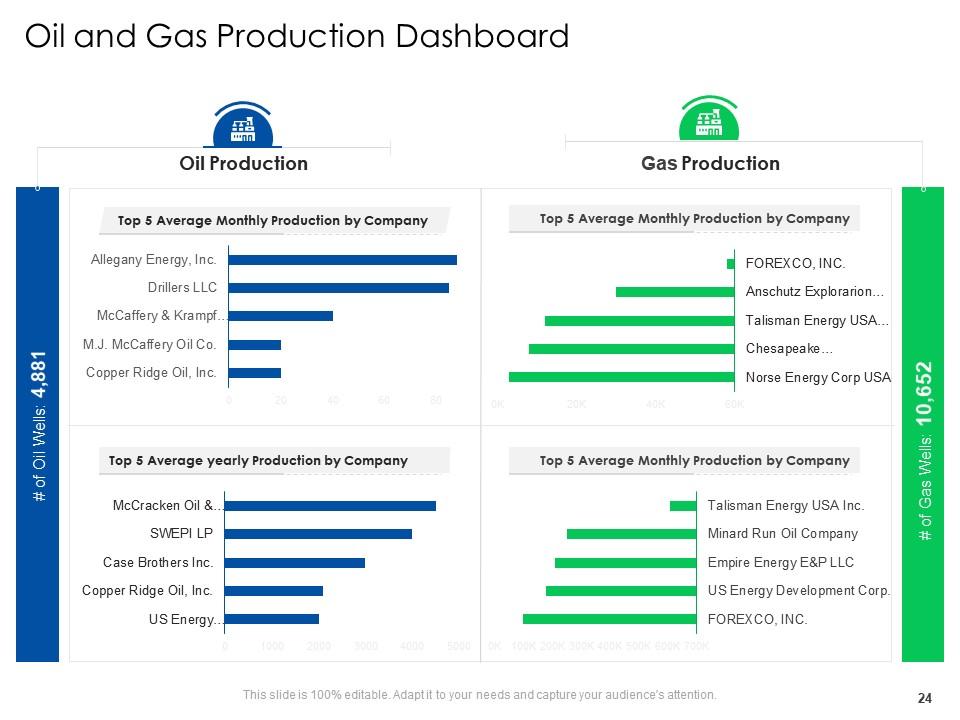
Slide 24: This slide presents 'Oil and Gas Production Dashboard'.
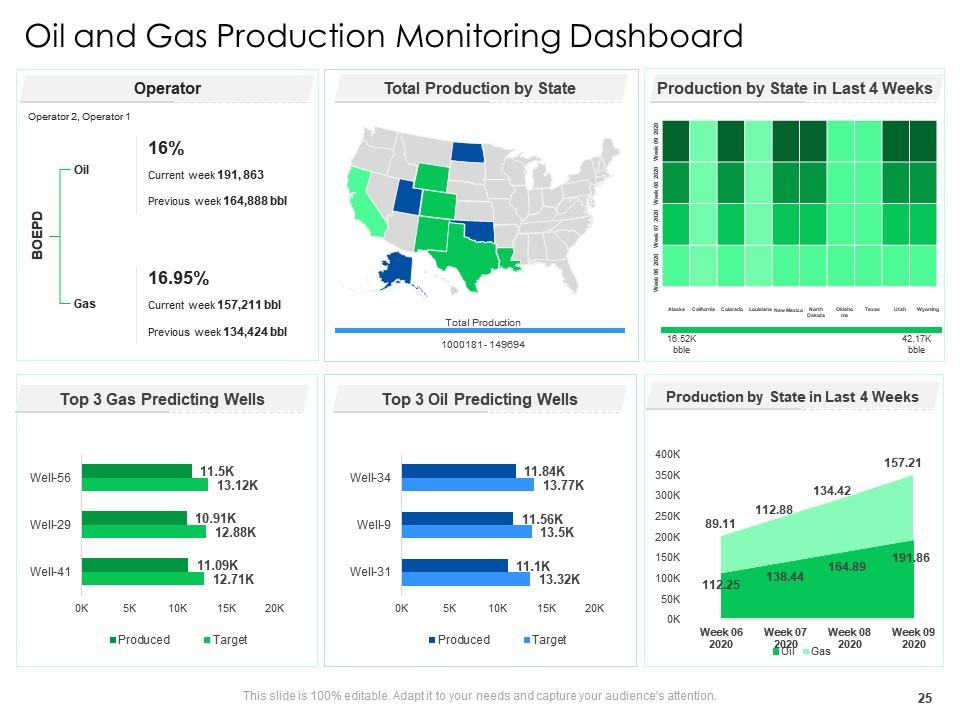
Slide 25: This slide exhibits 'Oil and Gas Production Monitoring Dashboard'.
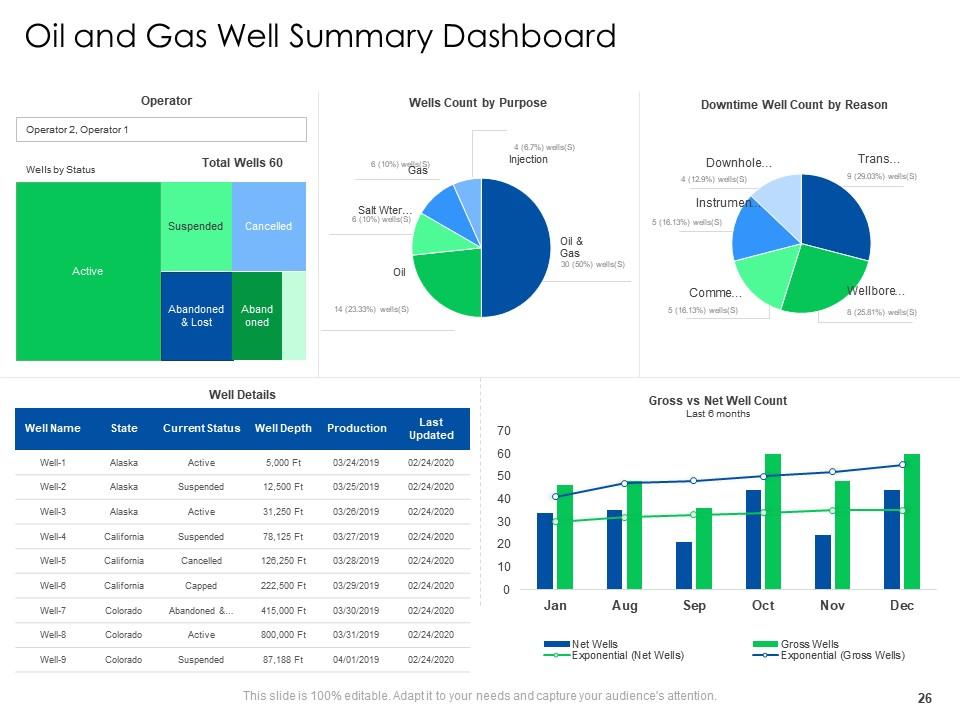
Slide 26: This slide depicts 'Oil and Gas Well Summary Dashboard'.
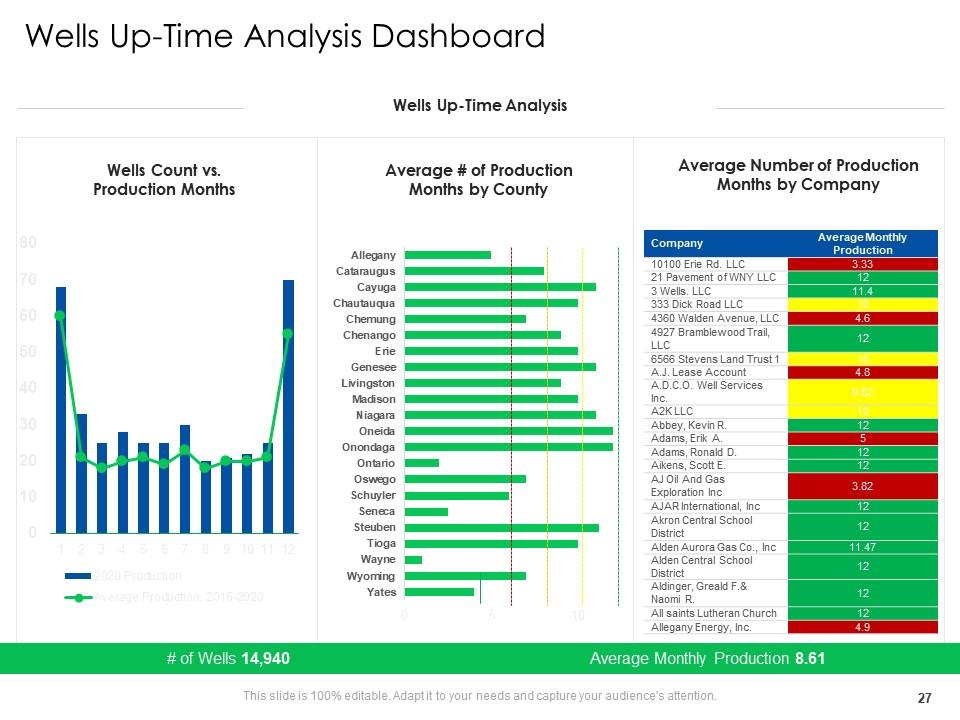
Slide 27: This slide shows 'Wells Up-Time Analysis Dashboard'.
Slide 28: This is the icons slide.
Slide 29: This slide presents title for additional slides.
Slide 30: This slide presents your company's vision, mission and goals.
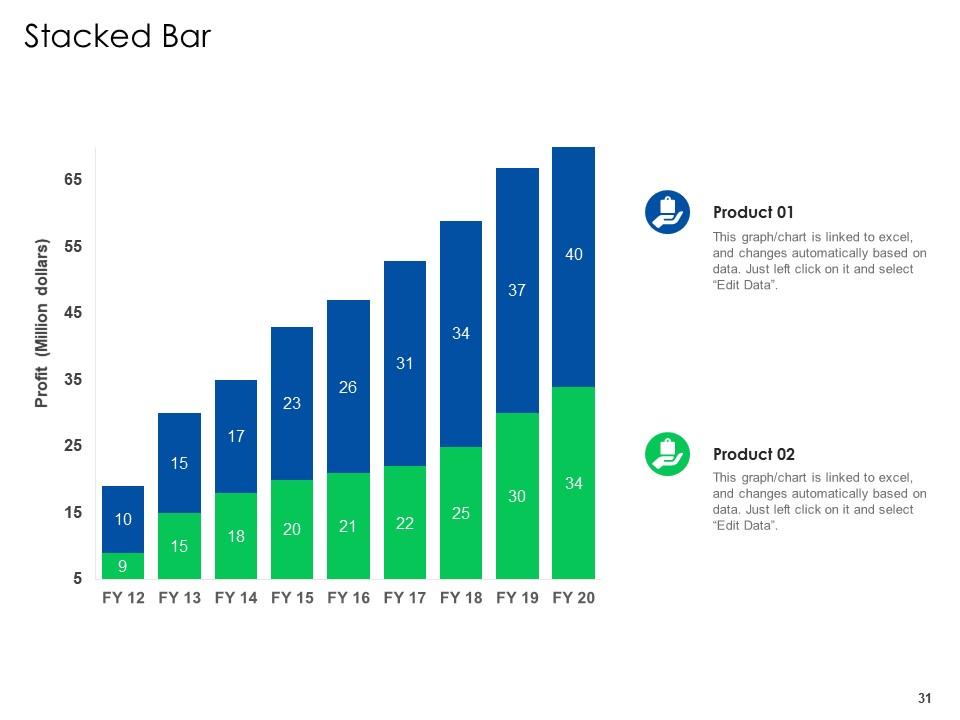
Slide 31: This slide exhibits yearly profits stacked bar charts for different products. The charts are linked to Excel.
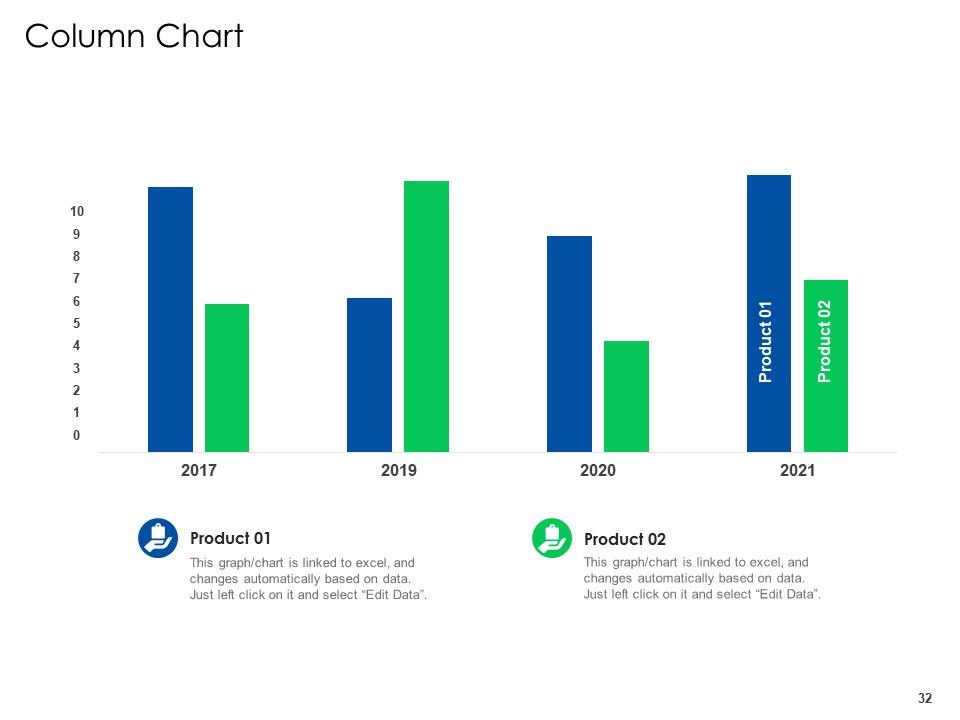
Slide 32: This slide displays yearly column charts for different products. The charts are linked to Excel.
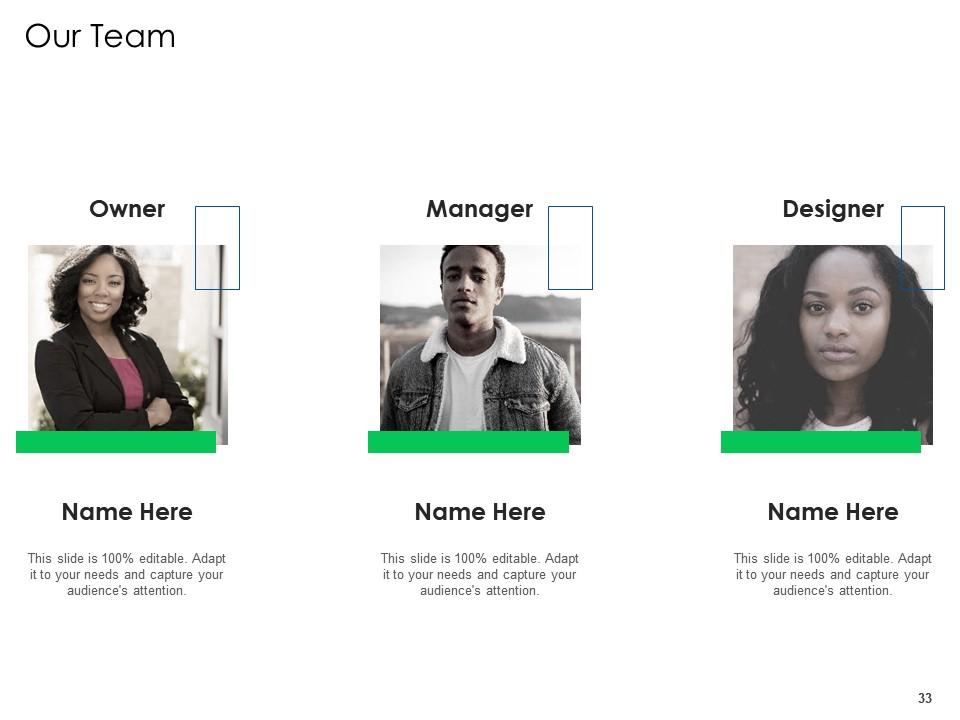
Slide 33: This slide shows details of team members like name, designation, etc.
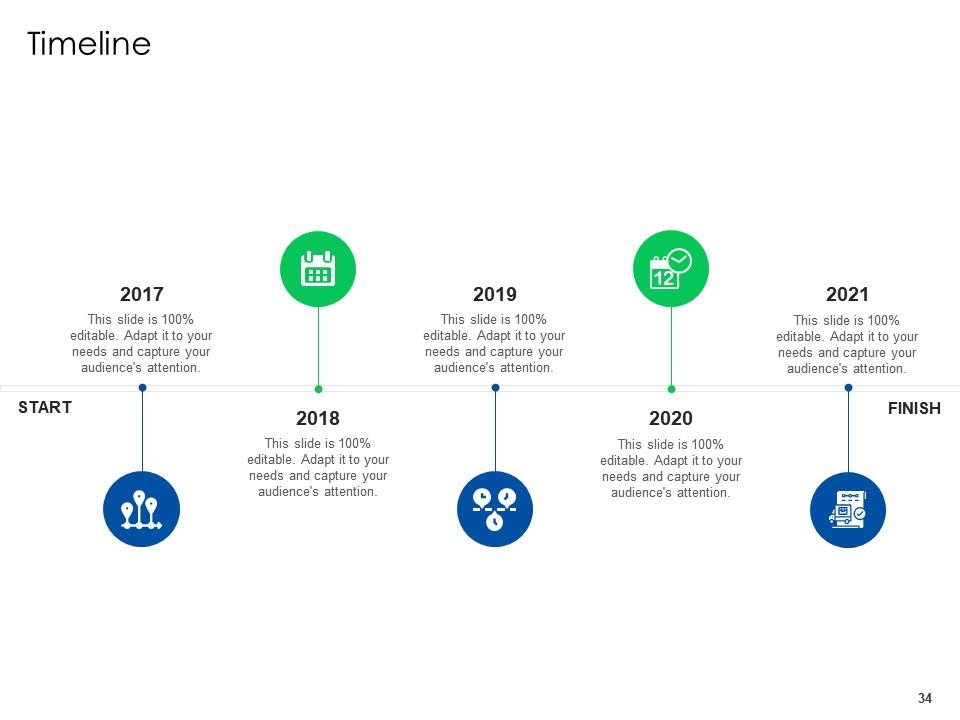
Slide 34: This slide exhibits yearly timeline.
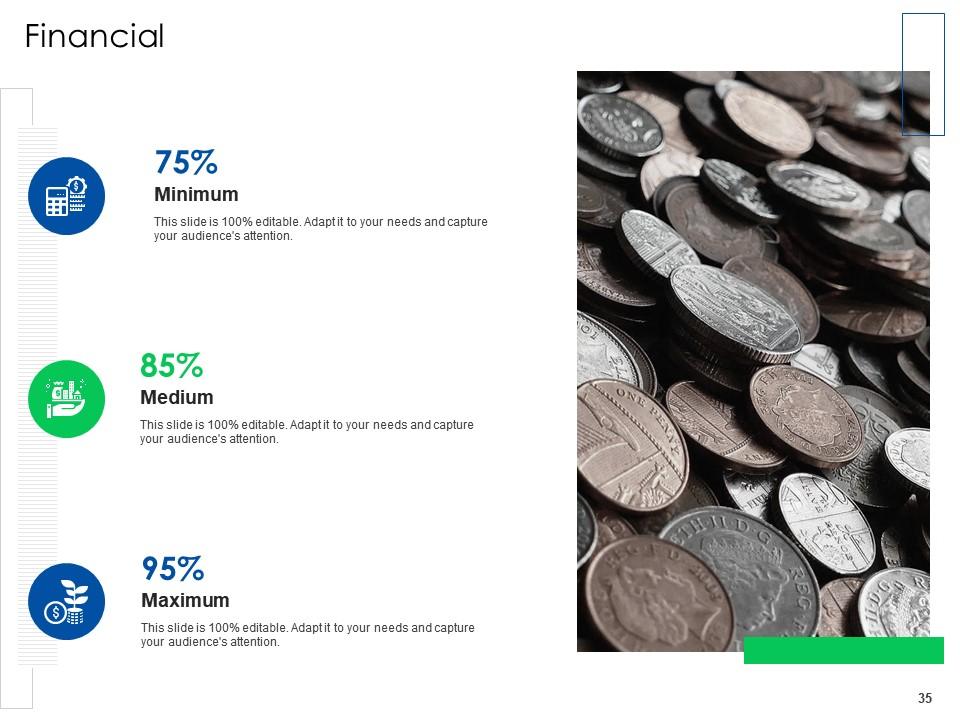
Slide 35: This slide showcases financials.
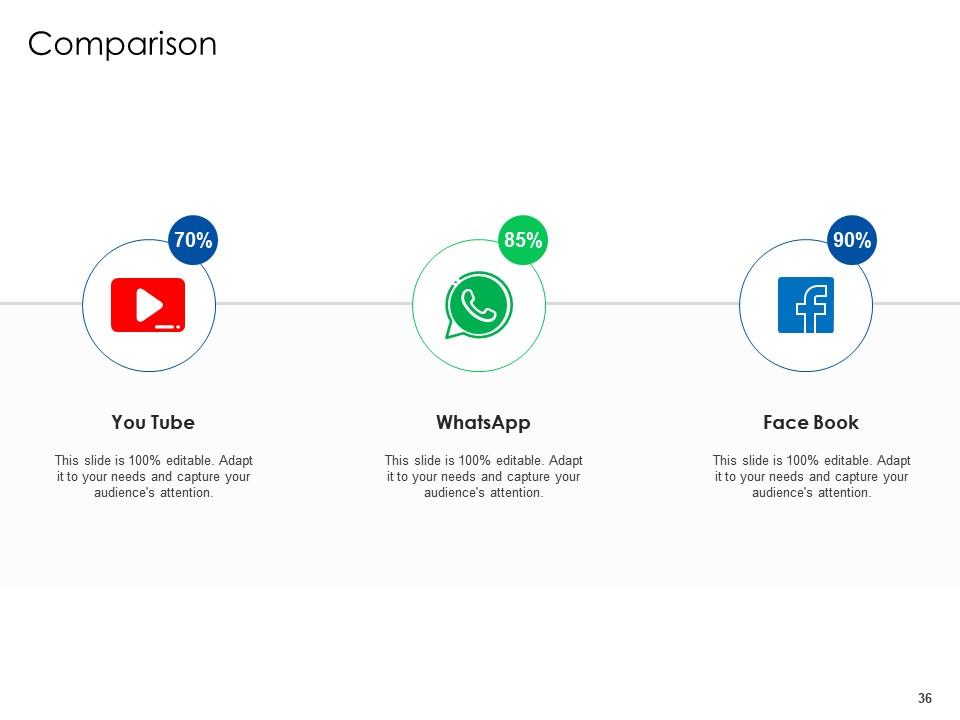
Slide 36: This slide highlights comparison of products based on selects.
Slide 37: This slide depicts posts for past experiences of clients.
Slide 38: This is thank you slide & contains contact details of company like office address, phone no., etc.
Global energy outlook challenges and recommendations case competition complete deck with all 38 slides:
Use our Global Energy Outlook Challenges And Recommendations Case Competition Complete Deck to effectively help you save your valuable time. They are readymade to fit into any presentation structure.
-
Out of the box and creative design.
-
Really like the color and design of the presentation.
-
Content of slide is easy to understand and edit.
-
Nice and innovative design.


