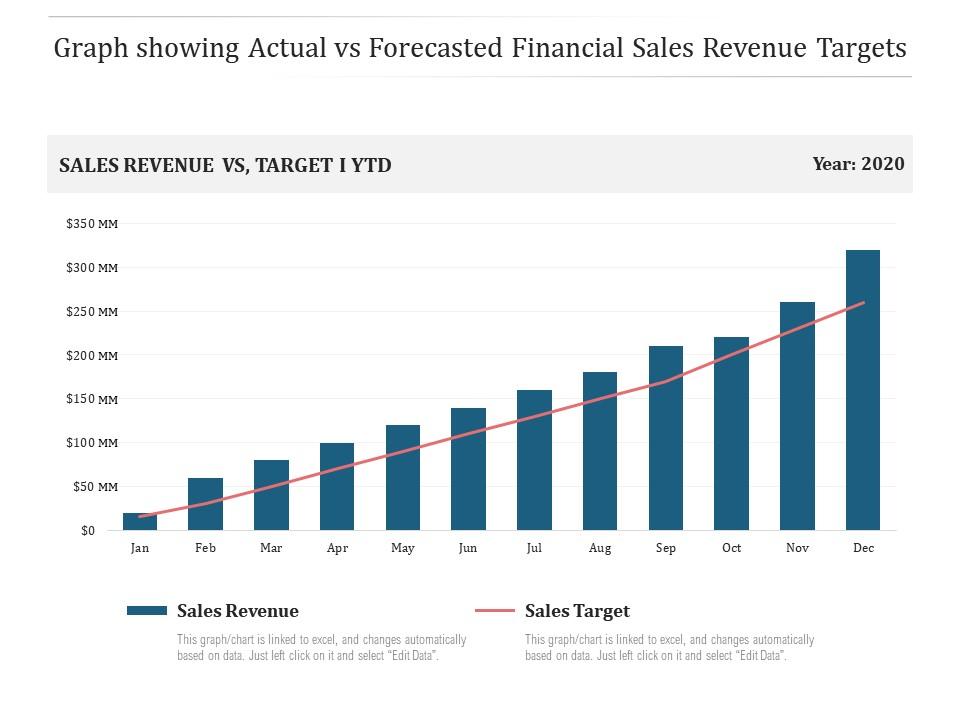
Graph showing actual vs forecasted financial sales revenue targets
Our Graph Showing Actual Vs Forecasted Financial Sales Revenue Targets are topically designed to provide an attractive backdrop to any subject. Use them to look like a presentation pro.
- Google Slides is a new FREE Presentation software from Google.
- All our content is 100% compatible with Google Slides.
- Just download our designs, and upload them to Google Slides and they will work automatically.
- Amaze your audience with SlideTeam and Google Slides.
-
Want Changes to This PPT Slide? Check out our Presentation Design Services
- WideScreen Aspect ratio is becoming a very popular format. When you download this product, the downloaded ZIP will contain this product in both standard and widescreen format.
-

- Some older products that we have may only be in standard format, but they can easily be converted to widescreen.
- To do this, please open the SlideTeam product in Powerpoint, and go to
- Design ( On the top bar) -> Page Setup -> and select "On-screen Show (16:9)” in the drop down for "Slides Sized for".
- The slide or theme will change to widescreen, and all graphics will adjust automatically. You can similarly convert our content to any other desired screen aspect ratio.
Compatible With Google Slides

Get This In WideScreen
You must be logged in to download this presentation.
PowerPoint presentation slides
Presenting this set of slides with name Graph Showing Actual Vs Forecasted Financial Sales Revenue Targets. The topics discussed in these slides are Sales Revenue, Sales Target. This is a completely editable PowerPoint presentation and is available for immediate download. Download now and impress your audience.
People who downloaded this PowerPoint presentation also viewed the following :
Graph showing actual vs forecasted financial sales revenue targets with all 2 slides:
Use our Graph Showing Actual Vs Forecasted Financial Sales Revenue Targets to effectively help you save your valuable time. They are readymade to fit into any presentation structure.
-
Good research work and creative work done on every template.


