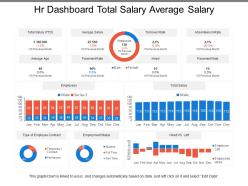
Hr dashboard total salary average salary

Rating:
100%
Slide 1 of 6
Favourites Favourites

Try Before you Buy Download Free Sample Product

Audience Impress Your
Audience
Editable 100%
Editable
Time Save Hours
of Time
The Biggest Sale is ending soon in
0
0
:
0
0
:
0
0
Rating:
100%
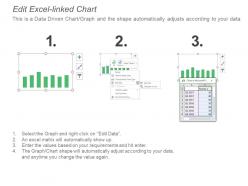
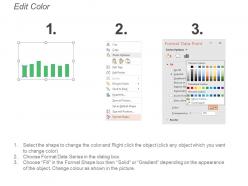
Presenting this set of slides with name - Hr Dashboard Total Salary Average Salary. This is a three stage process. The stages in this process are Hr Dashboard, Human Resource Dashboard, Hr Kpi.

People who downloaded this PowerPoint presentation also viewed the following :

FAQs for Hr dashboard total

So the basics are headcount, turnover, how long it takes to fill jobs, and who's calling out sick. Employee satisfaction scores are pretty crucial too - plus training stuff and performance reviews. Honestly though, it really comes down to what your bosses actually want to see. Some places go nuts with diversity breakdowns and pay ratios by department. I'd say pick maybe 6-8 things max that'll actually influence decisions. Don't just dump every metric you can think of on there because it looks impressive - nobody's gonna use a cluttered mess of data anyway.

Dude, get an HR dashboard. You'll actually see what's happening with your team in real time instead of guessing or waiting forever for some report. Turnover trends, who's engaged, performance stuff - it's all right there. No more Excel hell, thank god. I can spot which departments are struggling and actually back up my budget requests with real data. Honestly made my job so much easier. Just pick your top 3-5 metrics that actually matter to the business first, then build it out from there.

Honestly, go with Tableau, Power BI, or Looker for HR dashboards - they're the heavy hitters. Power BI's probably your sweet spot if you're already using Office 365, way easier to pick up than Tableau. Excel works for basic stuff but you'll hit a wall pretty quick when you want actual interactive features. Oh, and Google Data Studio is free which is nice if you're being cheap about it lol. Some HR platforms like BambooHR have dashboards built in, but they're kinda meh compared to real BI tools. Start simple though - don't overcomplicate it right out the gate.

Dude, get an HR dashboard - it'll change your life. You can see all your performance stuff in real time: goal completion, review scores, productivity trends. Plus tracking engagement through surveys, turnover, absenteeism patterns. Way better than hunting through endless spreadsheets when your boss asks how things are going (which happens way too often, right?). The visual charts make it obvious which teams rock and which ones need help. Oh, and set up alerts for important metrics so you catch problems early instead of dealing with disasters later.

Honestly, good data visualization is what separates useful HR dashboards from total garbage. Nobody wants to dig through spreadsheet hell when they could just glance at a clean chart instead. Color-coded visuals let you spot problems right away - way better than scrolling through 50 rows of turnover numbers. Your team will actually understand what's happening and can make faster decisions. I always tell people: if someone can't figure out your dashboard in 30 seconds, the design sucks. Charts and graphs aren't just pretty - they're functional.

Honestly, HR dashboards are a game-changer for small businesses. No more digging through random spreadsheets to find basic info about your team. Everything's right there - turnover rates, performance stuff, who's actually engaged at work. I started with just tracking like 3-4 metrics because going overboard is tempting but pointless. The best part? You catch issues before they blow up. Maybe one team's suddenly unhappy or you're bleeding talent in a specific department. Takes forever to spot that manually. Oh, and the time you save on reports is insane - I probably get back 2-3 hours weekly just from not doing everything by hand.

Start with the basics - headcount, turnover, time-to-hire, satisfaction scores. Keep everything visible without endless clicking around (seriously, nobody has time for that). Your data needs to refresh regularly or people will just stop trusting it. Bar charts and trend lines are your friends here - pie charts usually just confuse everyone. Don't cram everything onto one screen though. Group similar stuff together. Oh, and here's the thing - actually ask people what decisions they're trying to make first. Then build around that instead of guessing what they want.

Focus on metrics that actually move the needle for your business goals first. Retention matters? Lead with turnover rates. C-suite wants to see revenue per employee and how long critical roles take to fill. Honestly, avoid cramming everything into one dashboard - I've made that mistake and it's just overwhelming noise. Pick 5-7 key metrics that paint a clear picture of workforce health. Group similar stuff together and make the important numbers pop visually. Here's the thing though - if you can't act on what you're showing, why even track it? Make sure every metric has a purpose.

Honestly, start with 3-4 key metrics you actually care about tracking. Your HR dashboard will show representation breakdowns - gender, ethnicity, age groups, whatever matters for your company. Track hiring stages and promotion rates too since that's where you'll catch the biggest gaps. Survey results are clutch for measuring inclusion (not just diversity numbers). I swear visualizing this data hits different than staring at endless spreadsheets. You can benchmark against industry standards to see if you're doing okay or... not so much. Oh, and watch for patterns where diverse talent drops off - those red flags are super telling.

Dude, real-time HR dashboards are a game changer for hiring. You'll instantly see which job boards actually bring in decent candidates instead of just throwing money at random sites. Plus you can track how your hiring speed stacks up against competitors - nobody wants to lose good people because your process drags on forever. The coolest part? You spot bottlenecks before they wreck everything. Oh, and the salary data updates live, so you can tweak compensation without waiting weeks for reports. My advice: pick your 3 biggest recruiting headaches first and set up alerts for just those metrics.

Ugh, the worst thing you can do is cram like 20 different metrics on there - nobody wants to stare at that mess. Focus on maybe 5-7 things that actually matter to your business, not just whatever's easiest to pull from your database. Give people context too! If you show a number, they need to know if it's good or terrible. I've literally seen these drop-dead gorgeous dashboards that looked amazing but told you absolutely nothing useful. What a waste. Start simple and don't get fancy until you nail the basics first.

Honestly, predictive analytics is like upgrading from looking backwards to actually seeing what's coming. You can spot which employees might bail before they even update their LinkedIn - pretty crazy how accurate it gets. Instead of scrambling when half your marketing team quits, you'll catch retention red flags early. Same goes for skill gaps and performance issues. My advice? Don't try to predict everything at once (learned that the hard way). Pick one specific problem first, like turnover in your sales department or whatever's keeping you up at night. Build momentum there, then expand.

Oh there's so much you can pull! Turnover rates, headcount stuff, performance reviews, compensation breakdowns. Most systems let you filter by department or date ranges which is super helpful. Recruitment pipeline data is huge too - like where candidates are dropping off. Time-off tracking, diversity reports, training completion... honestly depends what you're already measuring. I'd figure out what your bosses keep asking about first, then just build around that. Way easier than trying to create every possible report upfront, trust me.

Honestly, monthly updates work for most HR stuff, but some metrics need way more attention. Weekly makes sense for headcount and turnover - that stuff moves fast and people need to know. Recruiting pipeline too, since that changes constantly. For engagement scores and comp analysis? Quarterly is totally fine. Those don't really shift much week to week anyway. I'd probably start with monthly across the board and then see what your team actually looks at. No point updating something daily if nobody checks it, you know? Match it to how often the data actually matters for decisions.

So benchmarking basically lets you compare your HR metrics to industry standards or your own past data - otherwise you're just staring at random numbers. Like, 15% turnover could be amazing or awful depending on your field. I'd start with external stuff (industry averages, what competitors are doing) plus your own historical trends to see if you're improving. Honestly, the trick is finding good comparison points that actually make sense for your situation. Pick maybe 3-5 key metrics first and hunt down solid benchmark data for those. Don't go crazy trying to benchmark everything at once.

Ratings and Reviews

100% of 100
Review Form
Write a review
Most Relevant Reviews
  1. 100%

    by Dong Santos

    Very unique and reliable designs.
  2. 100%

    by Doyle Andrews

    Wonderful templates design to use in business meetings.

2 Item(s)

per page: