Improve the customers perception towards dairy products of a company case competition complete deck
Todays consumers place greater importance than ever on food quality, food safety, and environmental quality. In todays world of increasing competition, where numerous brands sell the same products, consumers have abundant choices, and many different factors affect their buying behavior. Consumer perception towards dairy products can be positive and negative, which are affected by the companys strategies. Consumer perception of dairy products can be harmful for various reasons such as poor product quality, value for money, low brand awareness, etc. Due to these reasons, the companys financials total revenue, total profits, customer base, etc. has declined over the past few years. This presentation is helpful for Dairy companies that are facing issues such as reduction in the customer base, the decline in dairy product sales, decline in market share, etc. This will help the companies to identify the new strategies, recommendations, and solutions to overcome the challenges, i.e., decline in dairy product sales due to change in customers perception towards dairy products. These strategies might help the company to positively shift the customers perception towards the companys dairy products and help boost the sales of the products. The main objective of this presentation is to analyze the reasons behind dairy product sales decline and identify the key strategies to change the customers perception of dairy products. This presentation covers various slides such as Company introduction, Company financials before implementing systems, problems, solutions, total sales of the dairy industry, Social media followers, SWOT analysis. Geographical reach, Competitor brand analysis, ways to increase customer trust, product distribution channel analysis, key cost drivers, strategy implementation, significant risks, mitigation strategies, and many more. In the end, this presentation covers company revenue and market share after successfully implementing the plan. It also covers the financial forecasts Income statement and balance sheet with dairy products sales forecasts for the next five years and dashboards related to dairy companies. Talk to our experts for all your queries and get access to the pitch deck for diary products. Download the pitch deck and connect with us now.
Todays consumers place greater importance than ever on food quality, food safety, and environmental quality. In todays worl..
- Google Slides is a new FREE Presentation software from Google.
- All our content is 100% compatible with Google Slides.
- Just download our designs, and upload them to Google Slides and they will work automatically.
- Amaze your audience with SlideTeam and Google Slides.
-
Want Changes to This PPT Slide? Check out our Presentation Design Services
- WideScreen Aspect ratio is becoming a very popular format. When you download this product, the downloaded ZIP will contain this product in both standard and widescreen format.
-

- Some older products that we have may only be in standard format, but they can easily be converted to widescreen.
- To do this, please open the SlideTeam product in Powerpoint, and go to
- Design ( On the top bar) -> Page Setup -> and select "On-screen Show (16:9)” in the drop down for "Slides Sized for".
- The slide or theme will change to widescreen, and all graphics will adjust automatically. You can similarly convert our content to any other desired screen aspect ratio.
Compatible With Google Slides

Get This In WideScreen
You must be logged in to download this presentation.
PowerPoint presentation slides
Deliver an informational PPT on various topics by using this Improve The Customers Perception Towards Dairy Products Of A Company Case Competition Complete Deck. This deck focuses and implements best industry practices, thus providing a birds eye view of the topic. Encompassed with fifty one slides, designed using high quality visuals and graphics, this deck is a complete package to use and download. All the slides offered in this deck are subjective to innumerable alterations, thus making you a pro at delivering and educating. You can modify the color of the graphics, background, or anything else as per your needs and requirements. It suits every business vertical because of its adaptable layout.
People who downloaded this PowerPoint presentation also viewed the following :
Content of this Powerpoint Presentation
Slide 1: This slide displays the title i.e. 'Improve the Customer's Perception Towards Dairy Products of a Company (Case Competition)' and your Company Name.
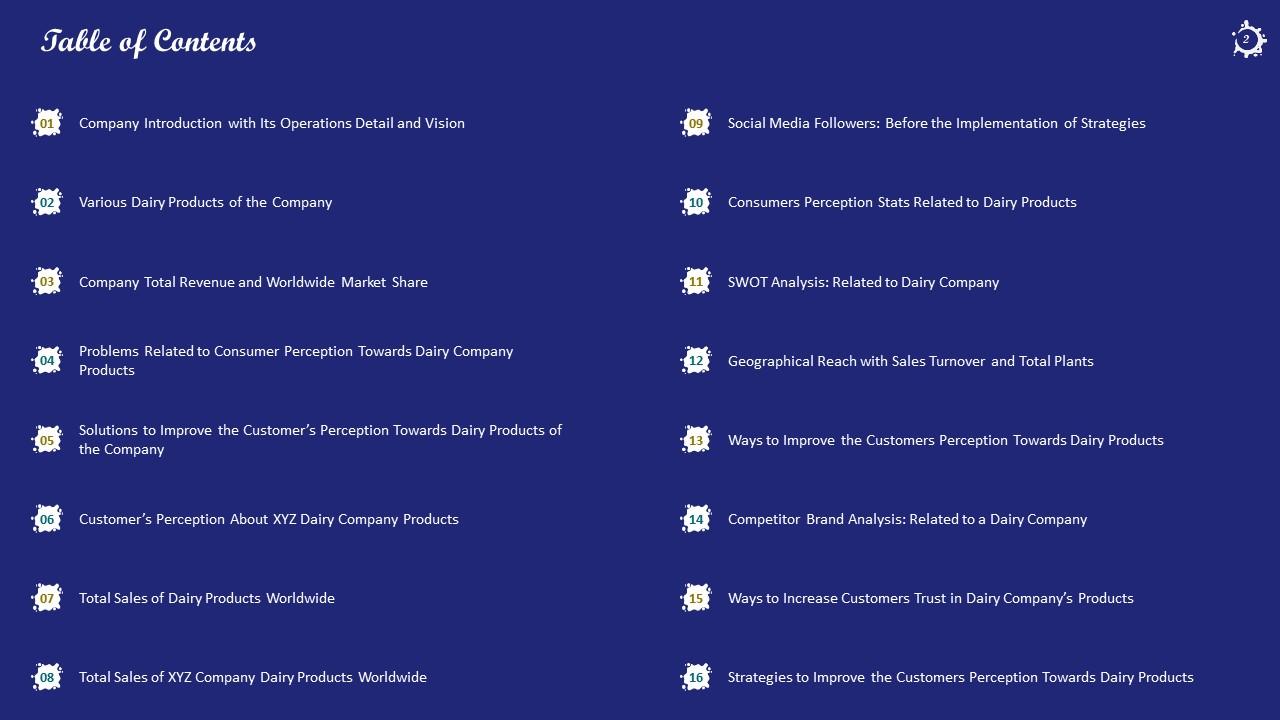
Slide 2: This slide presents the table of contents for the project.
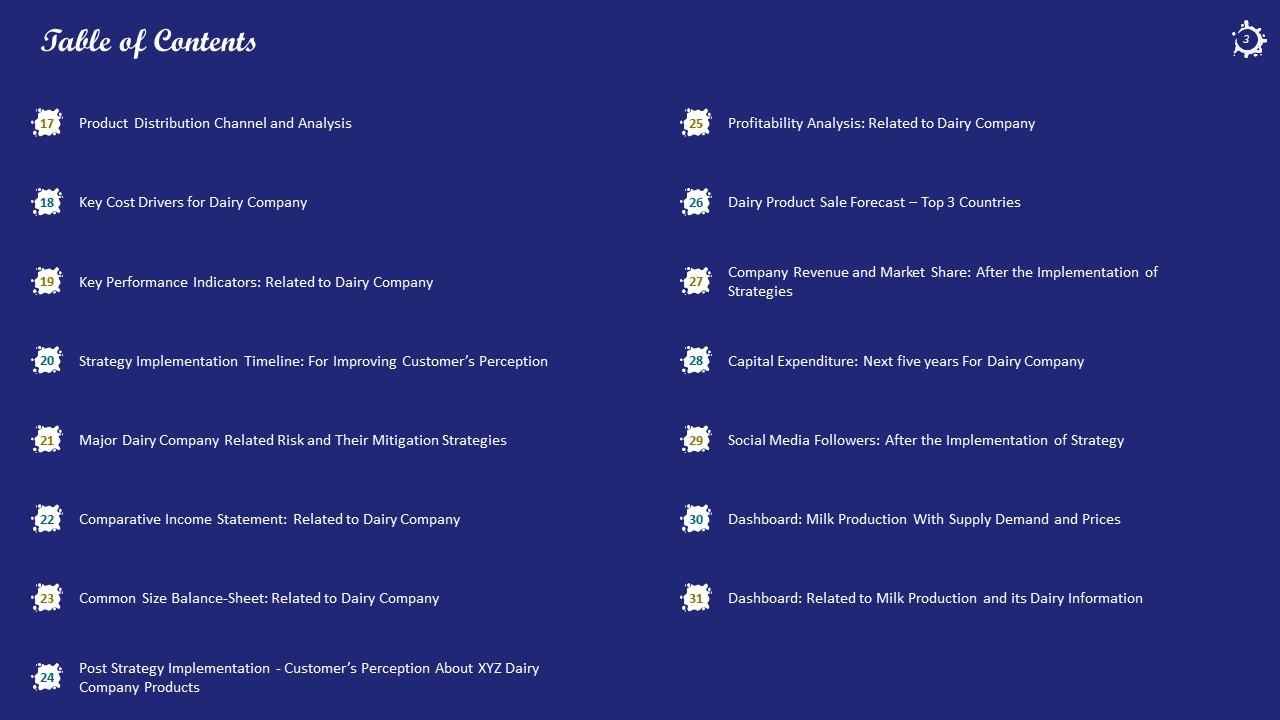
Slide 3: This slide presents the table of contents for the project.
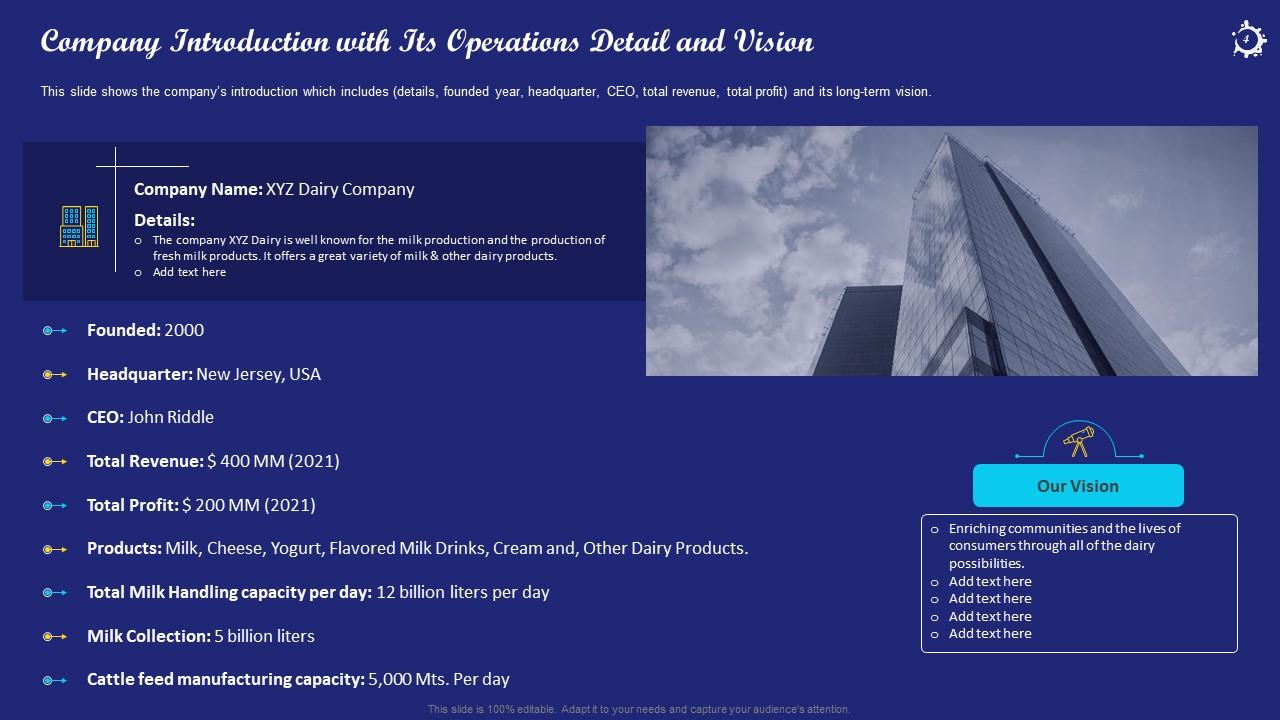
Slide 4: This slide shows the company’s introduction which includes (details, founded year, headquarter, CEO, total revenue, total profit) and its long-term vision.
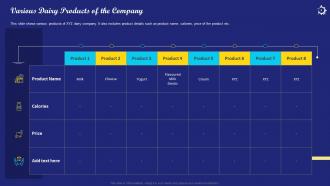
Slide 5: This slide shows various products of XYZ dairy company. It also includes product details such as product name, calories, price of the product etc.
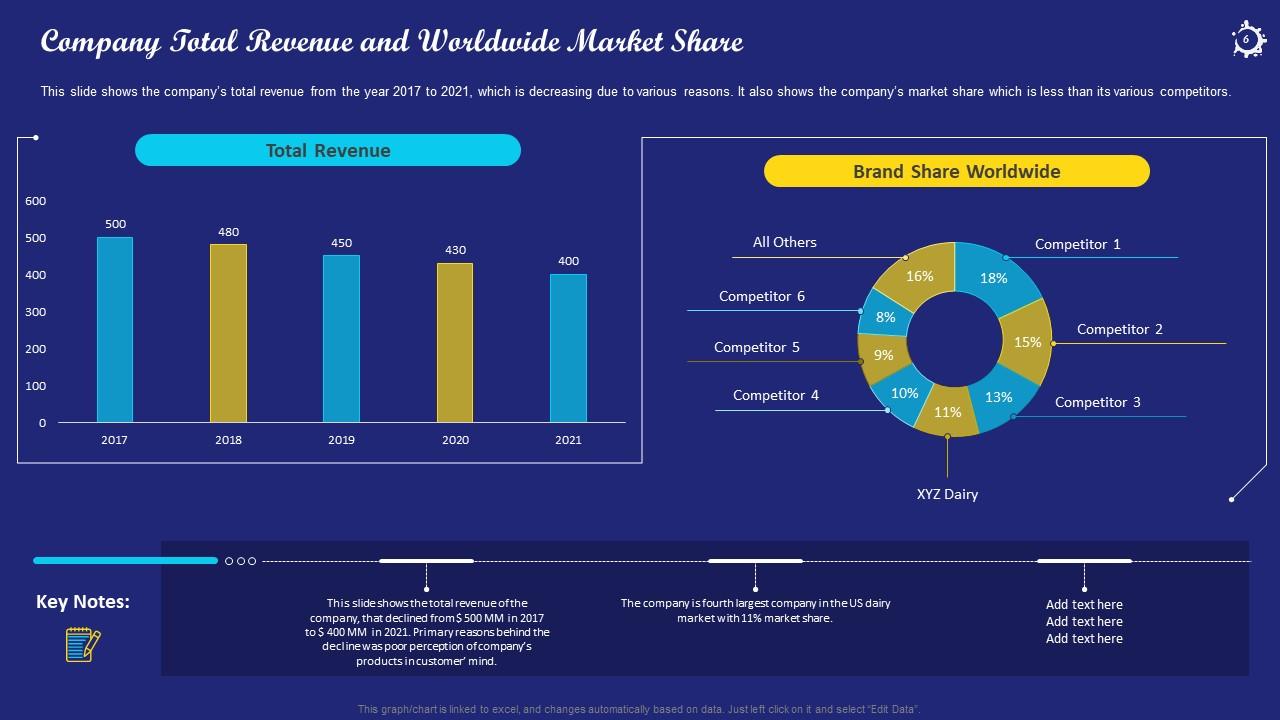
Slide 6: This slide shows the company’s total revenue from the year 2017 to 2021, which is decreasing due to various reasons.
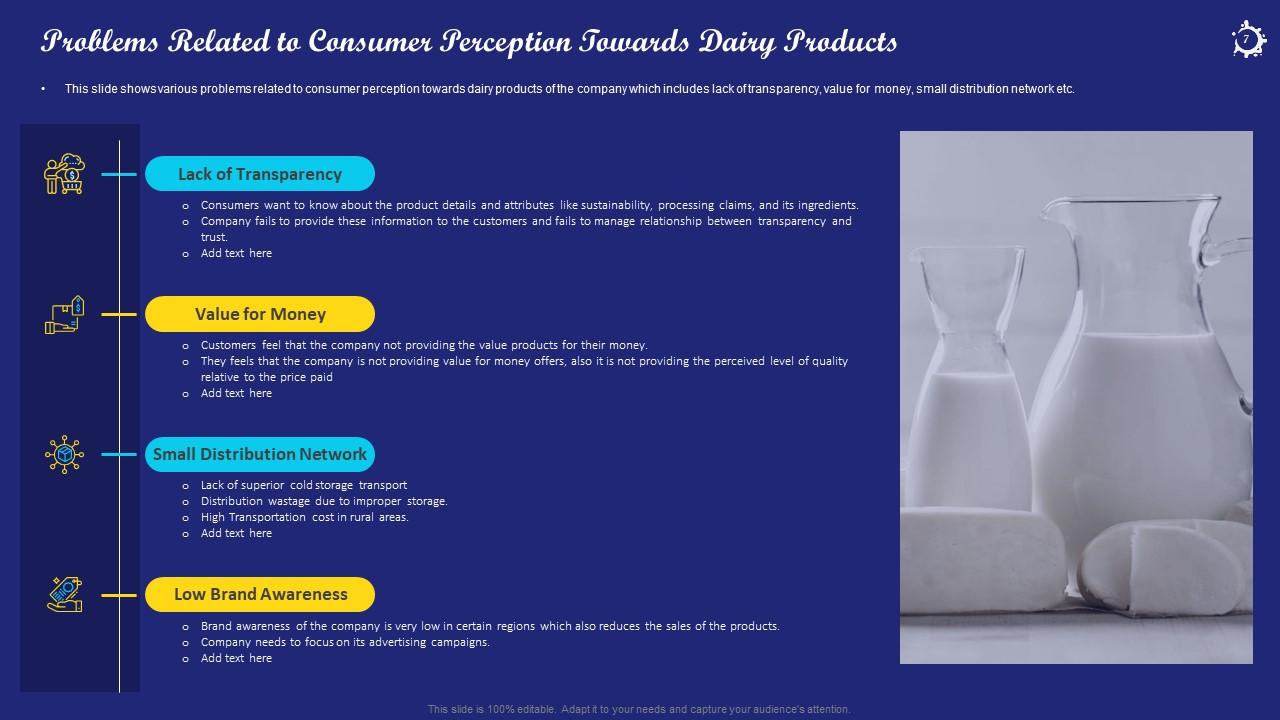
Slide 7: This slide shows various problems related to consumer perception towards dairy products of the company.
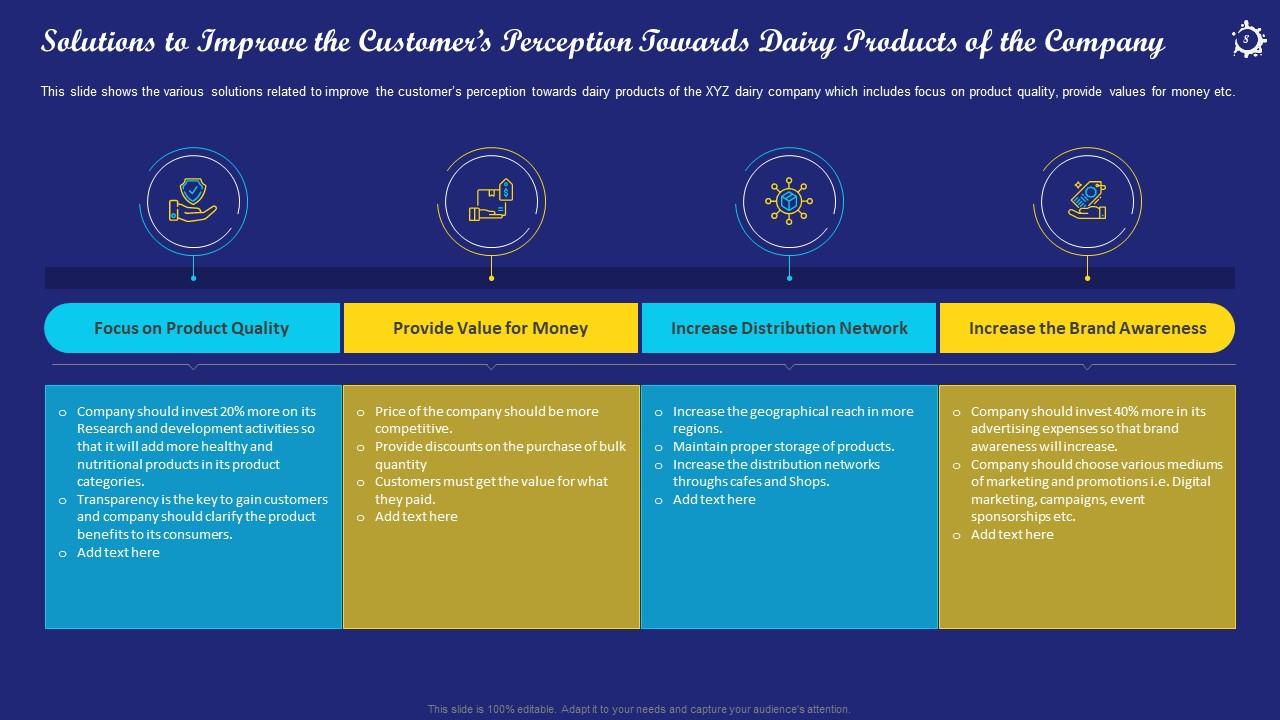
Slide 8: This slide shows the various solutions related to improve the customer’s perception towards dairy products of the XYZ dairy company.
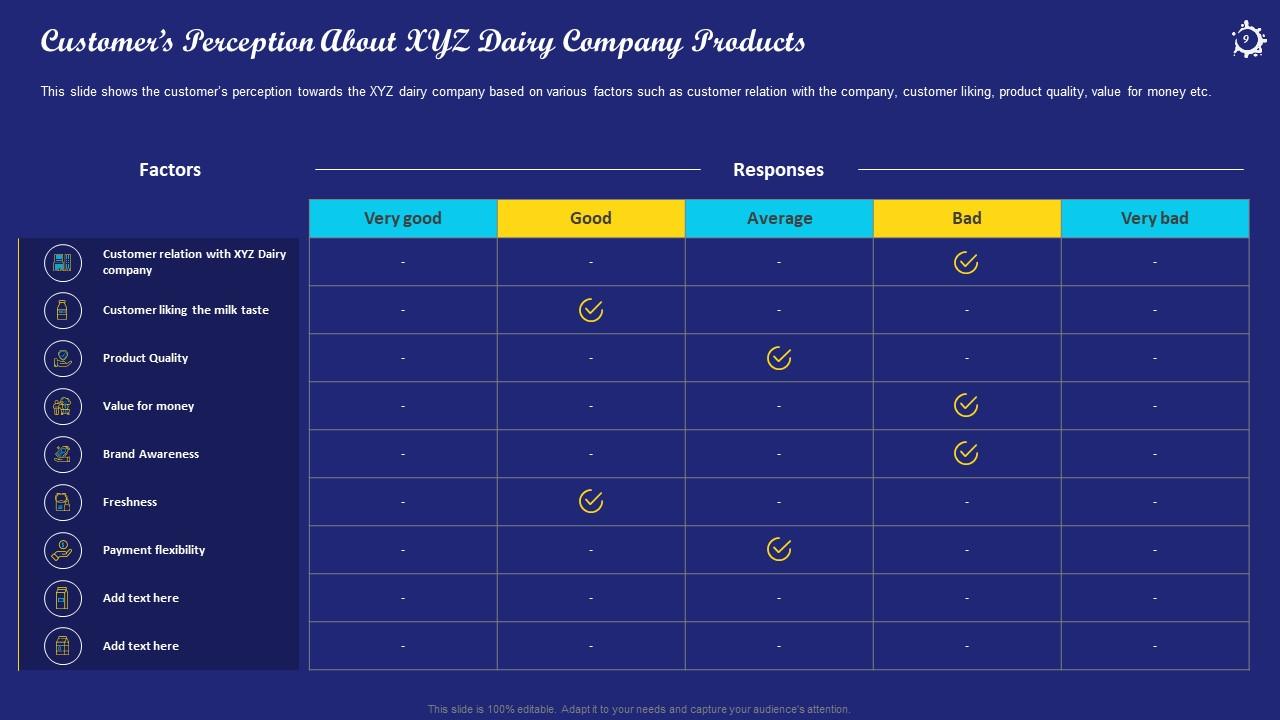
Slide 9: This slide shows the customer’s perception towards the XYZ dairy company based on various factors such as customer relation with the company, customer liking, etc.
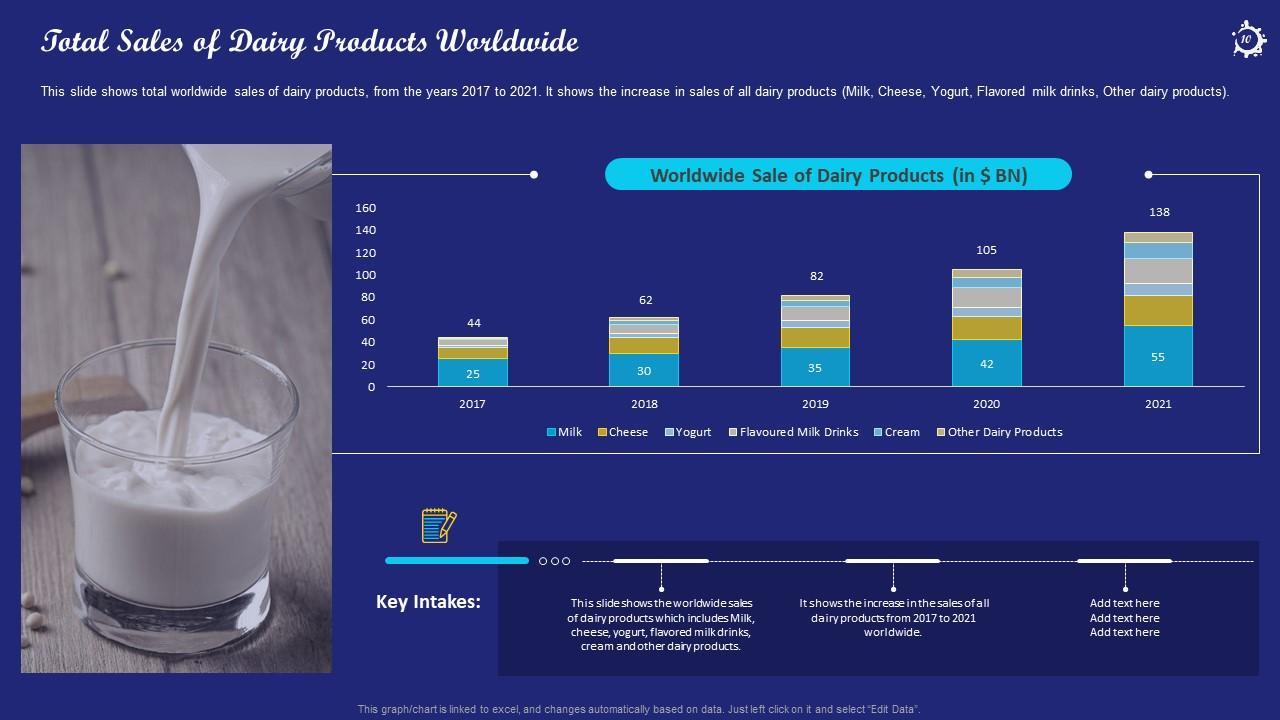
Slide 10: This slide shows total worldwide sales of dairy products, from the years 2017 to 2021.
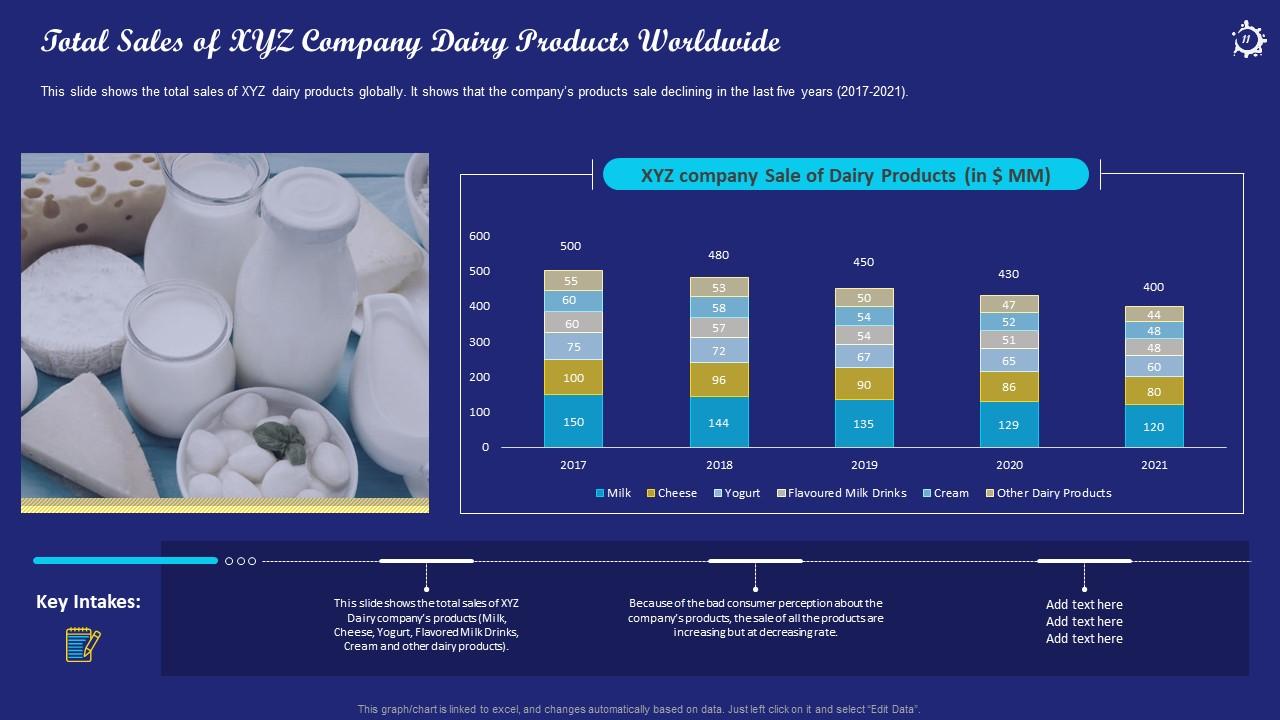
Slide 11: This slide shows the total sales of XYZ dairy products globally. It shows that the company’s products sale declining in the last five years (2017-2021).
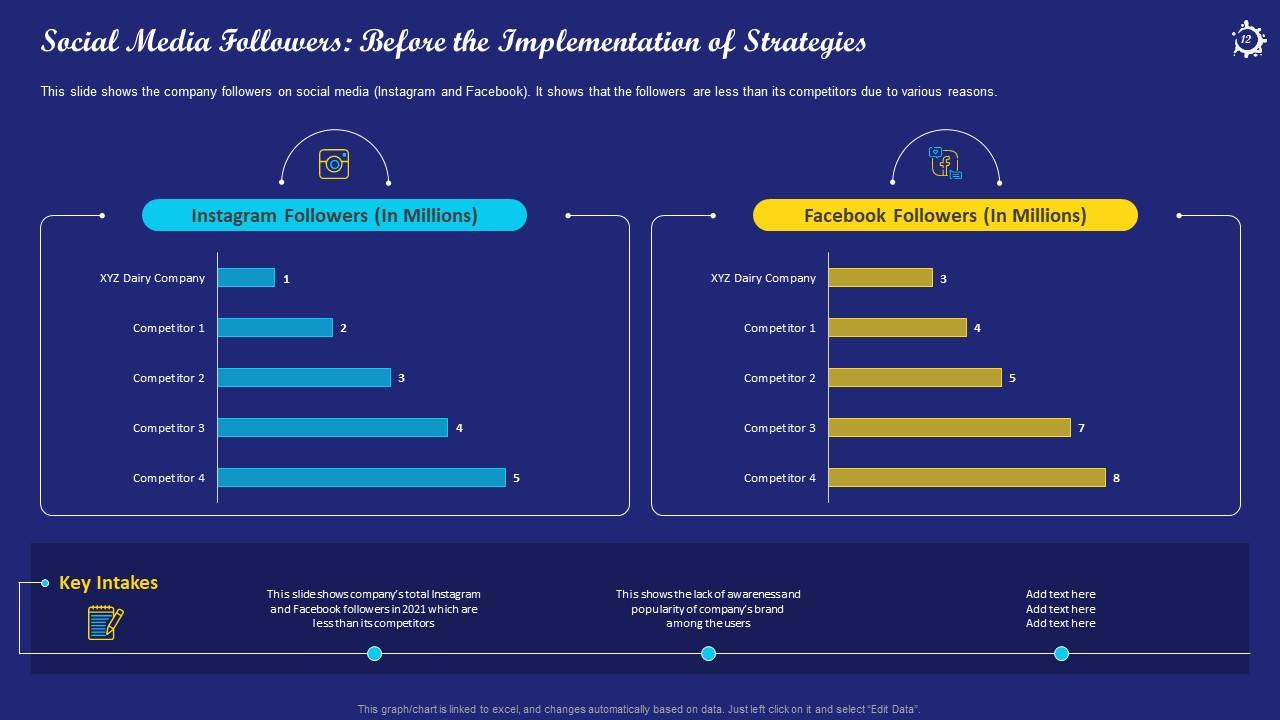
Slide 12: This slide shows company’s total Instagram and Facebook followers in 2021 which are less than its competitors
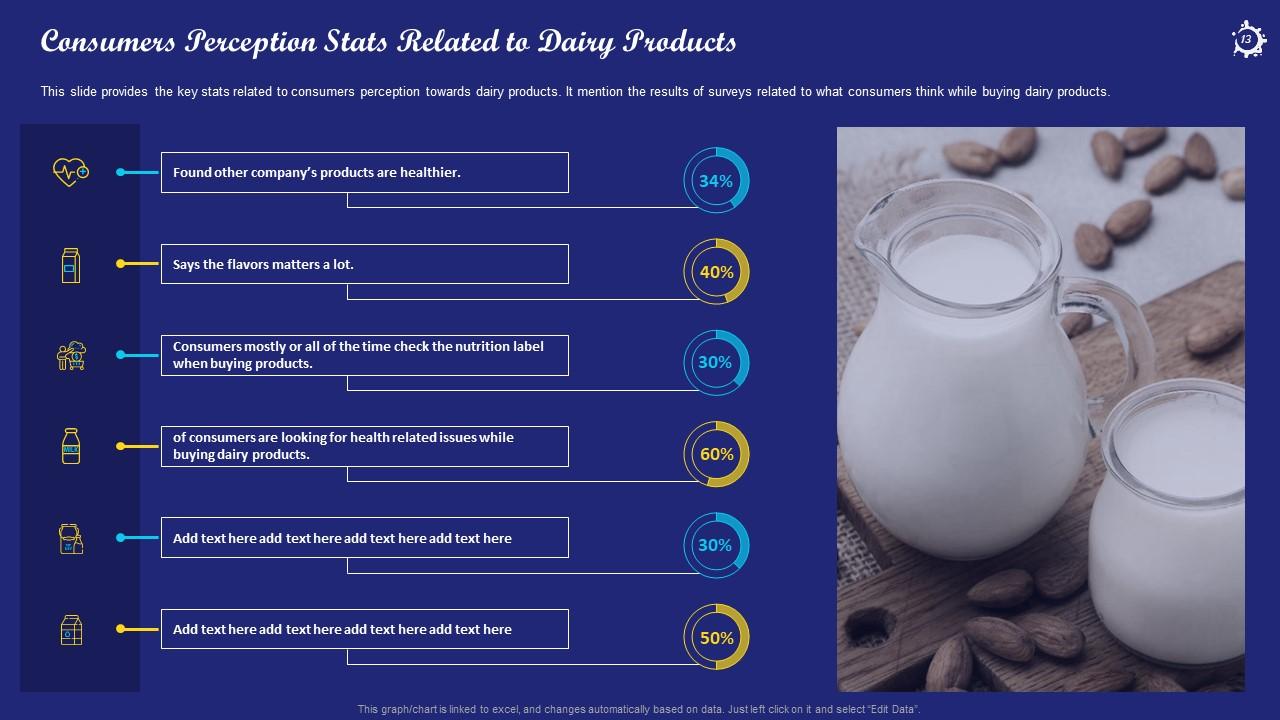
Slide 13: This slide provides the key stats related to consumers perception towards dairy products.
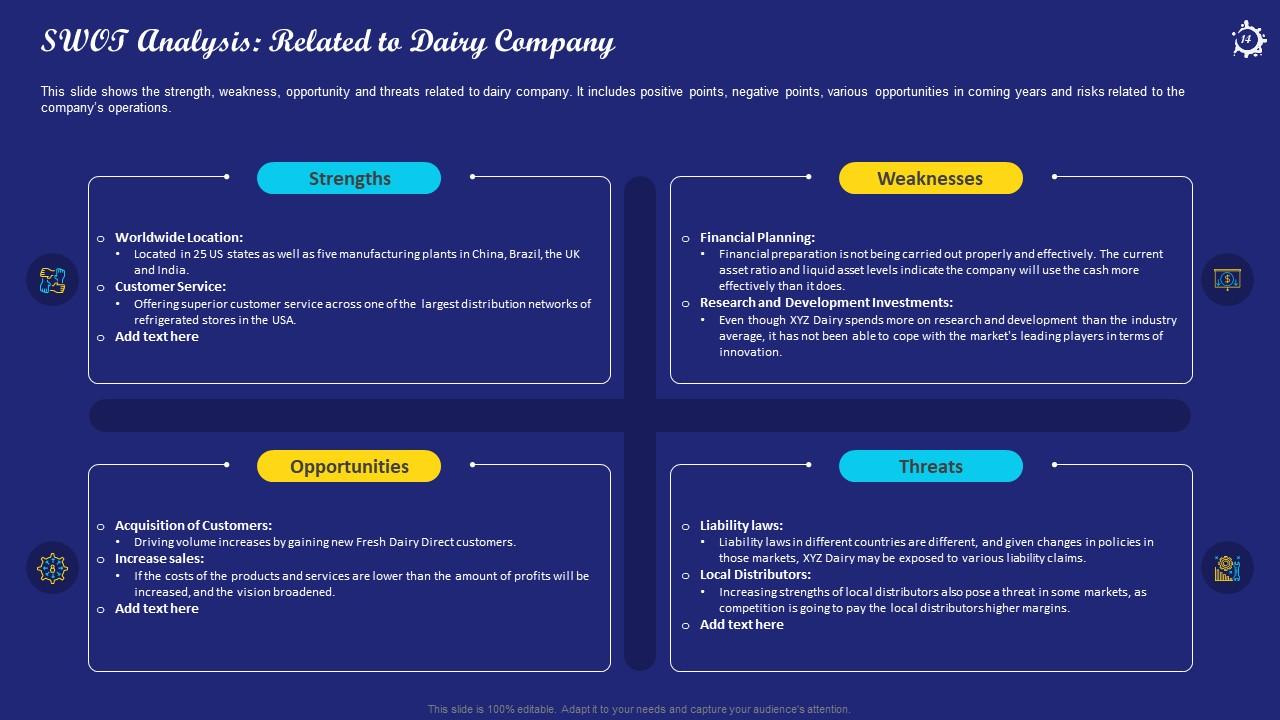
Slide 14: This slide shows the strength, weakness, opportunity and threats related to dairy company.
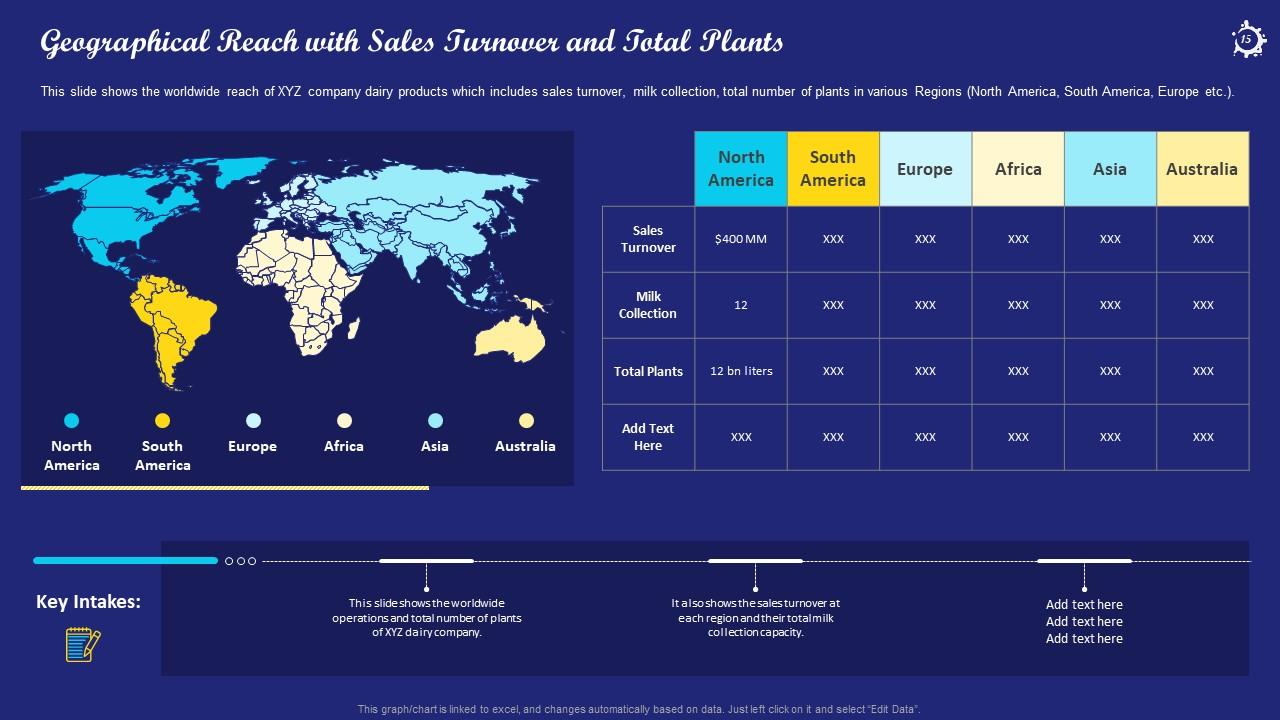
Slide 15: This slide shows the worldwide reach of XYZ company dairy products which includes sales turnover, milk collection, total number of plants in various Regions.
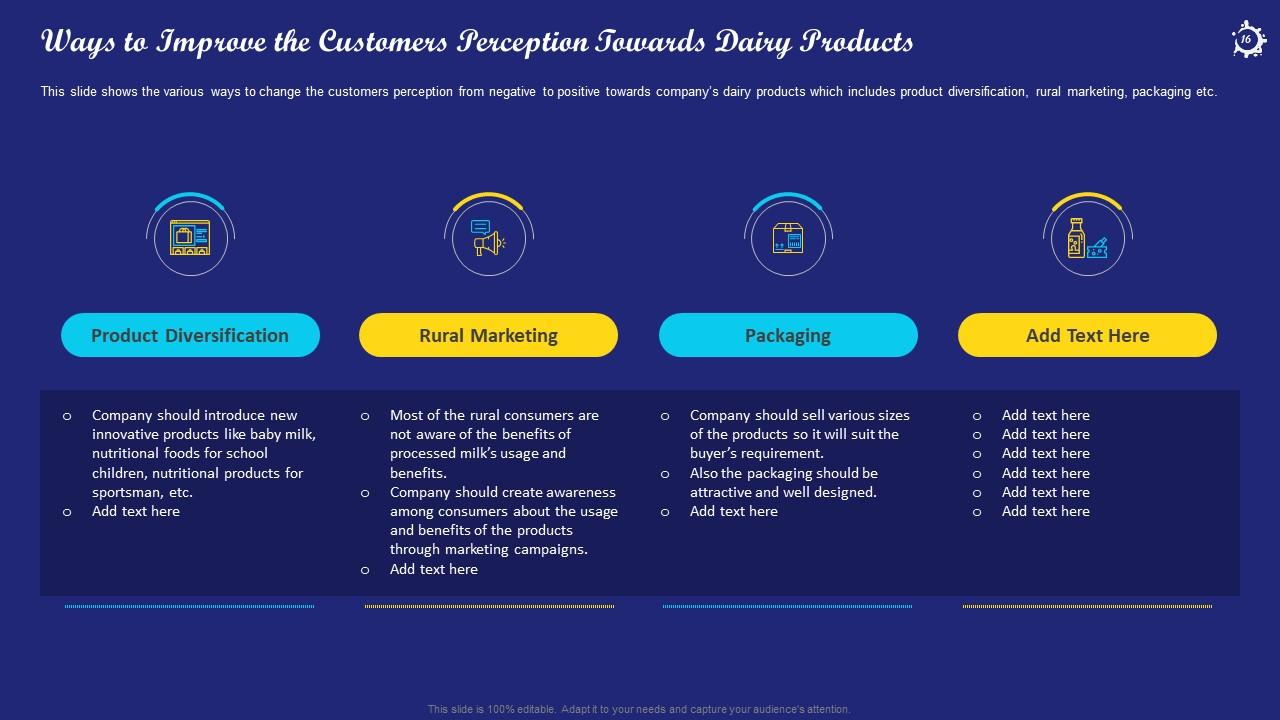
Slide 16: This slide shows the various ways to change the customers perception from negative to positive towards company’s dairy products.
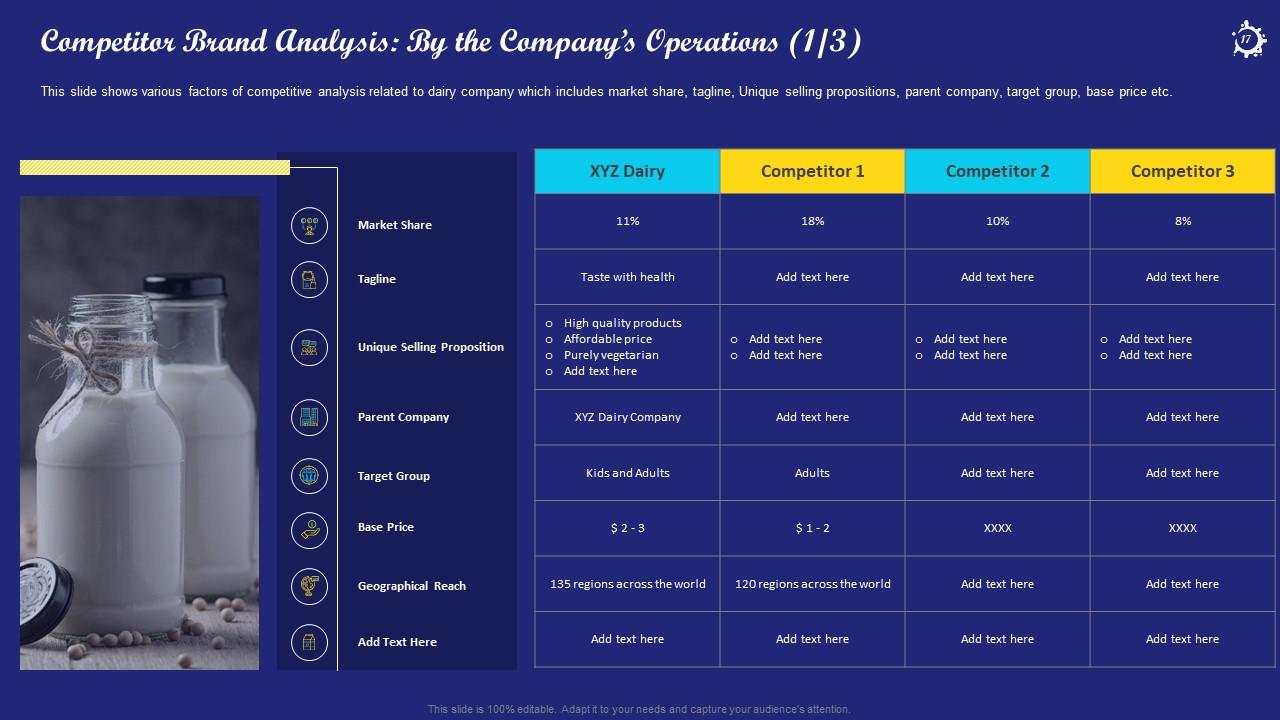
Slide 17: This slide shows various factors of competitive analysis related to dairy company.
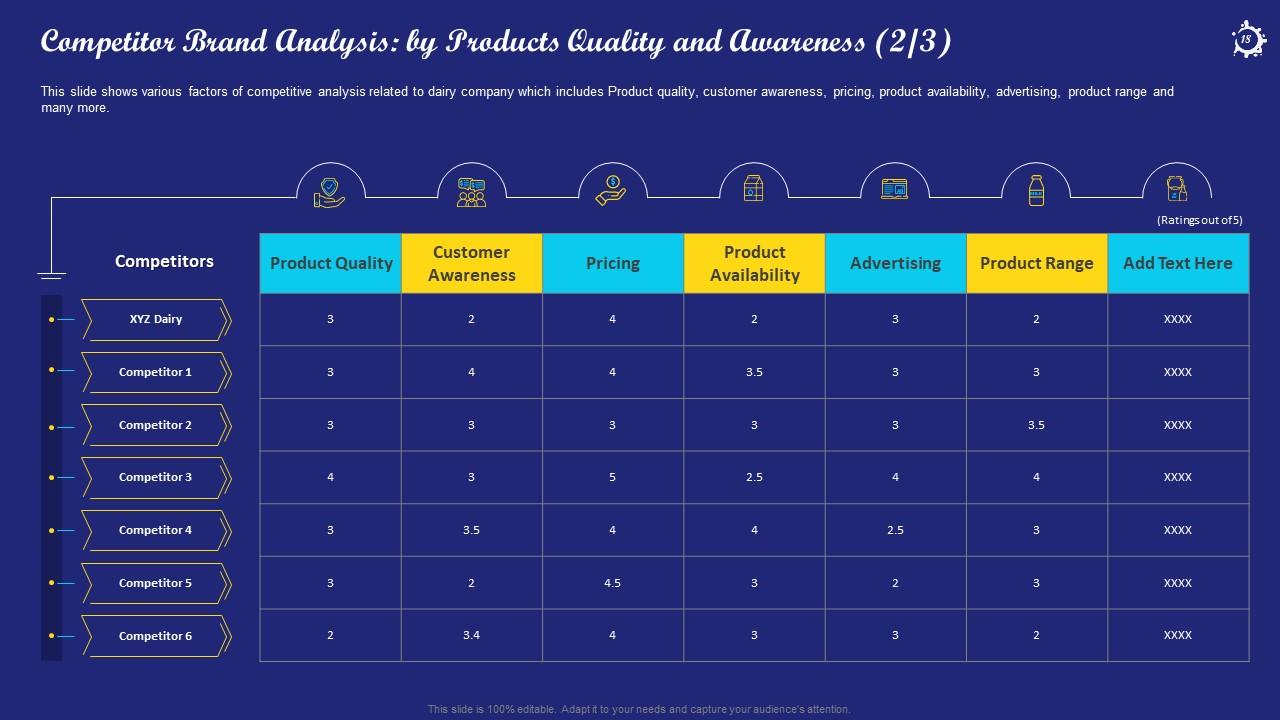
Slide 18: This slide shows various factors of competitive analysis related to dairy company which includes Product quality, customer awareness, pricing, etc.
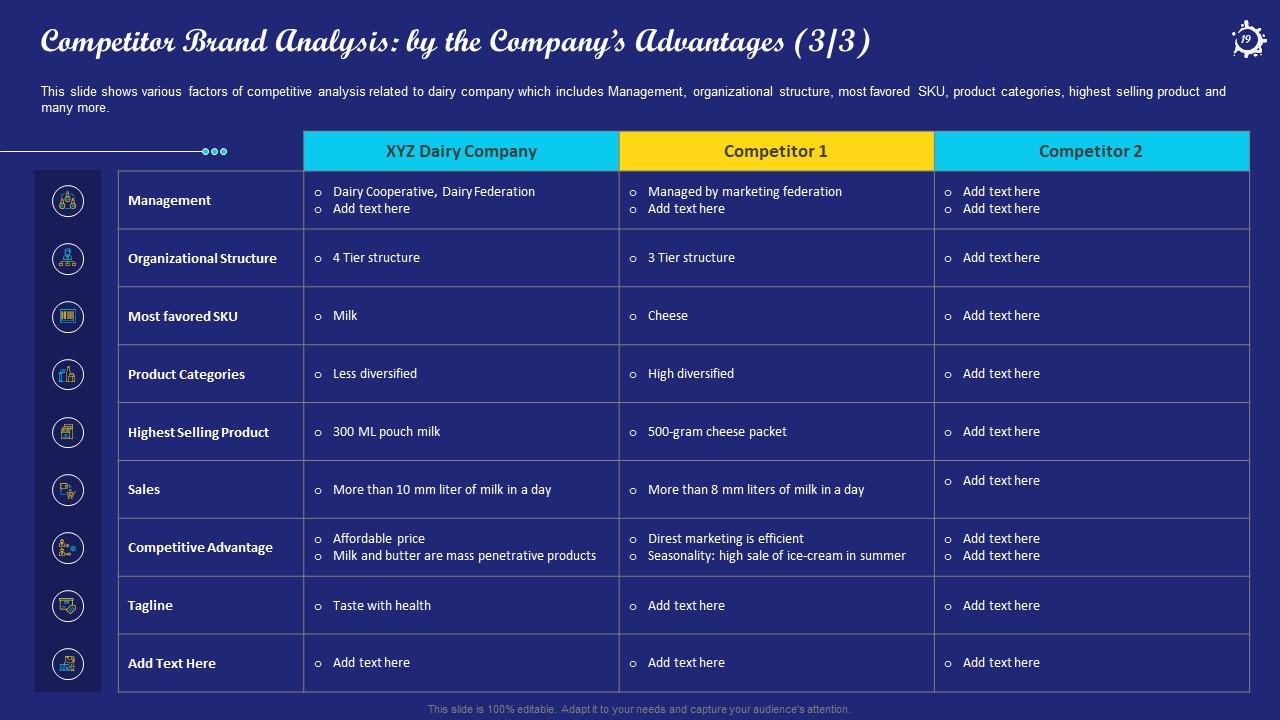
Slide 19: This slide shows various factors of competitive analysis related to dairy company which includes Management, organizational structure, most favored SKU, and many more.
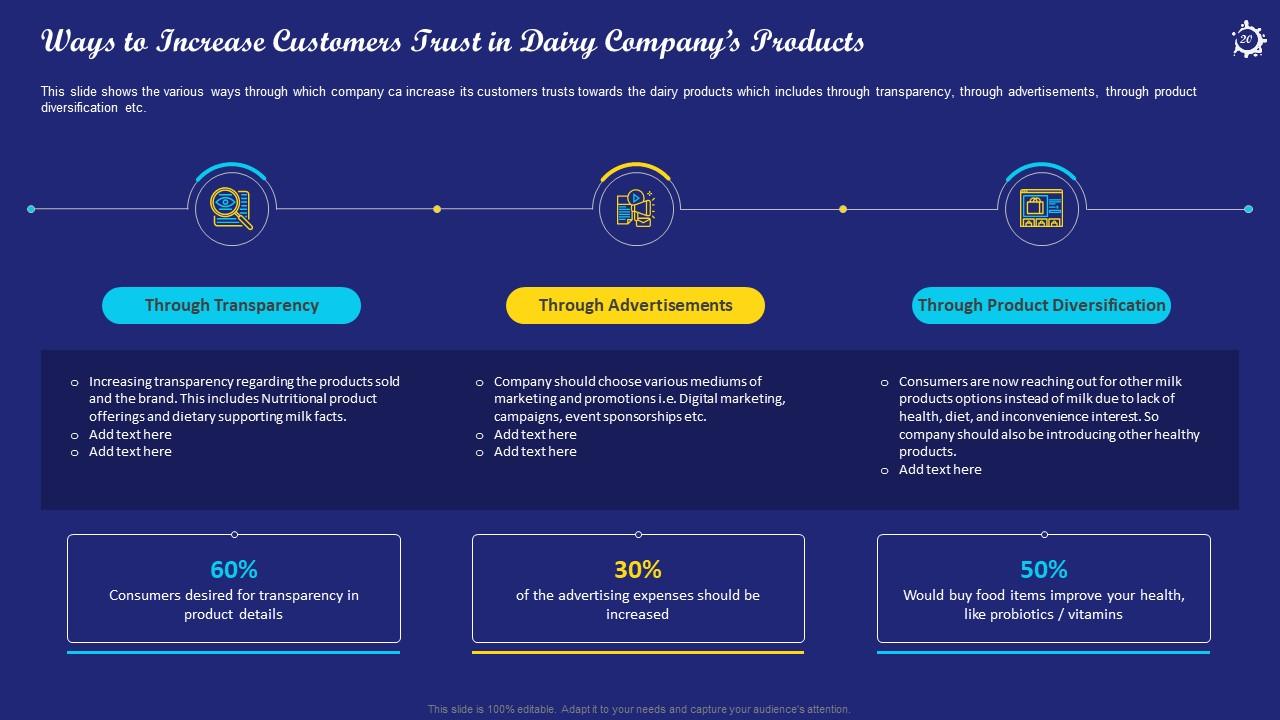
Slide 20: This slide shows the various ways through which company ca increase its customers trusts towards the dairy products which includes transparency, advertisements.
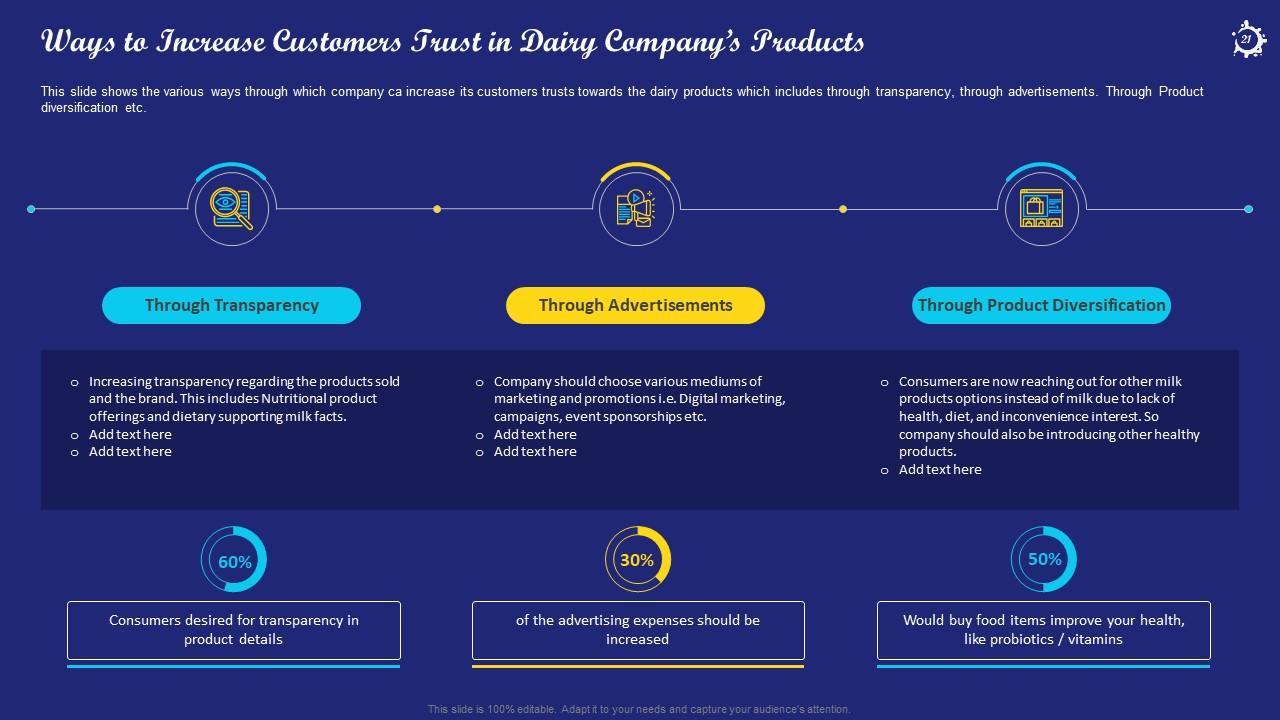
Slide 21: This slide shows the various ways through which company ca increase its customers trusts towards the dairy products.
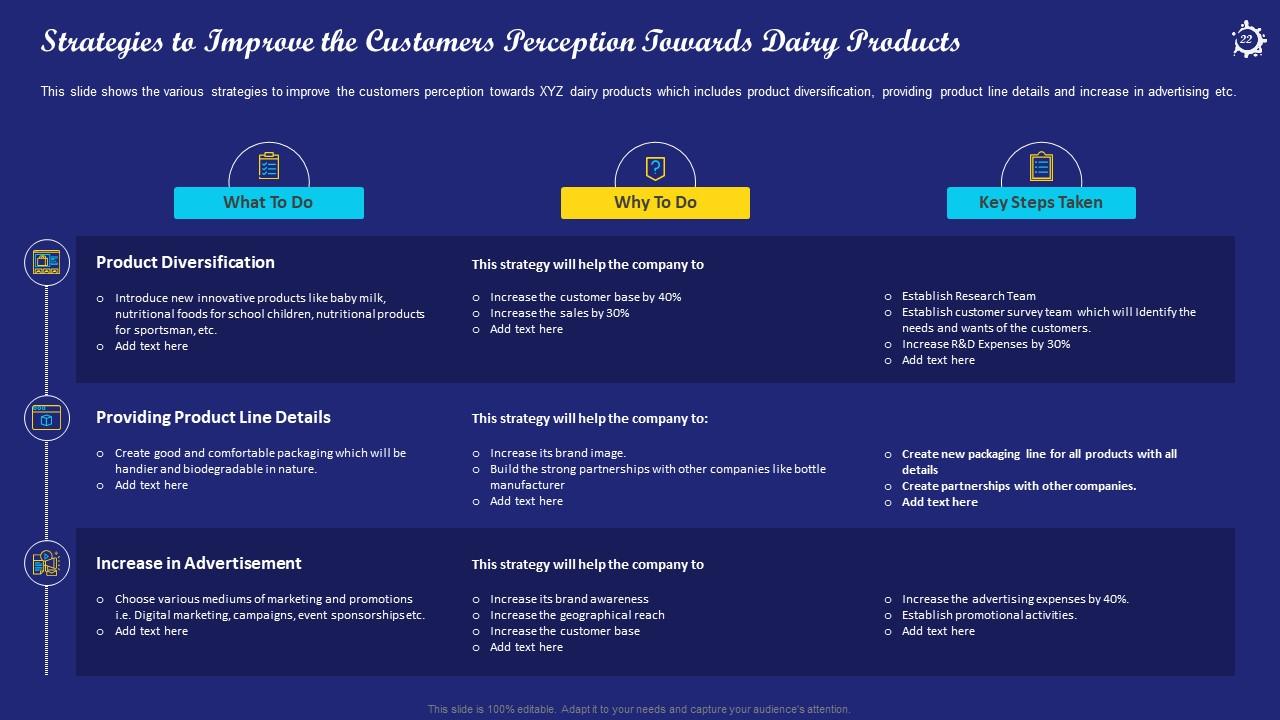
Slide 22: This slide shows the various strategies to improve the customers perception towards XYZ dairy products.
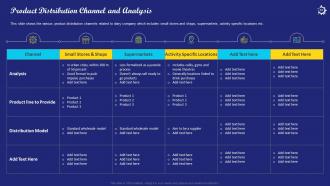
Slide 23: This slide shows the various product distribution channels related to dairy company which includes small stores & shops, supermarkets, activity specific locations etc.
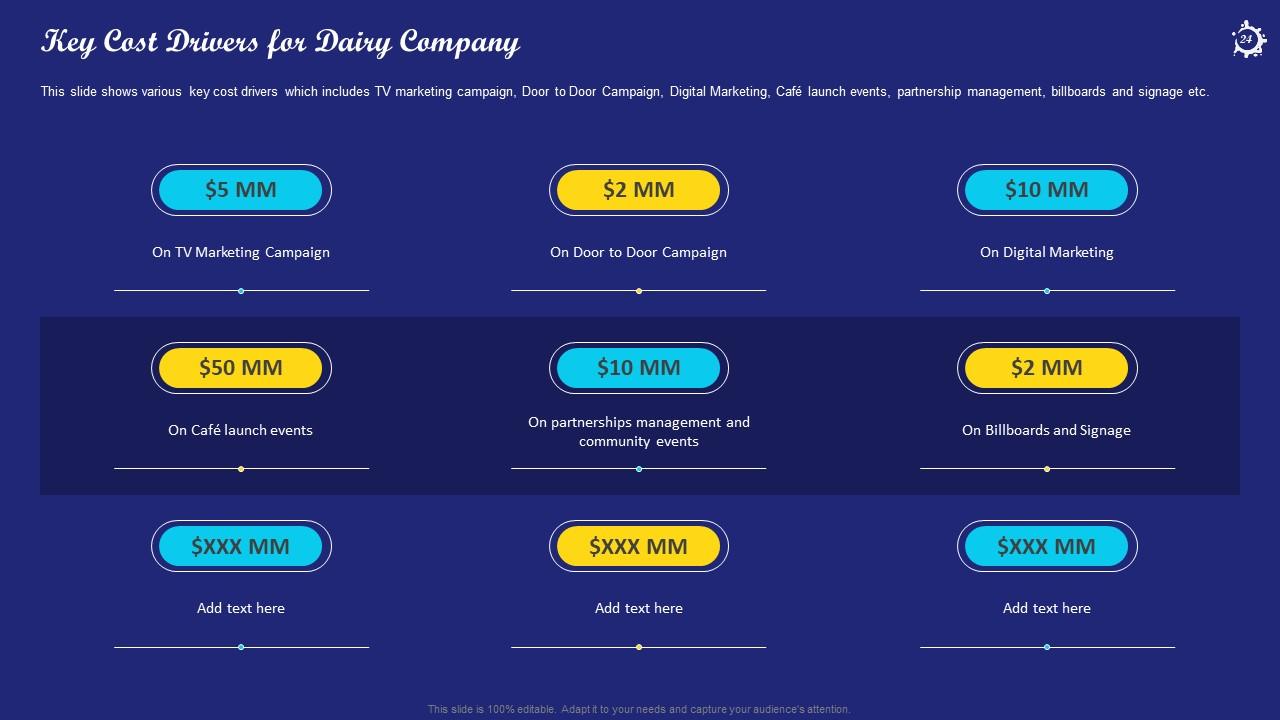
Slide 24: This slide shows various key cost drivers which includes TV marketing campaign, Door to Door Campaign, Digital Marketing, etc.
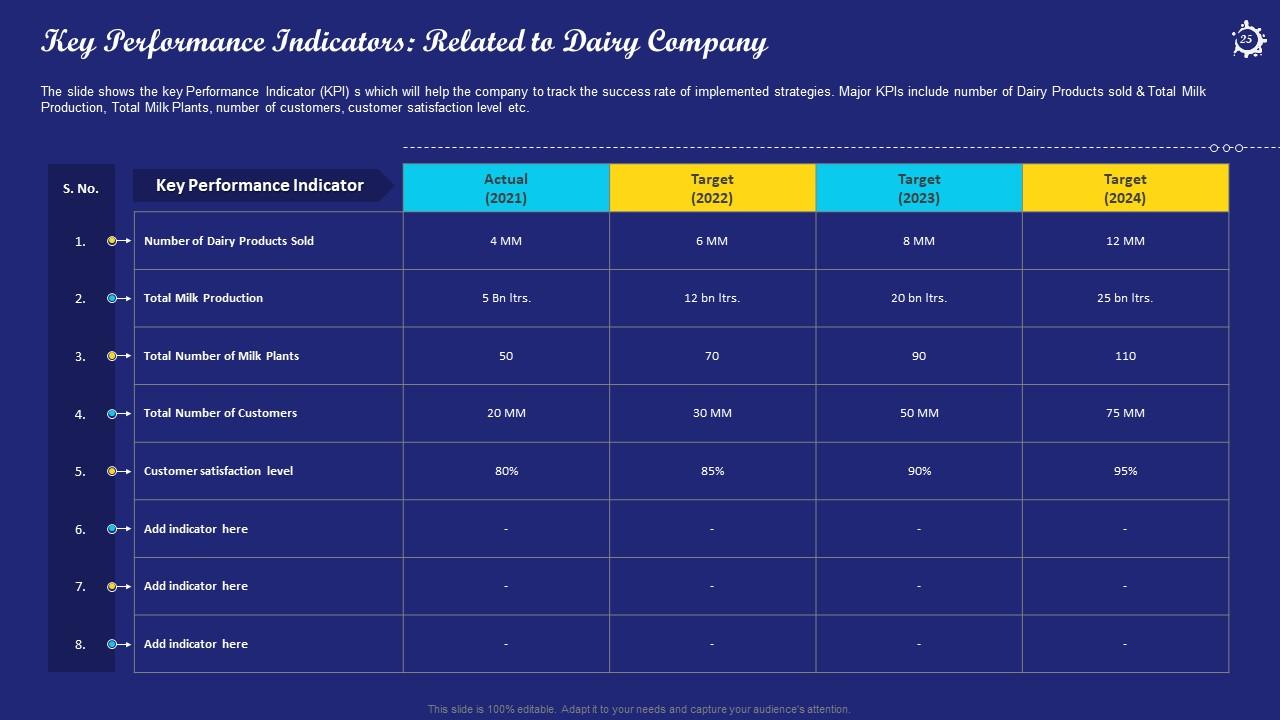
Slide 25: The slide shows the key Performance Indicator (KPI) s which will help the company to track the success rate of implemented strategies.
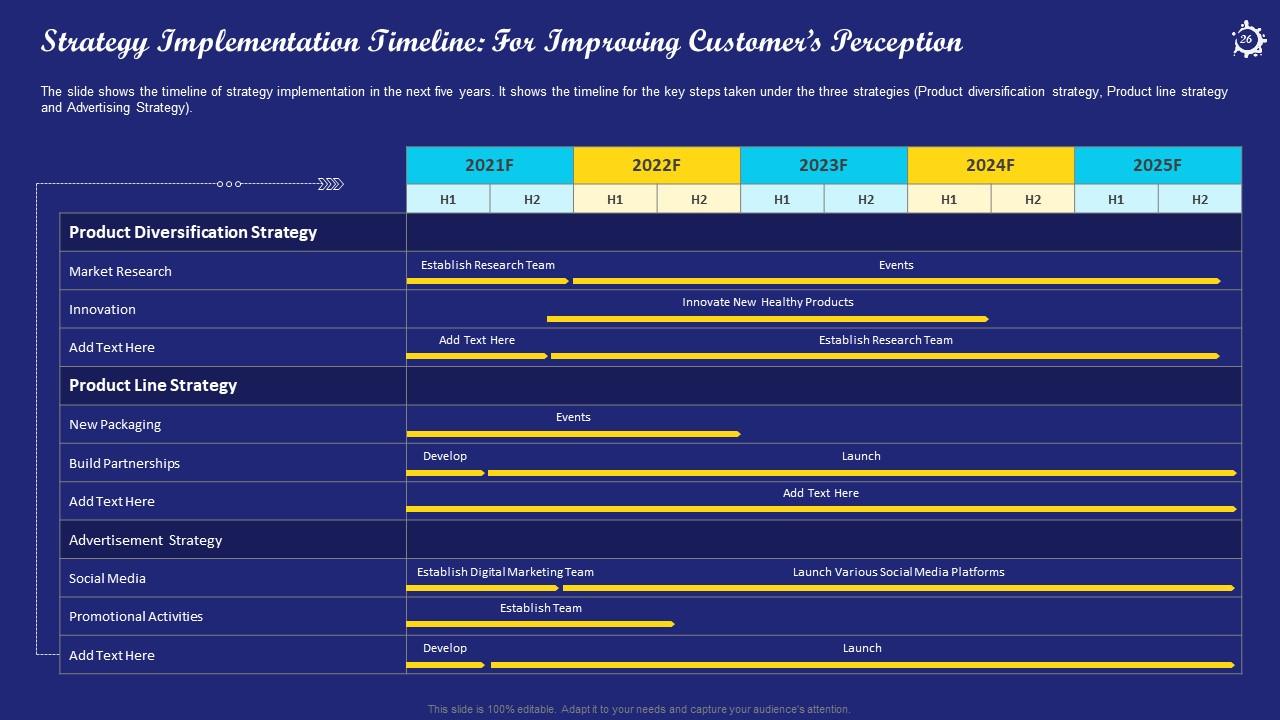
Slide 26: The slide shows the timeline of strategy implementation in the next five years.
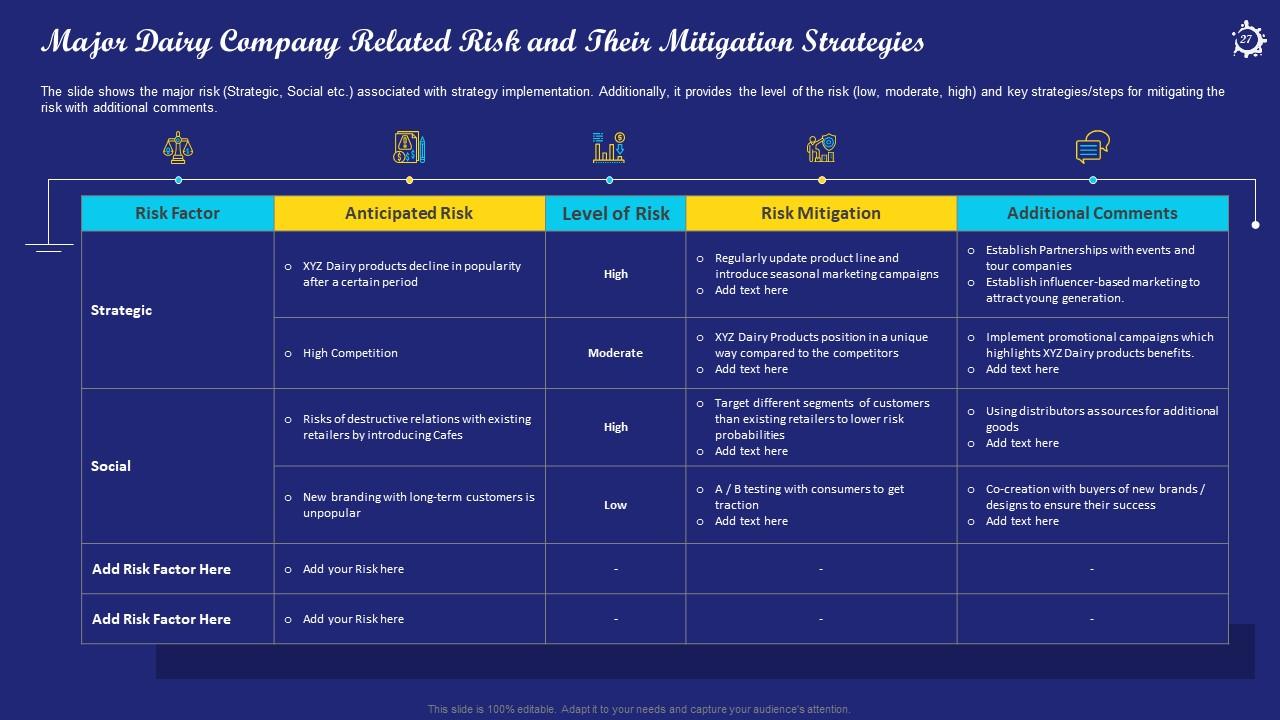
Slide 27: The slide shows the major risk (Strategic, Social etc.) associated with strategy implementation.
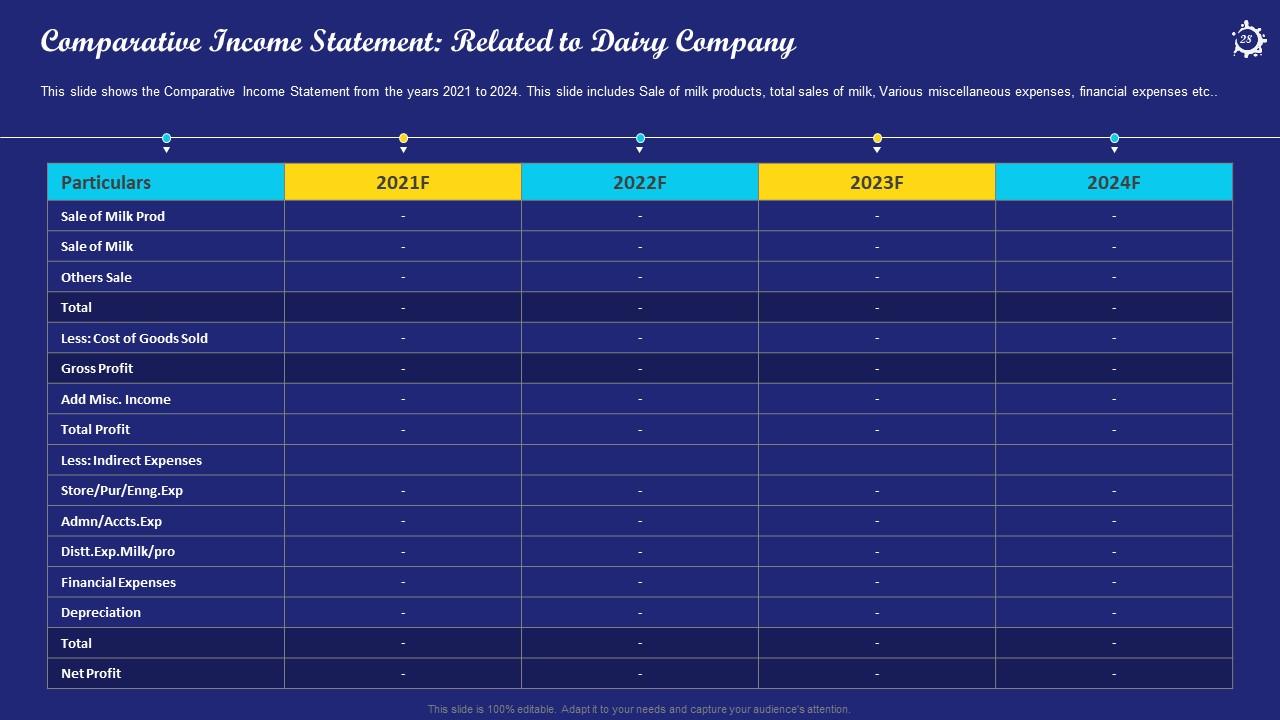
Slide 28: This slide shows the Comparative Income Statement from the years 2021 to 2024.
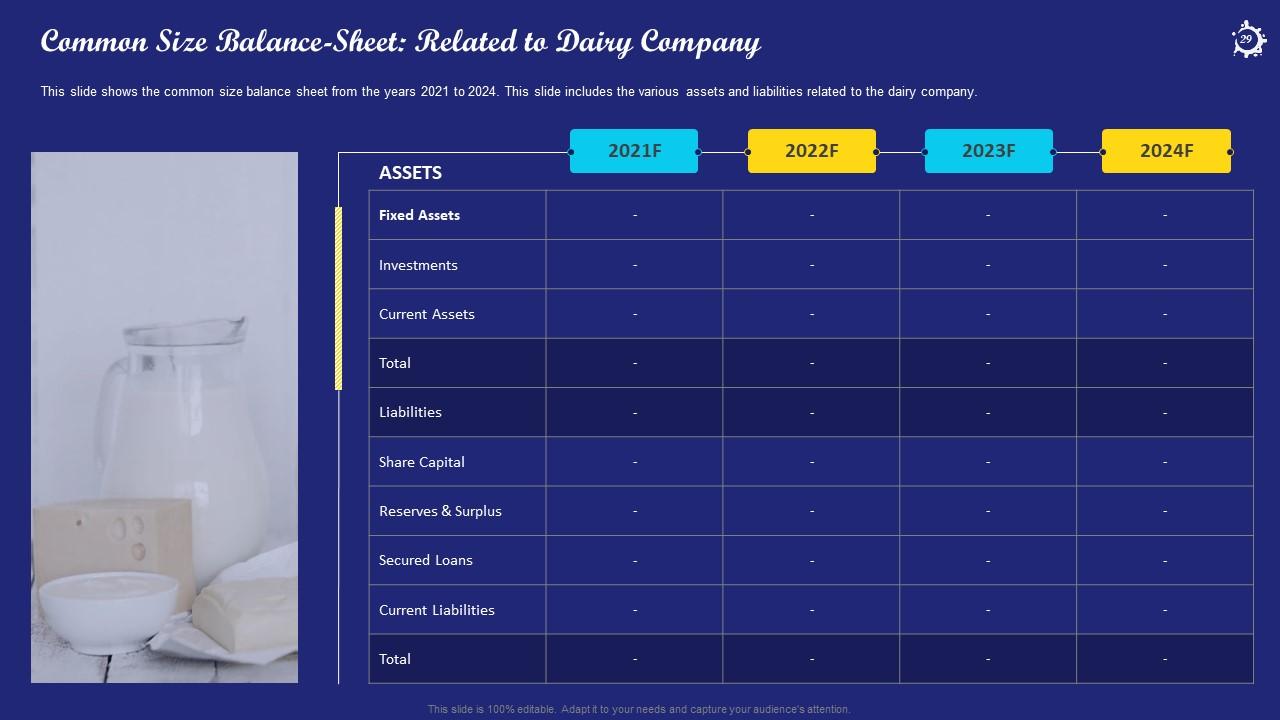
Slide 29: This slide shows the common size balance sheet from the years 2021 to 2024.
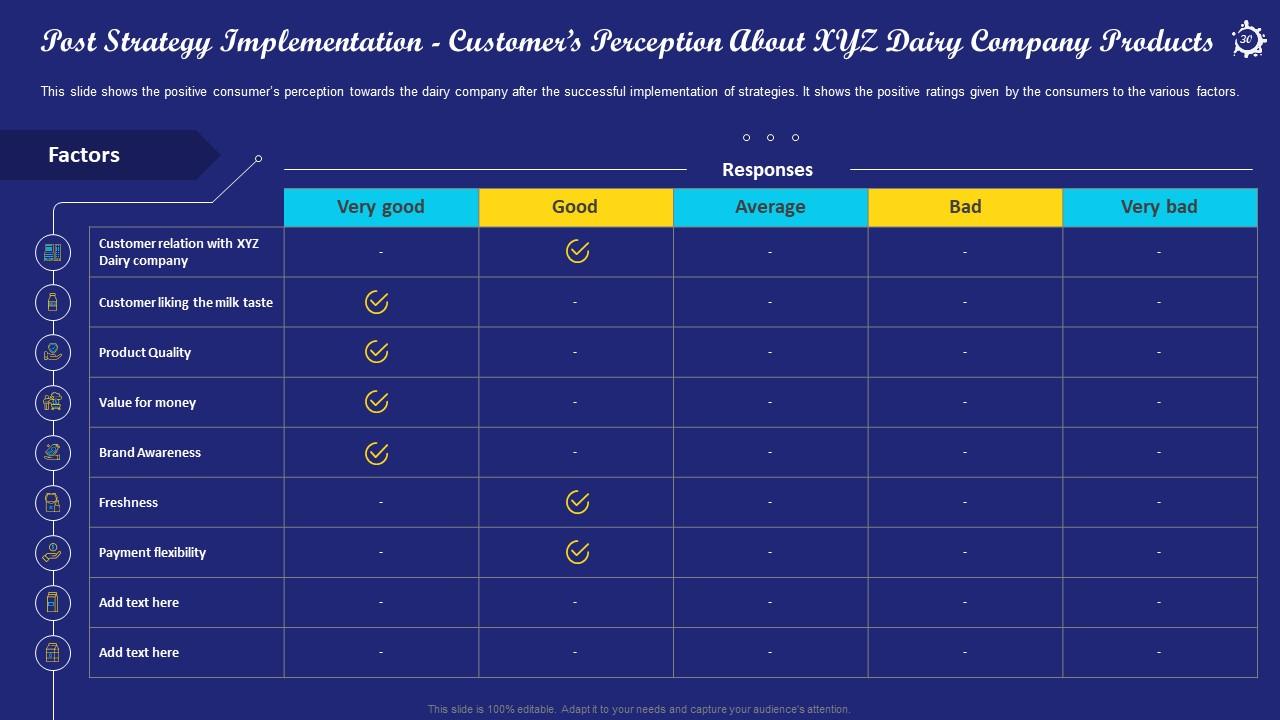
Slide 30: This slide shows the positive consumer’s perception towards the dairy company after the successful implementation of strategies.
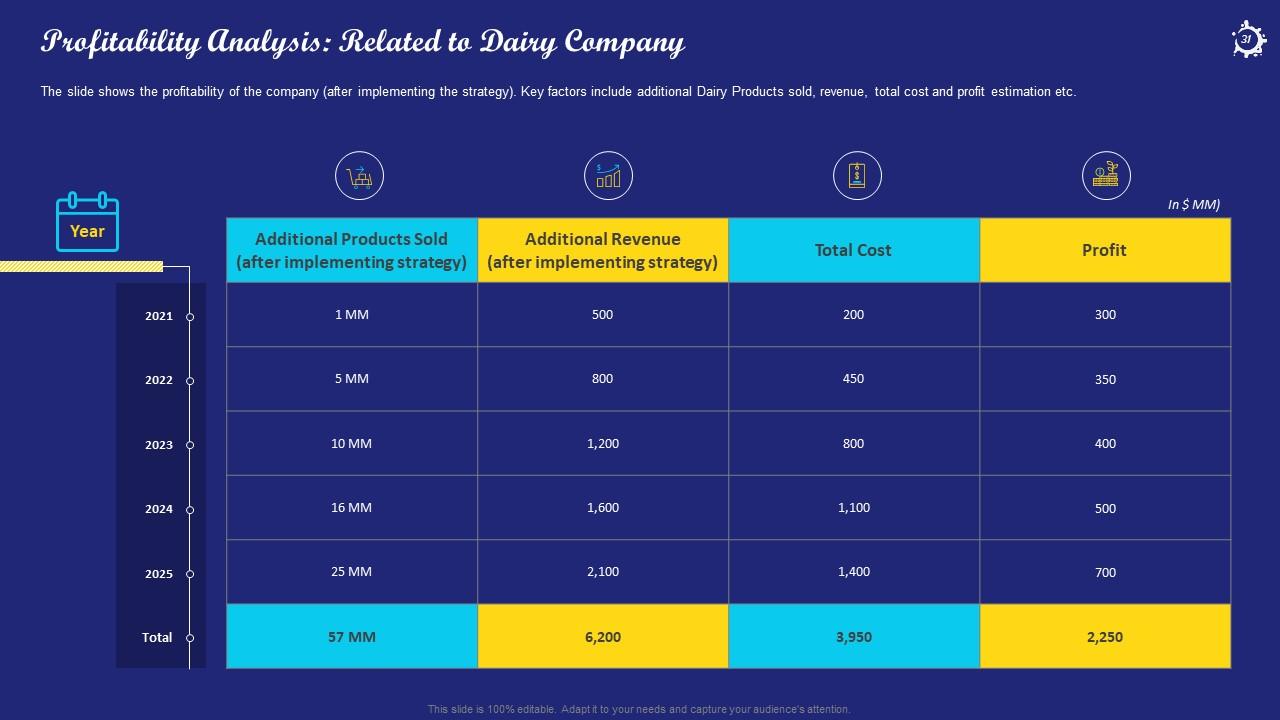
Slide 31: The slide shows the profitability of the company (after implementing the strategy).
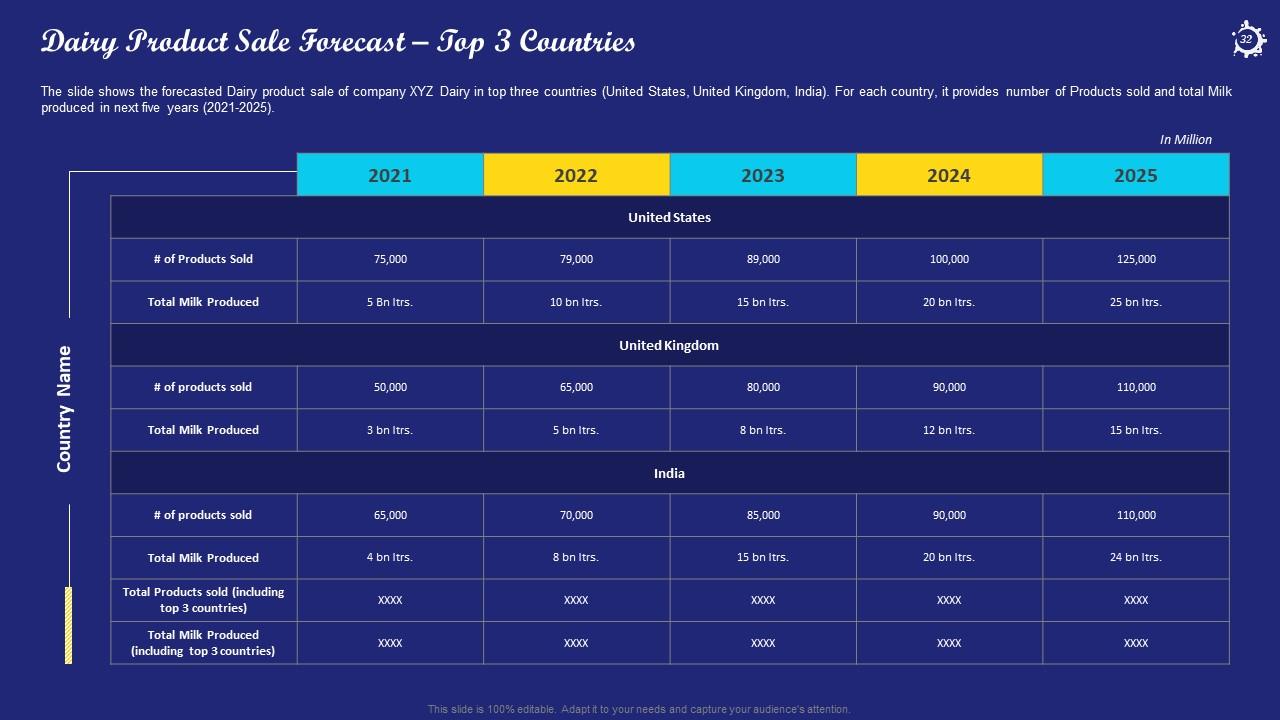
Slide 32: The slide shows the forecasted Dairy product sale of company XYZ Dairy in top three countries (United States, United Kingdom, India).
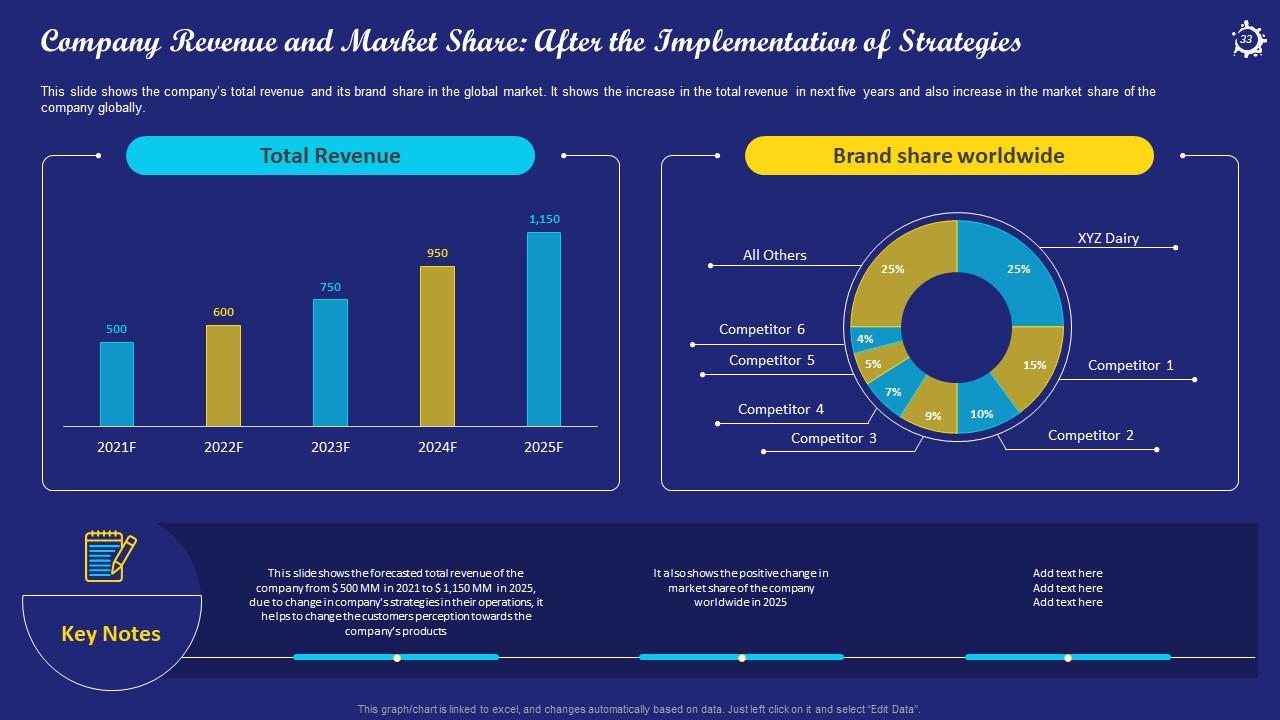
Slide 33: This slide shows the forecasted total revenue of the company from $ 500 MM in 2021 to $ 1,150 MM in 2025.
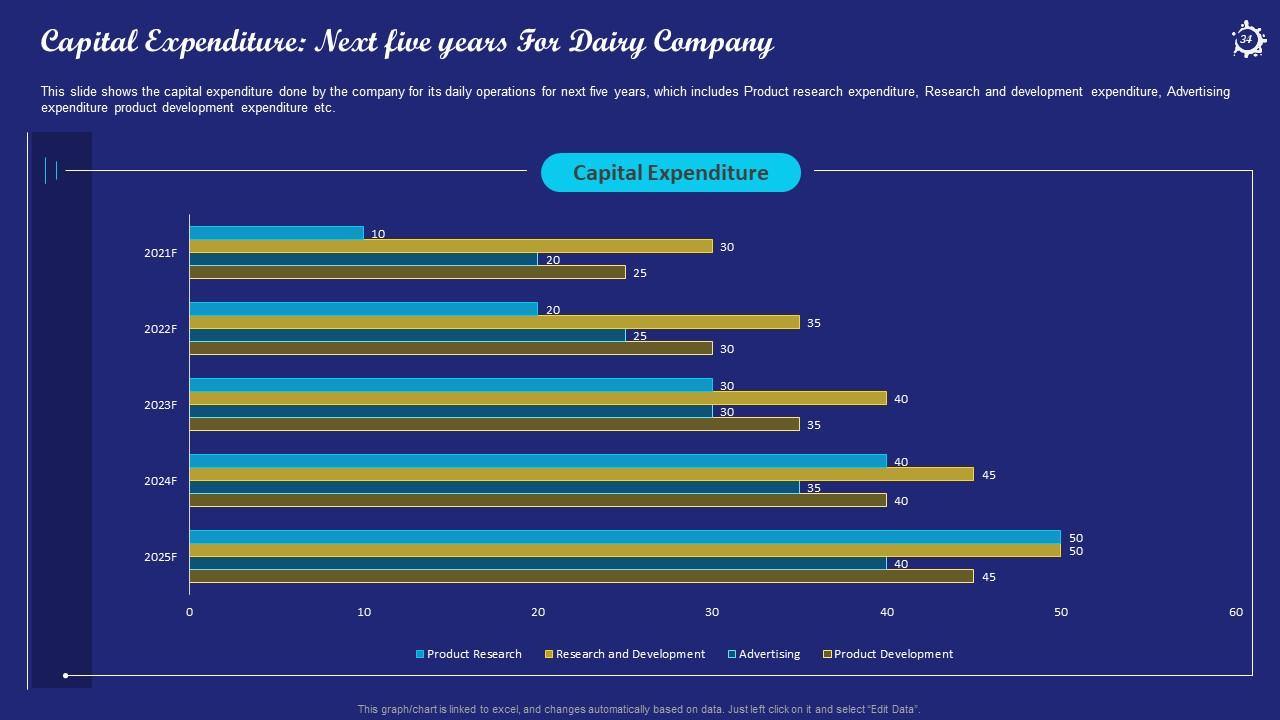
Slide 34: This slide shows the capital expenditure done by the company for its daily operations for next five years.
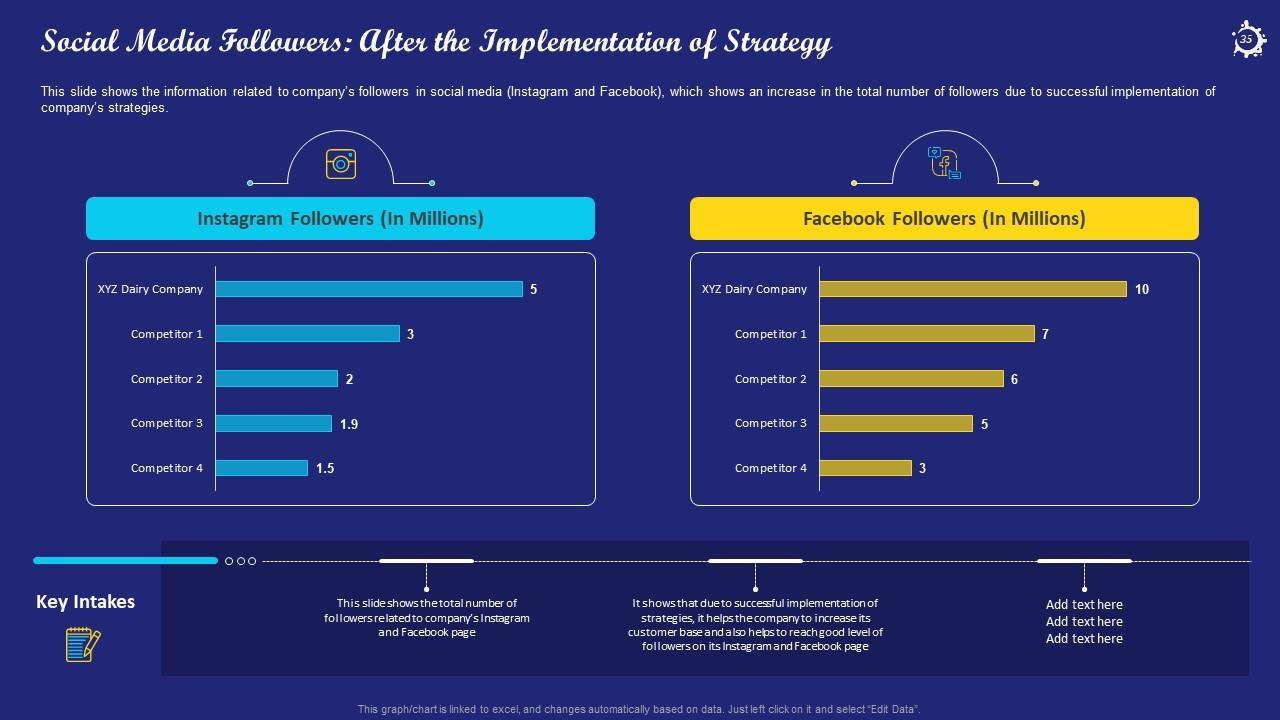
Slide 35: This slide shows the information related to company’s followers in social media (Instagram and Facebook).
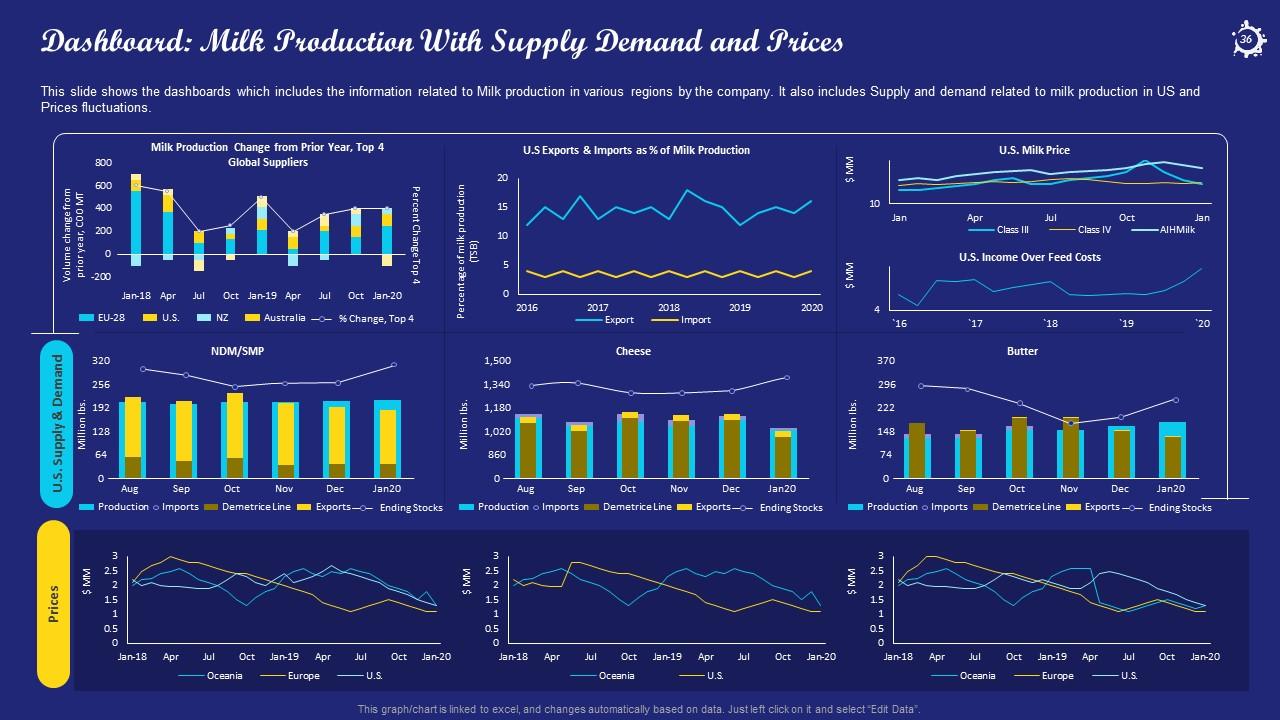
Slide 36: This slide shows the dashboards which includes the information related to Milk production in various regions by the company.
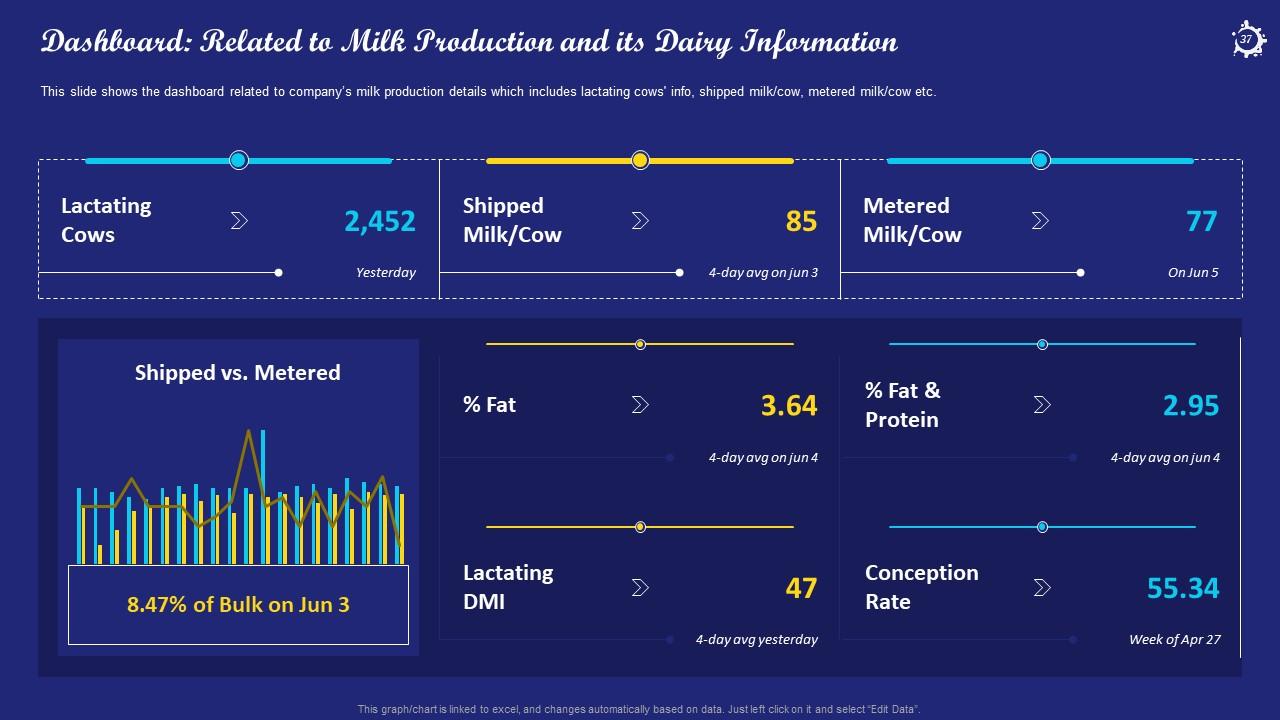
Slide 37: This slide shows the dashboard related to company’s milk production details which includes lactating cows' info, shipped milk/cow, metered milk/cow etc.
Slide 38: This is the icons slide for the project.
Slide 39: This slide displays the title for additional slides.
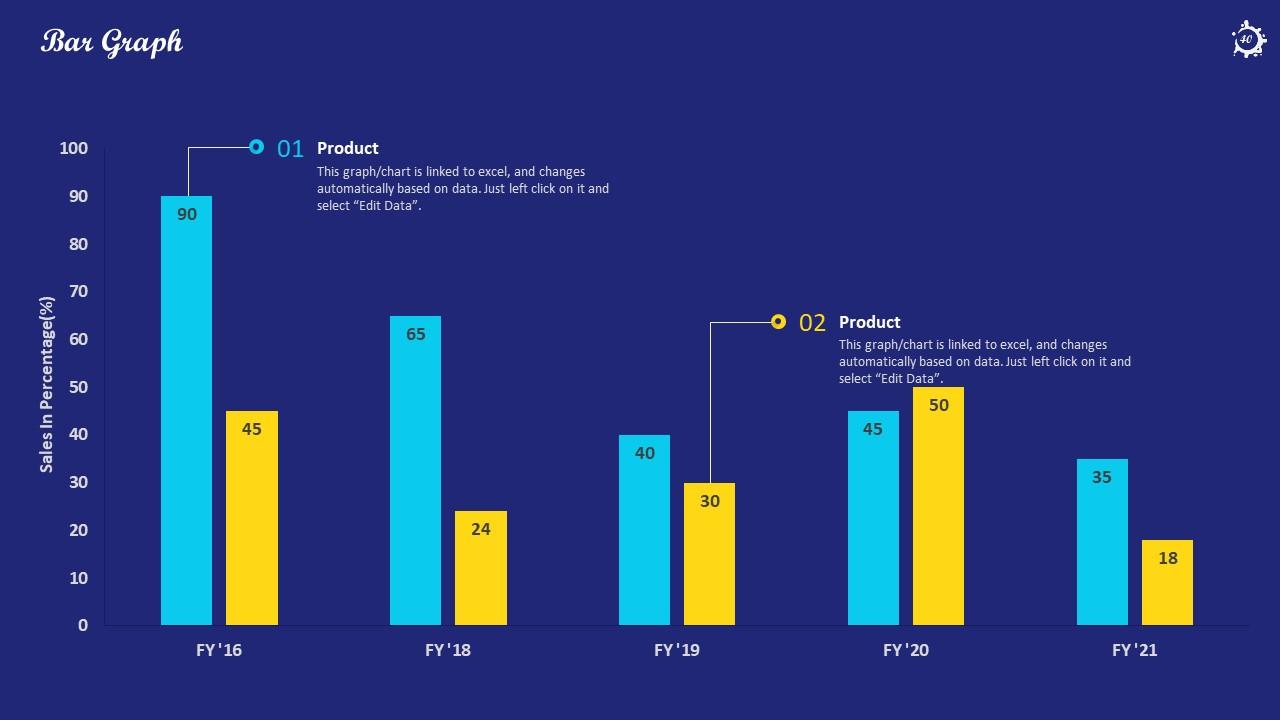
Slide 40: This slide exhibits the bar graphs for different products. The graphs are linked to Excel.
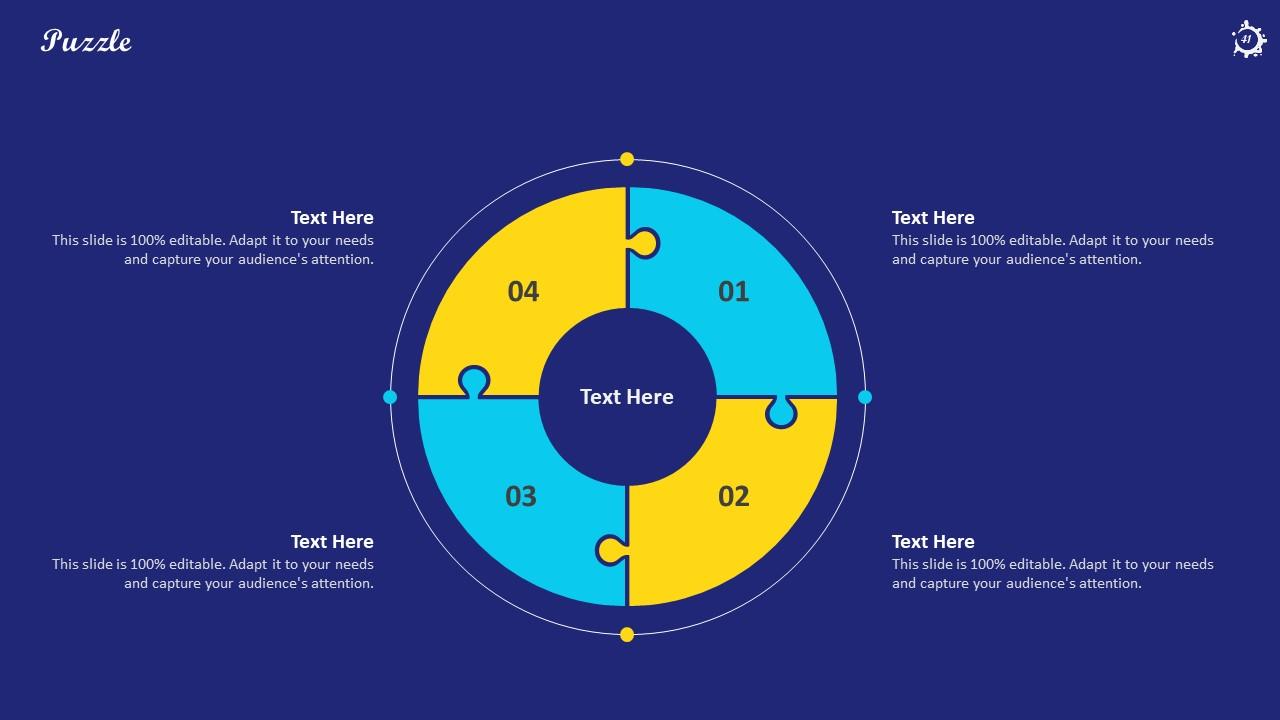
Slide 41: This slide explains the puzzle for your company.
Slide 42: This slide showcases the targets of your company.
Slide 43: This slide explains the ideas generated for your company.
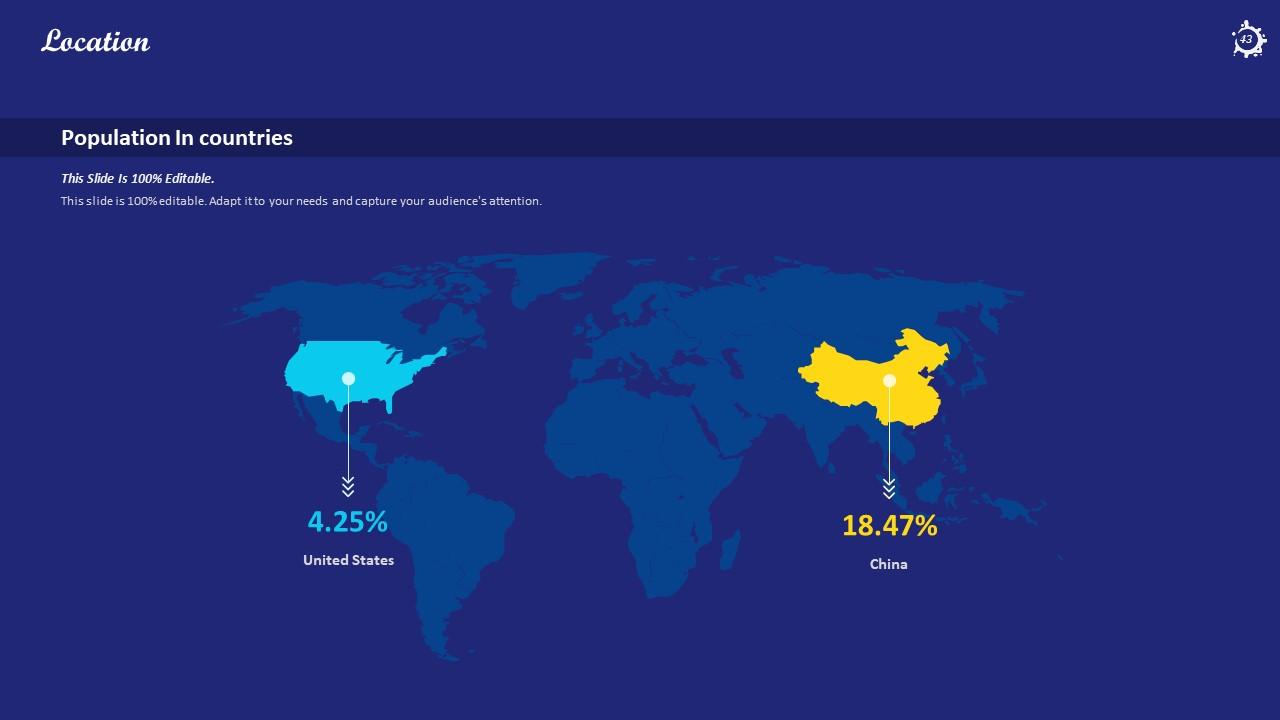
Slide 44: This slide showcases the location of your company.
Slide 45: This slide exhibits the quotes of the company.
Slide 46: This slide presents the magnifying glass of your company.
Slide 47: This slide showcases the goals of your company.
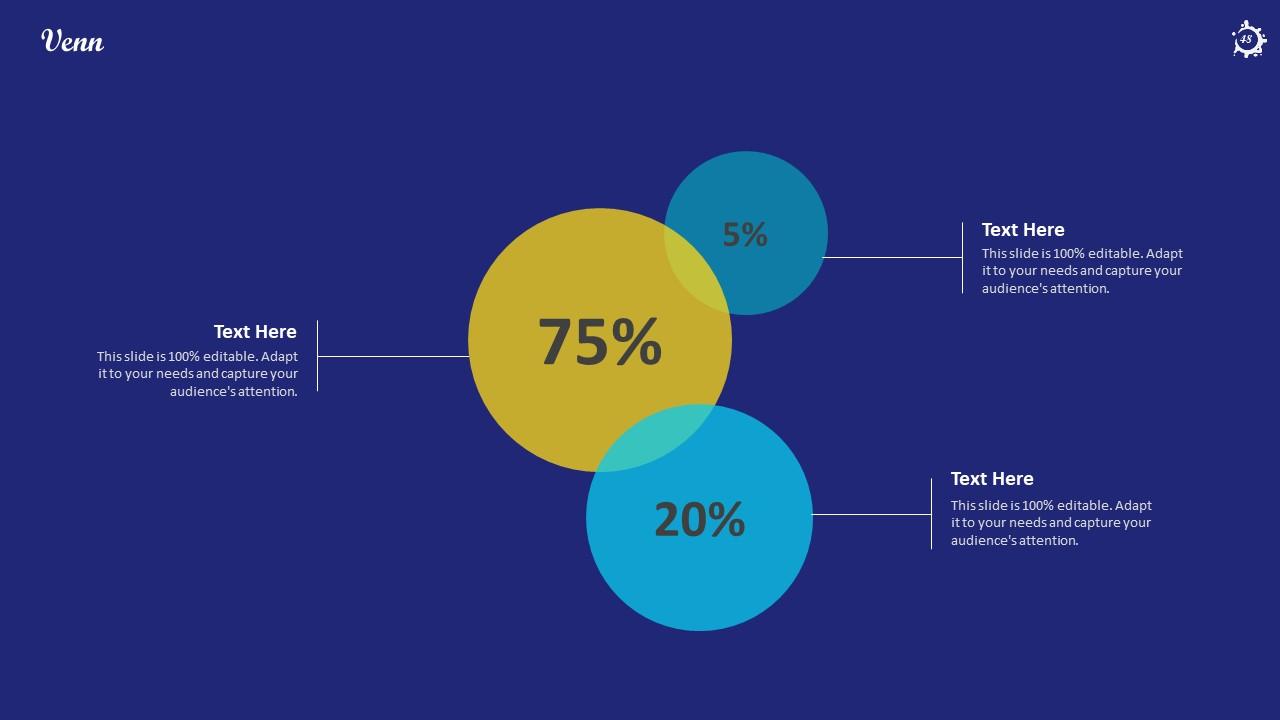
Slide 48: This slide exhibits the venn diagram for your company targets.
Slide 49: This slide presents the lego of your company.
Slide 50: This slide showcases the posts related to past experiences of clients.
Slide 51: This is the thank you slide and displays the contact details of the company i.e. office address, contact number, etc.
Improve the customers perception towards dairy products of a company case competition complete deck with all 51 slides:
Use our Improve The Customers Perception Towards Dairy Products Of A Company Case Competition Complete Deck to effectively help you save your valuable time. They are readymade to fit into any presentation structure.
-
Innovative and attractive designs.
-
Use of icon with content is very relateable, informative and appealing.
-
Use of icon with content is very relateable, informative and appealing.
-
Visually stunning presentation, love the content.
-
Great quality product.


