IT Services Company Profile Financial Comparison With Competitors Ppt Diagram
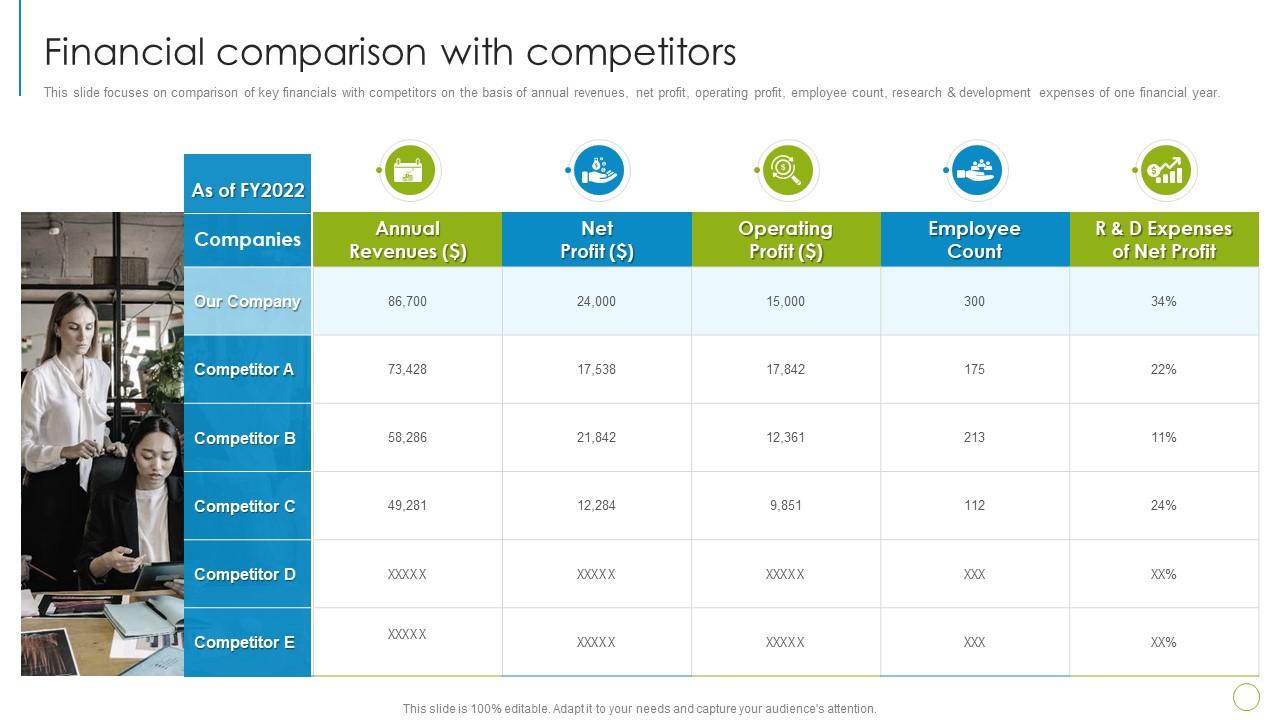
This slide focuses on comparison of key financials with competitors on the basis of annual revenues, net profit, operating profit, employee count, research and development expenses of one financial year.
- Google Slides is a new FREE Presentation software from Google.
- All our content is 100% compatible with Google Slides.
- Just download our designs, and upload them to Google Slides and they will work automatically.
- Amaze your audience with SlideTeam and Google Slides.
-
Want Changes to This PPT Slide? Check out our Presentation Design Services
- WideScreen Aspect ratio is becoming a very popular format. When you download this product, the downloaded ZIP will contain this product in both standard and widescreen format.
-

- Some older products that we have may only be in standard format, but they can easily be converted to widescreen.
- To do this, please open the SlideTeam product in Powerpoint, and go to
- Design ( On the top bar) -> Page Setup -> and select "On-screen Show (16:9)” in the drop down for "Slides Sized for".
- The slide or theme will change to widescreen, and all graphics will adjust automatically. You can similarly convert our content to any other desired screen aspect ratio.
Compatible With Google Slides

Get This In WideScreen
You must be logged in to download this presentation.
PowerPoint presentation slides
This slide focuses on comparison of key financials with competitors on the basis of annual revenues, net profit, operating profit, employee count, research and development expenses of one financial year. Introducing IT Services Company Profile Financial Comparison With Competitors Ppt Diagram to increase your presentation threshold. Encompassed with five stages, this template is a great option to educate and entice your audience. Dispence information on Annual Revenues, Operating Profit, Employee Count, using this template. Grab it now to reap its full benefits.
People who downloaded this PowerPoint presentation also viewed the following :
IT Services Company Profile Financial Comparison With Competitors Ppt Diagram with all 6 slides:
Use our IT Services Company Profile Financial Comparison With Competitors Ppt Diagram to effectively help you save your valuable time. They are readymade to fit into any presentation structure.
-
Designs have enough space to add content.
-
Informative and engaging! I really like the design and quality of the slides.


