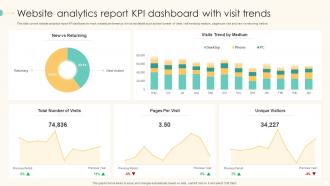
KPI Dashboard, Excel and Metrics PPT Templates
-
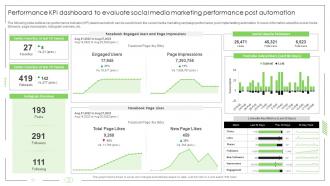 Performance KPI Dashboard To Evaluate Social Media Marketing Performance Post Automation
The following slide outlines key performance indicator KPI dashboard which can be used to track the social media marketing campaign performance, post implementing automation. It covers information about the social media followers, page impressions, instagram overview, etc.Deliver an outstanding presentation on the topic using this Performance KPI Dashboard To Evaluate Social Media Marketing Performance Post Automation. Dispense information and present a thorough explanation of Twitter Favorites, Instagram Overview, Media Followers using the slides given. This template can be altered and personalized to fit your needs. It is also available for immediate download. So grab it now.
-
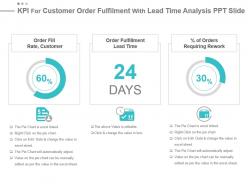 Kpi for customer order fulfilment with lead time analysis ppt slide
Presenting kpi for customer order fulfilment with lead time analysis ppt slide. This presentation slide shows three Key Performance Indicators or KPIs. The first KPI that can be show is Order Fill Rate, Customer. The second KPI is Order Fulfillment Lead Time and the third is percentage of Orders Requiring Rework. These KPI Powerpoint graphics are all data driven, and the shape automatically adjusts according to your data. Just right click on the KPI graphic, enter the right value and the shape will adjust automatically. Make a visual impact with our KPI slides.
-
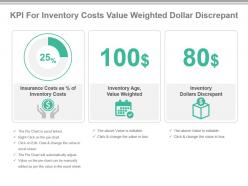 Kpi for inventory costs value weighted dollar discrepant ppt slide
Presenting kpi for inventory costs value weighted dollar discrepant ppt slide. This presentation slide shows Three Key Performance Indicators or KPIs in a Dashboard style design. The first KPI that can be shown is Insurance Costs as Percentage of Inventory Costs. The second KPI is Inventory Age, Value Weighted. The third is Inventory Dollars Discrepant. These KPI Powerpoint graphics are all data driven, and the shape automatically adjusts according to your data. Just right click on the KPI graphic, enter the right value and the shape will adjust automatically. Make a visual impact with our KPI slides.
-
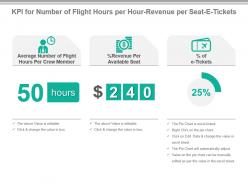 Kpi for number of flight hours per hour revenue per seat e tickets powerpoint slide
Presenting kpi for number of flight hours per hour revenue per seat e tickets powerpoint slide. This presentation slide shows Three Key Performance Indicators or KPIs in a Dashboard style design. The first KPI that can be shown is Average Number of Flight Hours Per Crew Member. The second KPI is Percentage Revenue Per Available Seat. The third is Percentage of e Tickets. These KPI Powerpoint graphics are all data driven, and the shape automatically adjusts according to your data. Just right click on the KPI graphic, enter the right value and the shape will adjust automatically. Make a visual impact with our KPI slides.
-
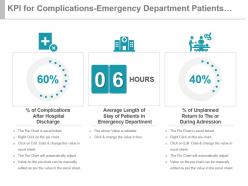 Kpi for complications emergency department patients unplanned return powerpoint slide
Presenting kpi for complications emergency department patients unplanned return powerpoint slide. This presentation slide shows three Key Performance Indicators or KPIs in a Dashboard style design. The first KPI that can be shown is Percentage of Complications After Hospital Discharge. The second KPI is Average Length of Stay of Patients in Emergency Department and the third is percentage of Unplanned Return to The or During Admission. These KPI Powerpoint graphics are all data driven, and the shape automatically adjusts according to your data. Just right click on the KPI graphic, enter the right value and the shape will adjust automatically. Make a visual impact with our KPI slides.
-
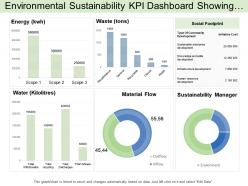 Environmental sustainability kpi dashboard showing social footprint and supply chain category
Presenting this set of slides with name - Environmental Sustainability Kpi Dashboard Showing Social Footprint And Supply Chain Category. This is a six stage process. The stages in this process are Environment Sustainability, Environment Continual, Environment Feasibility.
-
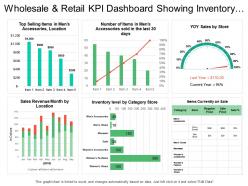 Wholesale and retail kpi dashboard showing inventory level by category sales revenue month
Presenting the retail business slide for PowerPoint. This presentation template is 100% modifiable in PowerPoint and is designed by professionals. You can edit the objects in the slide like font size and font color very easily. This presentation slide is fully compatible with Google Slide and can be saved in JPG or PDF file format without any fuss. Click on the download button to download this template in no time.
-
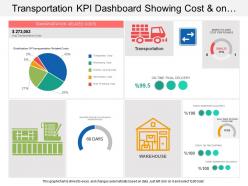 Transportation kpi dashboard showing cost and on time final delivery
Presenting transportation KPI dashboard showing cost and on time final delivery PPT slide. This deck offers you plenty of space to put in titles and sub titles. This template is Excel linked just right click to input your information. High resolution based layout, does not change the image even after resizing. This presentation icon is fully compatible with Google slides. Quick downloading speed and simple editing options in color text and fonts.PPT icons can easily be changed into JPEG and PDF applications.
-
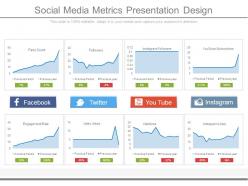 Social media metrics presentation design
Presenting social media metrics presentation design. This is a social media metrics presentation design. This is a eight stage process. The stages in this process are fans count, followers, subscriber, facebook, twitter, youtube, instagram.
-
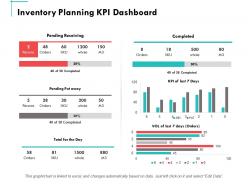 Inventory planning kpi dashboard ppt powerpoint presentation summary graphics
Presenting this set of slides with name - Inventory Planning Kpi Dashboard Ppt Powerpoint Presentation Summary Graphics. This is a four stages process. The stages in this process are Finance, Marketing, Management, Investment, Analysis.
-
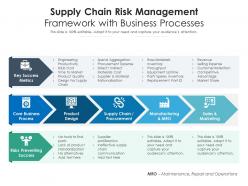 Supply chain risk management framework with business processes
Introducing our Supply Chain Risk Management Framework With Business Processes set of slides. The topics discussed in these slides are Key Success Metrics, Core Business Process, Risks Preventing Success. This is an immediately available PowerPoint presentation that can be conveniently customized. Download it and convince your audience.
-
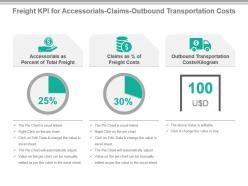 Freight kpi for accessorials claims outbound transportation costs presentation slide
Presenting freight kpi for accessorials claims outbound transportation costs presentation slide. This presentation slide shows three Key Performance Indicators or KPIs in a Dashboard style design. The first KPI that can be shown is Accessorials as Percent of Total Freight. The second KPI is Claims as percentage of Freight Costs and the third is Outbound Transportation Costs Kilogram. These KPI Powerpoint graphics are all data driven, and the shape automatically adjusts according to your data. Just right click on the KPI graphic, enter the right value and the shape will adjust automatically. Make a visual impact with our KPI slides.
-
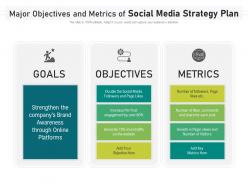 Major objectives and metrics of social media strategy plan
Introducing our premium set of slides with Major Objectives And Metrics Of Social Media Strategy Plan. Elucidate the three stages and present information using this PPT slide. This is a completely adaptable PowerPoint template design that can be used to interpret topics like Major Objectives, Metrics Social, Media Strategy Plan. So download instantly and tailor it with your information.
-
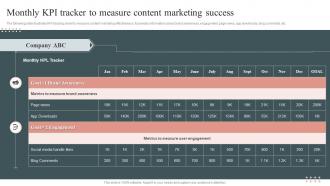 Monthly KPI Tracker To Measure Content Marketing Success
The following slide illustrates KPI tracking sheet to measure content marketing effectiveness. It provides information about brand awareness, engagement, page views, app downloads, blog comments, etc. Presenting our well structured Monthly KPI Tracker To Measure Content Marketing Success. The topics discussed in this slide are Social Media Handle, Metrics To Measure, Marketing Success. This is an instantly available PowerPoint presentation that can be edited conveniently. Download it right away and captivate your audience.
-
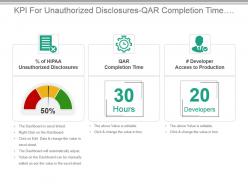 Kpi for unauthorized disclosures qar completion time production access presentation slide
Presenting kpi for unauthorized disclosures qar completion time production access presentation slide. This presentation slide shows three Key Performance Indicators or KPIs in a Dashboard style design. The first KPI that can be shown is percentage of HIPAA Unauthorized Disclosures. The second KPI is QAR Completion Time and the third is Developer Access to Production. These KPI Powerpoint graphics are all data driven,and the shape automatically adjusts according to your data. Just right click on the KPI graphic,enter the right value and the shape will adjust automatically. Make a visual impact with our KPI slides.
-
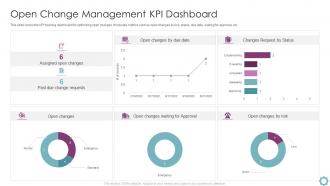 Open Change Management KPI Dashboard
This slide covers the KPI tracking dashboard for optimizing open changes. It includes metrics such as open changes by risk,status,due date,waiting for approval,etc. Introducing our Open Change Management KPI Dashboard set of slides. The topics discussed in these slides are Changes Request Status,Assigned Open Changes,Past Due,Change Requests. This is an immediately available PowerPoint presentation that can be conveniently customized. Download it and convince your audience.
-
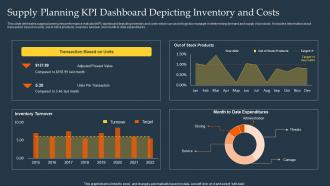 Supply Planning KPI Dashboard Depicting Inventory And Costs
This slide delineates supply planning key performance indicator KPI dashboard depicting inventory and costs which can assist logistics manager in determining demand and supply of products. It includes information about transaction based on units, out of stock products, inventory turnover and month to date expenditures. Presenting our well-structured Supply Planning KPI Dashboard Depicting Inventory And Costs. The topics discussed in this slide are Supply Planning, KPI Dashboard, Depicting Inventory, Costs. This is an instantly available PowerPoint presentation that can be edited conveniently. Download it right away and captivate your audience.
-
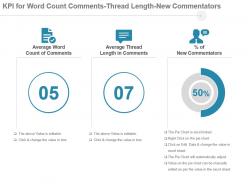 Kpi For Word Count Comments Thread Length New Commentators Powerpoint Slide
Presenting kpi for word count comments thread length new commentators powerpoint slide. This presentation slide shows Three Key Performance Indicators or KPIs in a Dashboard style design. The first KPI that can be shown is Average Word Count of Comments. The second KPI is Average Thread Length in Comments. The third is Percentage of New Commentators. These KPI Powerpoint graphics are all data driven, and the shape automatically adjusts according to your data. Just right click on the KPI graphic, enter the right value and the shape will adjust automatically. Make a visual impact with our KPI slides.
-
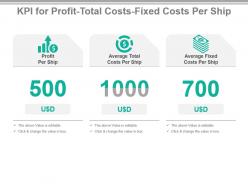 Kpi for profit total costs fixed costs per ship ppt slide
Presenting kpi for profit total costs fixed costs per ship ppt slide. This presentation slide shows three Key Performance Indicators or KPIs in a Dashboard style design. The first KPI that can be shown is Profit Per Ship. The second KPI is Average Total Costs Per Ship and the third is Average Fixed Costs Per Ship. These KPI Powerpoint graphics are all data driven, and the shape automatically adjusts according to your data. Just right click on the KPI graphic, enter the right value and the shape will adjust automatically. Make a visual impact with our KPI slides.
-
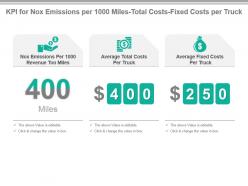 Kpi for nox emissions per 1000 miles total costs fixed costs per truck presentation slide
Presenting kpi for nox emissions per 1000 miles total costs fixed costs per truck presentation slide. This presentation slide shows Three Key Performance Indicators or KPIs in a Dashboard style design. The first KPI that can be shown is Nox Emissions Per 1000 Revenue Ton Miles. The second KPI is Average Total Costs Per Truck. The third is Average Fixed Costs Per Truck. These KPI Powerpoint graphics are all data driven, and the shape automatically adjusts according to your data. Just right click on the KPI graphic, enter the right value and the shape will adjust automatically. Make a visual impact with our KPI slides.
-
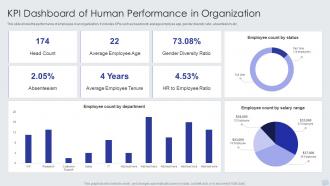 KPI Dashboard Of Human Performance In Organization
This slide shows the performance of employees in an organization. It includes KPIs such as headcount, average employee age, gender diversity ratio, absenteeism, etc. Introducing our KPI Dashboard Of Human Performance In Organization set of slides. The topics discussed in these slides are Head Count, Average Employee Age, Gender Diversity Ratio. This is an immediately available PowerPoint presentation that can be conveniently customized. Download it and convince your audience.
-
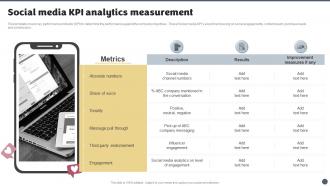 Social Media Brand Marketing Playbook Social Media KPI Analytics Measurement
This template covers key performance indicator KPI to determine the performance against the company objectives. These Social media KPIs would be focusing on social engagements, content reach, purchase leads and conversions. Introducing Social Media Brand Marketing Playbook Social Media KPI Analytics Measurement to increase your presentation threshold. Encompassed with three stages, this template is a great option to educate and entice your audience. Dispence information on Metrics, Absolute Numbers, Message Pull Through, Third Party Endorsement, using this template. Grab it now to reap its full benefits.
-
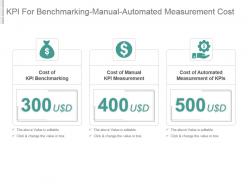 Kpi for benchmarking manual automated measurement cost presentation slide
Presenting kpi for benchmarking manual automated measurement cost presentation slide. This presentation slide shows three Key Performance Indicators or KPIs in a Dashboard style design. The first KPI that can be shown is Cost of KPI Benchmarking. The second KPI is Cost of Manual KPI Measurement and the third is Cost of Automated Measurement of KPIs. These KPI Powerpoint graphics are all data driven, and the shape automatically adjusts according to your data. Just right click on the KPI graphic, enter the right value and the shape will adjust automatically. Make a visual impact with our KPI slides.
-
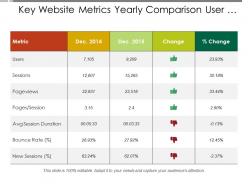 Key website metrics yearly comparison user session and bounce rate
Presenting this set of slides with name - Key Website Metrics Yearly Comparison User Session And Bounce Rate. This is a four stage process. The stages in this process are Differentiation, Comparison, Compare.
-
 Inventory kpis dashboard snapshot icon with metrics
Presenting our set of slides with Inventory KPIS Dashboard Snapshot Icon With Metrics. This exhibits information on four stages of the process. This is an easy to edit and innovatively designed PowerPoint template. So download immediately and highlight information on Inventory KPIS Dashboard Icon With Metrics.
-
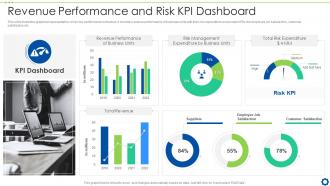 Revenue Performance And Risk KPI Dashboard Snapshot
This slide illustrates graphical representation of risk key performance indicators. It includes revenue performance of business units with their risk expenditure and people KRIs like employee job satisfaction, customer satisfaction etc. Introducing our Revenue Performance And Risk KPI Dashboard set of slides. The topics discussed in these slides are KPI Dashboard, Revenue Performance of Business Units, Risk Management Expenditure by Business Units. This is an immediately available PowerPoint presentation that can be conveniently customized. Download it and convince your audience.
-
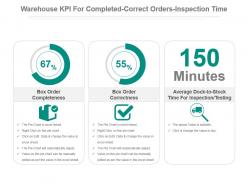 Warehouse kpi for completed correct orders inspection time ppt slide
Presenting warehouse kpi for completed correct orders inspection time ppt slide. This presentation slide shows Three Key Performance Indicators or KPIs in a Dashboard style design. The first KPI that can be shown is Box Order Completeness. The second KPI is Box Order Correctness. The third is Average Dock to Stock Time For Inspection Testing. These KPI Powerpoint graphics are all data driven, and the shape automatically adjusts according to your data. Just right click on the KPI graphic, enter the right value and the shape will adjust automatically. Make a visual impact with our KPI slides.
-
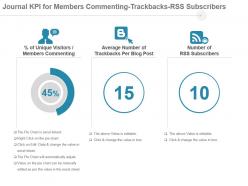 Journal Kpi For Members Commenting Trackbacks Rss Subscribers Presentation Slide
Presenting journal kpi for members commenting trackbacks rss subscribers presentation slide. This presentation slide shows Three Key Performance Indicators or KPIs in a Dashboard style design. The first KPI that can be shown is Percentage of Unique Visitors Members Commenting. The second KPI is Average Number of Trackbacks Per Blog Post. The third is Number of RSS Subscribers. These KPI Powerpoint graphics are all data driven, and the shape automatically adjusts according to your data. Just right click on the KPI graphic, enter the right value and the shape will adjust automatically. Make a visual impact with our KPI slides.
-
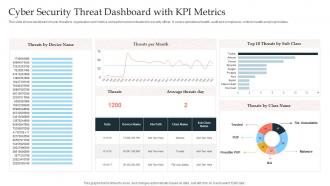 Cyber Security Threat Dashboard With KPI Metrics
This slide shows dashboard of cyber threats to organization and metrics and performance indicators for security officer. It covers operational health, audit and compliance, controls health and project status. Introducing our Cyber Security Threat Dashboard With KPI Metrics set of slides. The topics discussed in these slides are Cyber Security Threat, Dashboard, KPI Metrics. This is an immediately available PowerPoint presentation that can be conveniently customized. Download it and convince your audience.
-
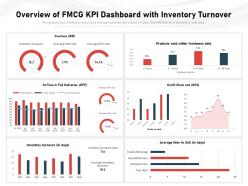 Overview of fmcg kpi dashboard with inventory turnover
Presenting this set of slides with name Overview Of FMCG KPI Dashboard With Inventory Turnover. The topics discussed in these slides are Product, Stock, Average Time. This is a completely editable PowerPoint presentation and is available for immediate download. Download now and impress your audience.
-
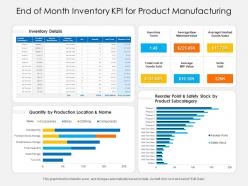 End of month inventory kpi for product manufacturing
Presenting this set of slides with name End Of Month Inventory KPI For Product Manufacturing. The topics discussed in these slides are Inventory, Value, Cost. This is a completely editable PowerPoint presentation and is available for immediate download. Download now and impress your audience.
-
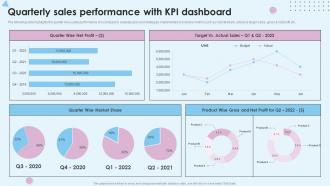 Quarterly Sales Performance With KPI Dashboard
The following slide highlights the quarter wise sales performance of a company to evaluate plan and strategies implemented. It includes metrics such as market share, actual vs target sales, gross and net profit etc. Introducing our Quarterly Sales Performance With KPI Dashboard set of slides. The topics discussed in these slides are Quarterly Sales Performance, KPI Dashboard. This is an immediately available PowerPoint presentation that can be conveniently customized. Download it and convince your audience.
-
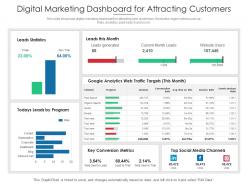 Digital marketing dashboard for attracting customers
This slide showcase digital marketing dashboard for attracting new customers. It includes major metrics such as- trials, analytics, paid search and so on. Introducing our Digital Marketing Dashboard For Attracting Customers set of slides. The topics discussed in these slides are Leads Statistics, Key Conversion Metrics, Social Media Channels. This is an immediately available PowerPoint presentation that can be conveniently customized. Download it and convince your audience.
-
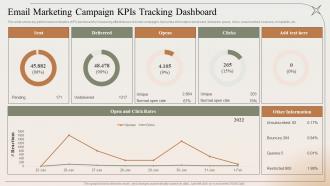 Email Marketing Campaign Kpis Tracking Dashboard Snapshot
This slide shows key performance indicators KPI dashboard snapshot for measuring effectiveness of email campaigns. It provides information about sent, delivered, opens, clicks, unsubscribed, bounces, complaints, etc. Introducing our Email Marketing Campaign KPIS Tracking Dashboard set of slides. The topics discussed in these slides are Delivered, Sent, Opens, Clicks. This is an immediately available PowerPoint presentation that can be conveniently customized. Download it and convince your audience.
-
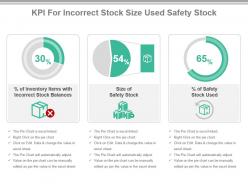 Kpi for incorrect stock size used safety stock presentation slide
Presenting kpi for incorrect stock size used safety stock presentation slide. This presentation slide shows Three Key Performance Indicators or KPIs in a Dashboard style design. The first KPI that can be shown is Percentage of Inventory Items with Incorrect Stock Balances. The second KPI is Size of Safety Stock. The third is Percentage of Safety Stock Used.These KPI Powerpoint graphics are all data driven, and the shape automatically adjusts according to your data. Just right click on the KPI graphic, enter the right value and the shape will adjust automatically. Make a visual impact with our KPI slides.
-
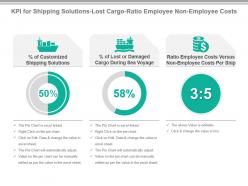 Kpi for shipping solutions lost cargo ratio employee non employee costs ppt slide
Presenting kpi for shipping solutions lost cargo ratio employee non employee costs ppt slide. This presentation slide shows three Key Performance Indicators or KPIs in a Dashboard style design. The first KPI that can be shown is percentage of Customized Shipping Solutions. The second KPI is percentage of Lost or Damaged Cargo During Sea Voyage and the third is Ratio Employee Costs Versus Non Employee Costs Per Ship. These KPI Powerpoint graphics are all data driven, and the shape automatically adjusts according to your data. Just right click on the KPI graphic, enter the right value and the shape will adjust automatically. Make a visual impact with our KPI slides.
-
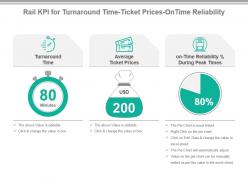 Rail kpi for turnaround time ticket prices on time reliability presentation slide
Presenting rail kpi for turnaround time ticket prices on time reliability presentation slide. This presentation slide shows Three Key Performance Indicators or KPIs in a Dashboard style design. The first KPI that can be shown is Turnaround Time. The second KPI is Average Ticket Prices. The third is on Time Reliability Percentage During Peak Times. These KPI Powerpoint graphics are all data driven, and the shape automatically adjusts according to your data. Just right click on the KPI graphic, enter the right value and the shape will adjust automatically. Make a visual impact with our KPI slides.
-
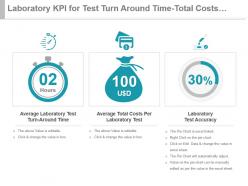 Laboratory kpi for test turn around time total costs test accuracy ppt slide
Presenting laboratory kpi for test turn around time total costs test accuracy ppt slide. This presentation slide shows three Key Performance Indicators or KPIs in a Dashboard style design. The first KPI that can be shown is Average Laboratory Test Turn Around Time. The second KPI is Average Total Costs Per Laboratory Test and the third is Laboratory Test Accuracy. These KPI Powerpoint graphics are all data driven, and the shape automatically adjusts according to your data. Just right click on the KPI graphic, enter the right value and the shape will adjust automatically. Make a visual impact with our KPI slides.
-
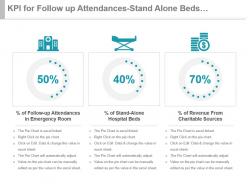 Kpi for follow up attendances stand alone beds charitable revenue ppt slide
Presenting kpi for follow up attendances stand alone beds charitable revenue ppt slide. This presentation slide shows three Key Performance Indicators or KPIs in a Dashboard style design. The first KPI that can be shown is Percentage of Follow up Attendances in Emergency Room. The second KPI is Percentage of Stand Alone Hospital Beds and the third is Percentage of Revenue From Charitable Sources. These KPI Powerpoint graphics are all data driven, and the shape automatically adjusts according to your data. Just right click on the KPI graphic, enter the right value and the shape will adjust automatically. Make a visual impact with our KPI slides.
-
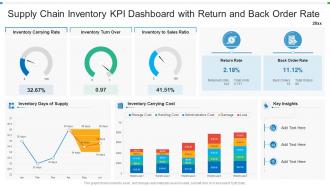 Supply chain inventory kpi dashboard with return and back order rate
Introducing our Inventory Carrying Rate, Inventory Turn Over, Inventory To Sales Ratio set of slides. The topics discussed in these slides are Inventory Carrying Rate, Inventory Turn Over, Inventory To Sales Ratio. This is an immediately available PowerPoint presentation that can be conveniently customized. Download it and convince your audience.
-
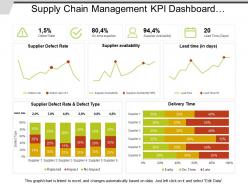 Supply chain management kpi dashboard showing defect rate and delivery time
Presenting this set of slides with name - Supply Chain Management Kpi Dashboard Showing Defect Rate And Delivery Time. This is a three stage process. The stages in this process are Demand Forecasting, Predicting Future Demand, Supply Chain Management.
-
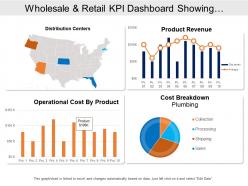 Wholesale and retail kpi dashboard showing distribution centers product revenue
Presenting this set of slides with name - Wholesale And Retail Kpi Dashboard Showing Distribution Centers Product Revenue. This is a four stage process. The stages in this process are Wholesale And Retail, Extensive And Retail, Wholesale And Distribute.
-
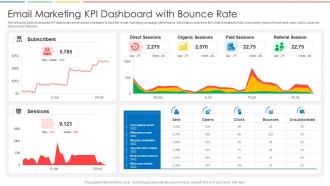 Email Marketing Kpi Dashboard With Bounce Rate
The following slide showcases KPI dashboard which allows marketers to track the email marketing campaign performance. Information covered in this slide is related to total subscribers, types of email sent, open, clicks, bounces and unsubscribed etc. Introducing our Email Marketing KPI Dashboard With Bounce Rate set of slides. The topics discussed in these slides are Direct Sessions, Organic Sessions, Paid Sessions, Referral Session. This is an immediately available PowerPoint presentation that can be conveniently customized. Download it and convince your audience.
-
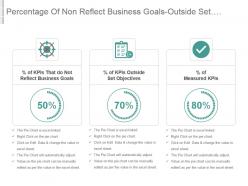 Percentage of non reflect business goals outside set objectives measured kpis ppt slide
Presenting percentage of non reflect business goals outside set objectives measured kpis ppt slide. This presentation slide shows three Key Performance Indicators or KPIs in a Dashboard style design. The first KPI that can be shown is percentage of KPIs That do Not Reflect Business Goals. The second KPI is percentage of KPIs Outside Set Objectives and the third is percentage of Measured KPIs. These KPI Powerpoint graphics are all data driven, and the shape automatically adjusts according to your data. Just right click on the KPI graphic, enter the right value and the shape will adjust automatically. Make a visual impact with our KPI slides.
-
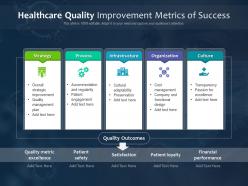 Healthcare quality improvement metrics of success
Introducing our premium set of slides with Healthcare Quality Improvement Metrics Of Success. Elucidate the five stages and present information using this PPT slide. This is a completely adaptable PowerPoint template design that can be used to interpret topics like Strategy, Process, Infrastructure, Organization, Culture, Quality Metric Excellence, Patient Safety, Satisfaction, Patient Loyalty, Financial Performance. So download instantly and tailor it with your information.
-
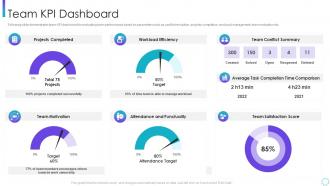 Team kpi dashboard corporate program improving work team productivity
Following slide demonstrates team KPI dashboard for evaluating team performance based on parameters such as conflict resolution, projects completion, workload management, team motivation etc. Deliver an outstanding presentation on the topic using this Team Kpi Dashboard Corporate Program Improving Work Team Productivity. Dispense information and present a thorough explanation of Team KPI Dashboard using the slides given. This template can be altered and personalized to fit your needs. It is also available for immediate download. So grab it now.
-
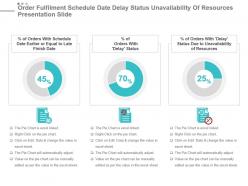 Order fulfilment schedule date delay status unavailability of resources presentation slide
Presenting order fulfilment schedule date delay status unavailability of resources presentation slide. This presentation slide shows three Key Performance Indicators or KPIs. The first KPI that can be show is percentage of Orders With Schedule Date Earlier or Equal to Late Finish Date. The second KPI is percentage of Orders With Delay Status and the third is percentage of Orders With Delay Status Due to Unavailability of Resources. These KPI Powerpoint graphics are all data driven, and the shape automatically adjusts according to your data. Just right click on the KPI graphic, enter the right value and the shape will adjust automatically. Make a visual impact with our KPI slides.
-
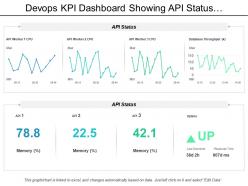 Devops kpi dashboard showing api status and uptime
Presenting this set of slides with name - Devops Kpi Dashboard Showing Api Status And Uptime. This is a four stage process. The stages in this process are Development And Operations, Devops.
-
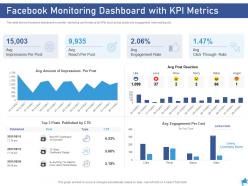 Facebook monitoring dashboard with kpi metrics digital marketing through facebook ppt rules
This slide shows Facebook dashboard to monitor marketing performance by KPIs such as top posts and engagement rate tracking etc. Present the topic in a bit more detail with this Facebook Monitoring Dashboard With KPI Metrics Digital Marketing Through Facebook Ppt Rules. Use it as a tool for discussion and navigation on Impressions Per Post, Reach Per Post, Engagement Rate. This template is free to edit as deemed fit for your organization. Therefore download it now.
-
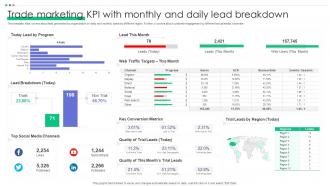 Trade Marketing KPI With Monthly And Daily Lead Breakdown
This template slide covers about lead generated by organization on daily and monthly basis by different region. Further, it covers about customer engagement by different social media channels. Presenting our well structured Trade Marketing KPI With Monthly And Daily Lead Breakdown. The topics discussed in this slide are Today Lead By Program, Lead This Month, Lead Breakdown. This is an instantly available PowerPoint presentation that can be edited conveniently. Download it right away and captivate your audience.
-
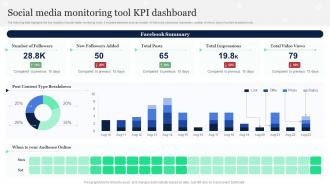 Social Media Monitoring Tool KPI Dashboard
The following slide highlights the key insights of social media monitoring tools. It includes elements such as number of followers, total posts, impression, number of views, type of content breakdown etc. Introducing our Social Media Monitoring Tool KPI Dashboard set of slides. The topics discussed in these slides are Social Media Monitoring, Tool, KPI Dashboard. This is an immediately available PowerPoint presentation that can be conveniently customized. Download it and convince your audience.
-
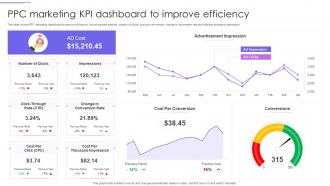 PPC Marketing KPI Dashboard To Improve Efficiency
This slide covers PPC marketing dashboard to improve efficiency. It involves total spends, number of clicks, cost per conversion, change in conversion rate and cost per thousand impression. Presenting our well structured PPC Marketing KPI Dashboard To Improve Efficiency. The topics discussed in this slide are Advertisement Impression, Cost Per Thousand, Cost Per Click. This is an instantly available PowerPoint presentation that can be edited conveniently. Download it right away and captivate your audience.
-
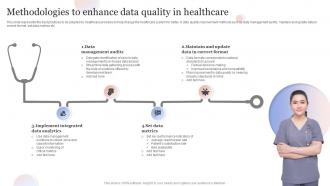 Methodologies To Enhance Data Quality In Healthcare
This slide represents the best practices to be adopted by healthcare providers to help change the healthcare system for better. It data quality improvement methods such as data management audits, maintain and update data in correct format, set data metrics etc. Introducing our premium set of slides with Methodologies To Enhance Data Quality In Healthcare. Elucidate the four stages and present information using this PPT slide. This is a completely adaptable PowerPoint template design that can be used to interpret topics like Data Management Audits, Set Data Metrics, Implement Integrated Data Analytics. So download instantly and tailor it with your information.
-
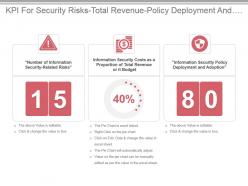 Kpi for security risks total revenue policy deployment and adoption ppt slide
Presenting kpi for security risks total revenue policy deployment and adoption ppt slide. This presentation slide shows three Key Performance Indicators or KPIs in a Dashboard style design. The first KPI that can be shown is Number of Information Security Related Risks. The second KPI is Information Security Costs as a Proportion of Total Revenue or it Budget and the third is Information Security Policy Deployment and Adoption. These KPI Powerpoint graphics are all data driven,and the shape automatically adjusts according to your data. Just right click on the KPI graphic,enter the right value and the shape will adjust automatically. Make a visual impact with our KPI slides.
-
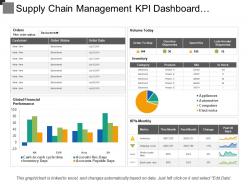 Supply chain management kpi dashboard showing order status volume and inventory
Presenting this set of slides with name - Supply Chain Management Kpi Dashboard Showing Order Status Volume And Inventory. This is a two stage process. The stages in this process are Demand Forecasting, Predicting Future Demand, Supply Chain Management.
-
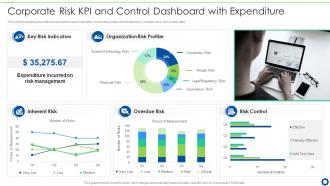 Corporate Risk KPI And Control Dashboard Snapshot With Expenditure
This slide illustrates corporate risk key performance indicators. It includes graphs of inherent risks, overdue risks, risk control data. Introducing our Corporate Risk KPI And Control Dashboard Snapshot With Expenditure set of slides. The topics discussed in these slides are Key Risk Indicators, Organization Risk Profiler, Overdue Risk, Risk Control, Inherent Risk. This is an immediately available PowerPoint presentation that can be conveniently customized. Download it and convince your audience.
-
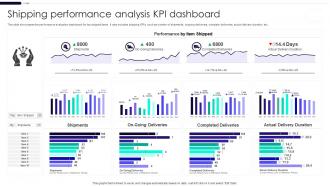 Shipping Performance Analysis KPI Dashboard
This slide showcases the performance evaluation dashboard for top shipped items. It also includes shipping KPIs such as number of shipments, ongoing deliveries, complete deliveries, actual delivery duration, etc. Introducing our Shipping Performance Analysis KPI Dashboard set of slides. The topics discussed in these slides are Completed Deliveries, Actual Delivery Duration, On Going Deliveries, Shipments. This is an immediately available PowerPoint presentation that can be conveniently customized. Download it and convince your audience.
-
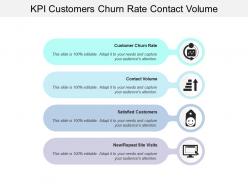 Kpi customers churn rate contact volume
Presenting this set of slides with name - Kpi Customers Churn Rate Contact Volume. This is a four stage process. The stages in this process are Kpi, Dashboard, Metrics.
-
 4 Week Roadmap For Website Statistics Improvement
This slide showcases roadmap for website statistics improvement that can help to decide the weekly milestones to enhance the website performance metrics and visitors experience. Its key steps are - measure website statistics, leverage strategies, measure progress and review progress regularly. Presenting our set of slides with name 4 Week Roadmap For Website Statistics Improvement. This exhibits information on four stages of the process. This is an easy-to-edit and innovatively designed PowerPoint template. So download immediately and highlight information on Leverage Strategiesreview Progress Regularly, Measure Progress, Website Statistics.


