KPI Dashboard, Excel and Metrics PPT Templates
-
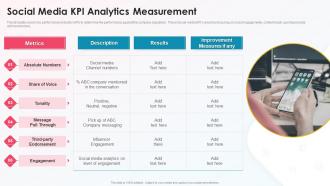 Social Media Kpi Analytics Measurement Media Platform Playbook
This template covers key performance indicator KPI to determine the performance against the company objectives. These Social media KPIs would be focusing on social engagements, content reach, purchase leads and conversions. Deliver an outstanding presentation on the topic using this Social Media Kpi Analytics Measurement Media Platform Playbook. Dispense information and present a thorough explanation of Social Media Kpi Analytics Measurement using the slides given. This template can be altered and personalized to fit your needs. It is also available for immediate download. So grab it now.
-
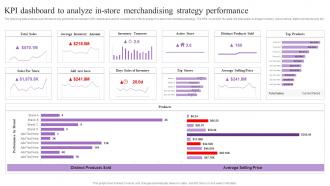 KPI Dashboard To Analyze In Store Merchandising Strategy Performance Increasing Brand Loyalty
The following slide outlines a performance key performance indicator KPI dashboard used to evaluate the effectiveness of in-store merchandising strategy. The KPIs covered in the slide are total sales, average inventory, active stores, distinct products sold, etc. Present the topic in a bit more detail with this KPI Dashboard To Analyze In Store Merchandising Strategy Performance Increasing Brand Loyalty. Use it as a tool for discussion and navigation on Total Sales, Strategy Performance, Inventory Turnover. This template is free to edit as deemed fit for your organization. Therefore download it now.
-
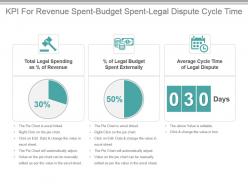 Kpi for revenue spent budget spent legal dispute cycle time presentation slide
Presenting kpi for revenue spent budget spent legal dispute cycle time presentation slide. This presentation slide shows three Key Performance Indicators or KPIs in a Dashboard style design. The first KPI that can be shown is Total Legal Spending as percentage of Revenue. The second KPI is percentage of Legal Budget Spent Externally and the third is Average Cycle Time of Legal Dispute. These KPI Powerpoint graphics are all data driven,and the shape automatically adjusts according to your data. Just right click on the KPI graphic,enter the right value and the shape will adjust automatically. Make a visual impact with our KPI slides.
-
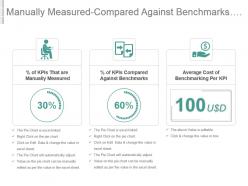 Manually measured compared against benchmarks benchmarking cost per kpi ppt slide
Presenting manually measured compared against benchmarks benchmarking cost per kpi ppt slide. This presentation slide shows three Key Performance Indicators or KPIs in a Dashboard style design. The first KPI that can be shown is percentage of KPIs That are Manually Measured. The second KPI is percentage of KPIs Compared Against Benchmarks and the third is Average Cost of Benchmarking Per KPI. These KPI Powerpoint graphics are all data driven, and the shape automatically adjusts according to your data. Just right click on the KPI graphic, enter the right value and the shape will adjust automatically. Make a visual impact with our KPI slides.
-
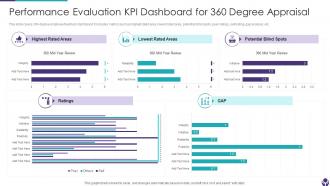 Performance Evaluation KPI Dashboard For 360 Degree Appraisal
This slide covers 360 degree employee feedback dashboard. It includes metrics such as highest rated area, lowest rated area, potential blind spots, peer ratings, self rating, gap analysis, etc. Introducing our Performance Evaluation KPI Dashboard For 360 Degree Appraisal set of slides. The topics discussed in these slides are Potential Blind Spots, Peer Ratings, Self Rating, Gap Analysis. This is an immediately available PowerPoint presentation that can be conveniently customized. Download it and convince your audience.
-
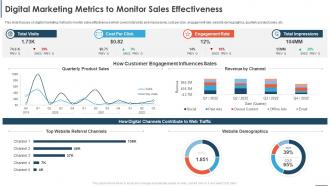 Automating Sales Processes To Improve Revenues Digital Marketing Metrics To Monitor Sales
This slide focuses on digital marketing metrics to monitor sales effectiveness which covers total visits and impressions, cost per click, engagement rate, website demographics, quarterly product sales, etc. Deliver an outstanding presentation on the topic using this Automating Sales Processes To Improve Revenues Digital Marketing Metrics To Monitor Sales. Dispense information and present a thorough explanation of Cost Per Click, Engagement Rate, Total Impressions, Total Visits using the slides given. This template can be altered and personalized to fit your needs. It is also available for immediate download. So grab it now.
-
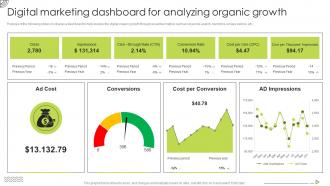 Organic Strategy To Help Business Digital Marketing Dashboard For Analyzing Organic
Purpose of the following slide is to display a dashboard to help analyze the digital organic growth through essential metrics such as keywords search, backlinks, unique visitors, etc. Present the topic in a bit more detail with this Organic Strategy To Help Business Digital Marketing Dashboard For Analyzing Organic. Use it as a tool for discussion and navigation on Impressions, Conversion Rate, Cost per click, Conversions. This template is free to edit as deemed fit for your organization. Therefore download it now.
-
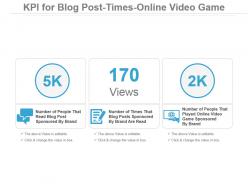 Kpi For Blog Post Times Online Video Game Ppt Slide
Presenting kpi for blog post times online video game ppt slide. This presentation slide shows three Key Performance Indicators or KPIs in a Dashboard style design. The first KPI that can be shown is Number of People That Read Blog Post Sponsored By Brand. The second KPI is Number of Times That Blog Posts Sponsored By Brand Are Read and the third is Number of People That Played Online Video Game Sponsored By Brand. These KPI Powerpoint graphics are all data driven, and the shape automatically adjusts according to your data. Just right click on the KPI graphic, enter the right value and the shape will adjust automatically. Make a visual impact with our KPI slides.
-
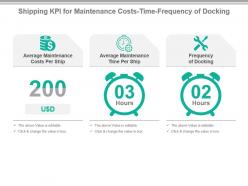 Shipping kpi for maintenance costs time frequency of docking ppt slide
Presenting shipping kpi for maintenance costs time frequency of docking ppt slide. This presentation slide shows three Key Performance Indicators or KPIs in a Dashboard style design. The first KPI that can be shown is Average Maintenance Costs Per Ship. The second KPI is Average Maintenance Time Per Ship and the third is Frequency of Docking. These KPI Powerpoint graphics are all data driven, and the shape automatically adjusts according to your data. Just right click on the KPI graphic, enter the right value and the shape will adjust automatically. Make a visual impact with our KPI slides.
-
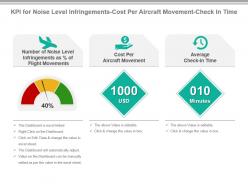 Kpi for noise level infringements cost per aircraft movement check in time ppt slide
Presenting kpi for noise level infringements cost per aircraft movement check in time ppt slide. This presentation slide shows Three Key Performance Indicators or KPIs in a Dashboard style design. The first KPI that can be shown is Number of Noise Level Infringements as Percentage of Flight Movements. The second KPI is Cost Per Aircraft Movement. The third is Average Check in Time. These KPI Powerpoint graphics are all data driven, and the shape automatically adjusts according to your data. Just right click on the KPI graphic, enter the right value and the shape will adjust automatically. Make a visual impact with our KPI slides.
-
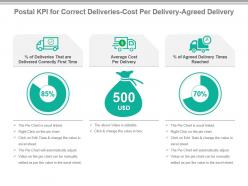 Postal kpi for correct deliveries cost per delivery agreed delivery ppt slide
Presenting postal kpi for correct deliveries cost per delivery agreed delivery ppt slide. This presentation slide shows Three Key Performance Indicators or KPIs in a Dashboard style design. The first KPI that can be shown is Percentage of Deliveries That are Delivered Correctly First Time. The second KPI is Average Cost Per Delivery. The third is Percentage of Agreed Delivery Times Reached. These KPI Powerpoint graphics are all data driven, and the shape automatically adjusts according to your data. Just right click on the KPI graphic, enter the right value and the shape will adjust automatically. Make a visual impact with our KPI slides.
-
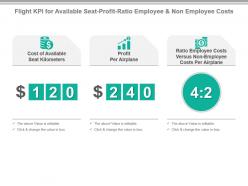 Flight kpi for available seat profit ratio employee and non employee costs powerpoint slide
Presenting flight kpi for available seat profit ratio employee and non employee costs powerpoint slide. This presentation slide shows three Key Performance Indicators or KPIs in a Dashboard style design. The first KPI that can be shown is Cost of Available Seat Kilometers. The second KPI is Profit Per Airplane and the third is Ratio Employee Costs Versus Non Employee Costs Per Airplane. These KPI Powerpoint graphics are all data driven, and the shape automatically adjusts according to your data. Just right click on the KPI graphic, enter the right value and the shape will adjust automatically. Make a visual impact with our KPI slides.
-
 Kpi for incorrect international correct national international deliveries ppt slide
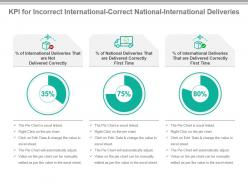
Presenting kpi for incorrect international correct national international deliveries ppt slide. This presentation slide shows three Key Performance Indicators or KPIs in a Dashboard style design. The first KPI that can be shown is percentage of International Deliveries That are Not Delivered Correctly. The second KPI is percentage of National Deliveries That are Delivered Correctly First Time and the third is percentage of International Deliveries That are Delivered Correctly First Time. These KPI Powerpoint graphics are all data driven, and the shape automatically adjusts according to your data. Just right click on the KPI graphic, enter the right value and the shape will adjust automatically. Make a visual impact with our KPI slides.
-
 KPI Dashboard Of Data Warehouse Overview With Delivery Reliability
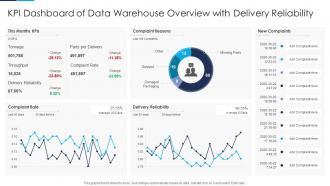
Presenting our well structured KPI Dashboard Of Data Warehouse Overview With Delivery Reliability. The topics discussed in this slide are KPI Dashboard Of Data Warehouse Overview With Delivery Reliability. This is an instantly available PowerPoint presentation that can be edited conveniently. Download it right away and captivate your audience.
-
 Warehouse Data KPI With Order Performance Dashboard Snapshot
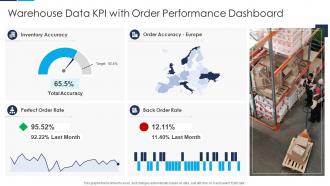
Presenting our well structured Warehouse Data KPI With Order Performance Dashboard Snapshot. The topics discussed in this slide are Perfect Order Rate, Inventory Accuracy, Back Order Rate. This is an instantly available PowerPoint presentation that can be edited conveniently. Download it right away and captivate your audience.
-
 Kpi for directors share average tenure executives corporate reputation powerpoint slide
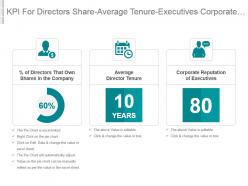
Presenting kpi for directors share average tenure executives corporate reputation powerpoint slide. This presentation slide shows three Key Performance Indicators or KPIs in a Dashboard style design. The first KPI that can be shown is percentage of Directors That Own Shares in the Company. The second KPI is Average Director Tenure and the third is Corporate Reputation of Executives. These KPI Powerpoint graphics are all data driven, and the shape automatically adjusts according to your data. Just right click on the KPI graphic, enter the right value and the shape will adjust automatically. Make a visual impact with our KPI slides.
-
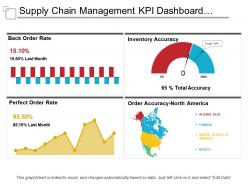 Supply chain management kpi dashboard showing back order rate and order accuracy
Presenting this set of slides with name - Supply Chain Management Kpi Dashboard Showing Back Order Rate And Order Accuracy. This is a four stage process. The stages in this process are Demand Forecasting, Predicting Future Demand, Supply Chain Management.
-
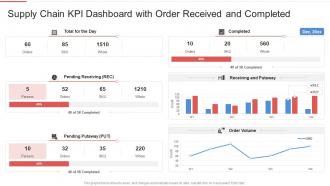 Supply chain kpi dashboard with order received and completed
Presenting our well-structured Supply Chain KPI Dashboard With Order Received And Completed. The topics discussed in this slide are Supply Chain KPI Dashboard With Order Received And Completed. This is an instantly available PowerPoint presentation that can be edited conveniently. Download it right away and captivate your audience.
-
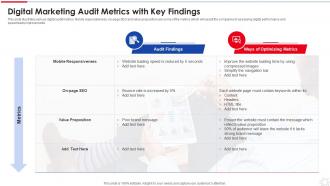 Digital Marketing Audit Metrics With Key Findings
This slide illustrates various digital audit metrics. Mobile responsiveness, on page SEO and value proposition are some of the metrics which will assist the companies in assessing digital performance and spearheads improvements. Introducing our Digital Marketing Audit Metrics With Key Findings set of slides. The topics discussed in these slides are Mobile Responsiveness, Value Proposition, On page SEO. This is an immediately available PowerPoint presentation that can be conveniently customized. Download it and convince your audience.
-
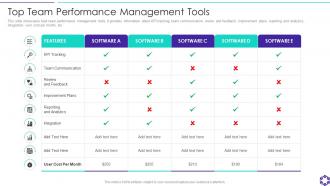 Top Team Performance Management Tools
This slide showcases best team performance management tools. It provides information about KPI tracking, team communication, review and feedback, improvement plans, reporting and analytics, integration, user cost per month, etc. Presenting our well structured Top Team Performance Management Tools. The topics discussed in this slide are Top Team Performance Management Tools. This is an instantly available PowerPoint presentation that can be edited conveniently. Download it right away and captivate your audience.
-
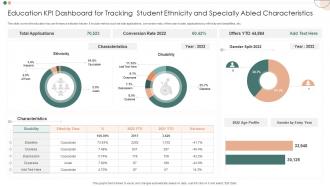 Education KPI Dashboard For Tracking Student Ethnicity And Specially Abled Characteristics
This slide covers the education key performance indicator tracker. It include metrics such as total applications, conversion rate, offers year to date, applications by ethnicity and disabilities, etc. Introducing our Education KPI Dashboard For Tracking Student Ethnicity And Specially Abled Characteristics set of slides. The topics discussed in these slides are Education KPI Dashboard, Tracking Student Ethnicity, Specially Abled Characteristics. This is an immediately available PowerPoint presentation that can be conveniently customized. Download it and convince your audience.
-
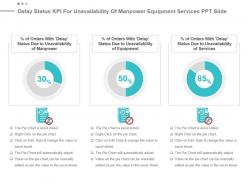 Delay status kpi for unavailability of manpower equipment services ppt slide
Presenting delay status kpi for unavailability of manpower equipment services ppt slide. This presentation slide shows three Key Performance Indicators or KPIs. The first KPI that can be show is percentage of Orders With Delay Status Due to Unavailability of Manpower. The second KPI is percentage of Orders With Delay Status Due to Unavailability of Equipment and the third is percentage of Orders With Delay Status Due to Unavailability of Services. These KPI Powerpoint graphics are all data driven, and the shape automatically adjusts according to your data. Just right click on the KPI graphic, enter the right value and the shape will adjust automatically. Make a visual impact with our KPI slides.
-
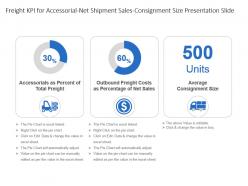 Freight kpi for accessorial net shipment sales consignment size presentation slide
Presenting freight kpi for accessorial net shipment sales consignment size presentation slide. This presentation slide shows three Key Performance Indicators or KPIs in a Dashboard style design. The first KPI that can be shown is Accessorials as Percent of Total Freight. The second KPI is Outbound Freight Costs as Percentage of Net Sales and the third is Average Consignment Size. These KPI Powerpoint graphics are all data driven, and the shape automatically adjusts according to your data. Just right click on the KPI graphic, enter the right value and the shape will adjust automatically. Make a visual impact with our KPI slides.
-
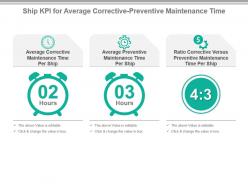 Ship kpi for average corrective preventive maintenance time powerpoint slide
Presenting ship kpi for average corrective preventive maintenance time powerpoint slide. This presentation slide shows three Key Performance Indicators or KPIs in a Dashboard style design. The first KPI that can be shown is Average Corrective Maintenance Time Per Ship. The second KPI is Average Preventive Maintenance Time Per Ship and the third is Ratio Corrective Versus Preventive Maintenance Time Per Ship. These KPI Powerpoint graphics are all data driven, and the shape automatically adjusts according to your data. Just right click on the KPI graphic, enter the right value and the shape will adjust automatically. Make a visual impact with our KPI slides.
-
 Warehousing kpi for inbound volumes storage capacity utilization rate ppt slide
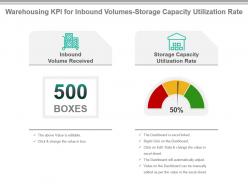
Presenting warehousing kpi for inbound volumes storage capacity utilization rate ppt slide. This presentation slide shows Two Key Performance Indicators or KPIs in a Dashboard style design. The first KPI that can be shown is Inbound Volume Received. The second KPI is Storage Capacity Utilization Rate. These KPI Powerpoint graphics are all data driven, and the shape automatically adjusts according to your data. Just right click on the KPI graphic, enter the right value and the shape will adjust automatically. Make a visual impact with our KPI slides.
-
 Airline kpi for average age of fleet fuel cost accidents per hour presentation slide
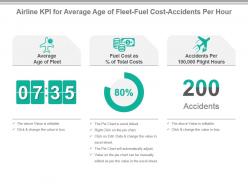
Presenting airline kpi for average age of fleet fuel cost accidents per hour presentation slide. This presentation slide shows three Key Performance Indicators or KPIs in a Dashboard style design. The first KPI that can be shown is Average Age of Fleet. The second KPI is Fuel Cost as Percentage of Total Costs and the third is Accidents Per 100,000 Flight Hours. These KPI Powerpoint graphics are all data driven, and the shape automatically adjusts according to your data. Just right click on the KPI graphic, enter the right value and the shape will adjust automatically. Make a visual impact with our KPI slides.
-
 Key metrics in reverse logistics customer metrics ppt powerpoint picture
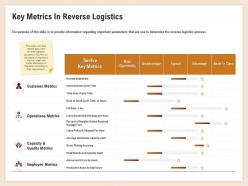
The purpose of this slide is to provide information regarding important parameters that are use to determine the reverse logistics process. Presenting this set of slides with name Key Metrics In Reverse Logistics Customer Metrics Ppt Powerpoint Picture. The topics discussed in these slides are Key Metrics, Reverse Logistics, Customer Metrics. This is a completely editable PowerPoint presentation and is available for immediate download. Download now and impress your audience.
-
 Digital marketing consulting project report dashboard snapshot
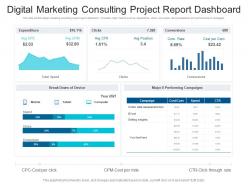
This slide exhibits digital marketing consulting project report dashboard snapshot. It includes major metrics such as- expenditure, clicks, conversion, device breakdown and performance of campaigns. Presenting our well-structured Digital Marketing Consulting Project Report Dashboard. The topics discussed in this slide are Expenditure, Performance, Cost. This is an instantly available PowerPoint presentation that can be edited conveniently. Download it right away and captivate your audience.
-
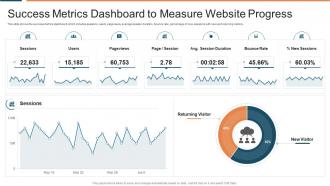 Success metrics dashboard to measure website progress
Presenting our well structured Success Metrics Dashboard To Measure Website Progress. The topics discussed in this slide are Success Metrics Dashboard To Measure Website Progress. This is an instantly available PowerPoint presentation that can be edited conveniently. Download it right away and captivate your audience.
-
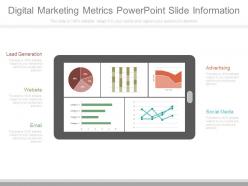 Digital marketing metrics powerpoint slide information
Presenting digital marketing metrics powerpoint slide information. This is a digital marketing metrics powerpoint slide information. This is a one stage process. The stages in this process are lead generation, website, email, advertising, social media.
-
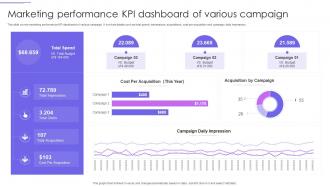 Marketing Performance KPI Dashboard Of Various Campaign
This slide covers marketing performance KPI dashboard of various campaign. It involves details such as total spend, impressions, acquisitions, cost per acquisition and campaign daily impression. Presenting our well structured Marketing Performance KPI Dashboard Of Various Campaign. The topics discussed in this slide are Total Spend, Total Impressions, Total Clicks, Total Acquisitions. This is an instantly available PowerPoint presentation that can be edited conveniently. Download it right away and captivate your audience.
-
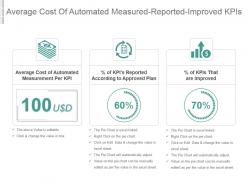 Average cost of automated measured reported improved kpis ppt slide
Presenting average cost of automated measured reported improved kpis ppt slide. This presentation slide shows three Key Performance Indicators or KPIs in a Dashboard style design. The first KPI that can be shown is Average Cost of Automated Measurement Per KPI. The second KPI is percentage of KPIs Reported According to Approved Plan and the third is percentage of KPIs That are Improved. These KPI Powerpoint graphics are all data driven, and the shape automatically adjusts according to your data. Just right click on the KPI graphic, enter the right value and the shape will adjust automatically. Make a visual impact with our KPI slides.
-
 Kpi for ratio cost between automated and manual measurement updates time presentation slide
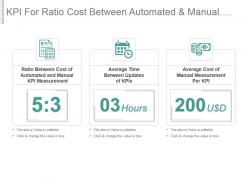
Presenting kpi for ratio cost between automated and manual measurement updates time presentation slide. This presentation slide shows three Key Performance Indicators or KPIs in a Dashboard style design. The first KPI that can be shown is Ratio Between Cost of Automated and Manual KPI Measurement. The second KPI is Average Time Between Updates of KPIs and the third is Average Cost of Manual Measurement Per KPI. These KPI Powerpoint graphics are all data driven, and the shape automatically adjusts according to your data. Just right click on the KPI graphic, enter the right value and the shape will adjust automatically. Make a visual impact with our KPI slides.
-
 Performance management kpi metrics objectives planning ppt powerpoint presentation pictures
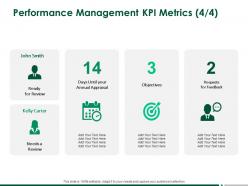
Presenting this set of slides with name Performance Management KPI Metrics Objectives Planning Ppt Powerpoint Presentation Pictures. The topics discussed in these slides are Business, Planning, Strategy, Marketing, Management. This is a completely editable PowerPoint presentation and is available for immediate download. Download now and impress your audience.
-
 Paid Social Media Marketing Plan With Key Objectives
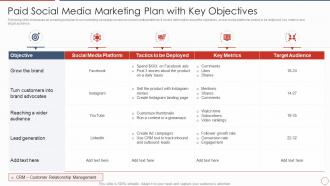
Following slide showcases an amazing paid plan to run marketing campaign on various social media platforms. It covers information about the objectives, social media platforms, tactics to be deployed, key metrics and target audience. Presenting our well structured Paid Social Media Marketing Plan With Key Objectives. The topics discussed in this slide are Target Audience, Key Metrics, Social Media Platform. This is an instantly available PowerPoint presentation that can be edited conveniently. Download it right away and captivate your audience.
-
 Digital Marketing Metrics To Monitor Sales Effectiveness Digital Automation To Streamline Sales Operations
This slide focuses on digital marketing metrics to monitor sales effectiveness which covers total visits and impressions, cost per click, engagement rate, website demographics, quarterly product sales, etc. Present the topic in a bit more detail with this Digital Marketing Metrics To Monitor Sales Effectiveness Digital Automation To Streamline Sales Operations. Use it as a tool for discussion and navigation on Marketing, Effectiveness, Demographics. This template is free to edit as deemed fit for your organization. Therefore download it now.
-
 Kpi Dashboard Snapshot To Track Viral Marketing Performance
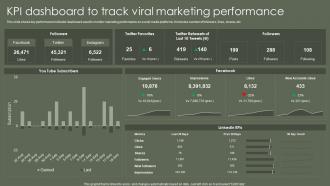
This slide shows key performance indicator dashboard used to monitor marketing performance on social media platforms. It includes number of followers, likes, shares, etc. Introducing our Kpi Dashboard Snapshot To Track Viral Marketing Performance set of slides. The topics discussed in these slides are Dashboard, Marketing, Performance. This is an immediately available PowerPoint presentation that can be conveniently customized. Download it and convince your audience.
-
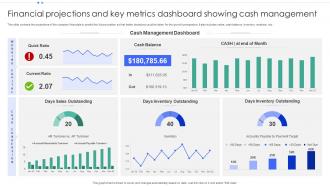 Financial Projections And Key Metrics Dashboard Showing Cash Management
This slide contains the projections of the company financials to predict the future position so that better decisions could be taken for the growth prospective. It also includes ratios, cash balance, inventory analysis , etc. Introducing our Financial Projections And Key Metrics Dashboard Showing Cash Management set of slides. The topics discussed in these slides are Cash Management Dashboard, Days Inventory Outstanding, Days Sales Outstanding. This is an immediately available PowerPoint presentation that can be conveniently customized. Download it and convince your audience.
-
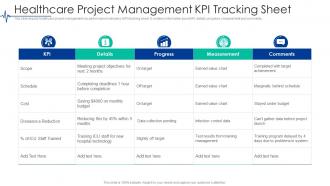 Healthcare Project Management KPI Tracking Sheet
Introducing our Healthcare Project Management KPI Tracking Sheet set of slides. The topics discussed in these slides are Healthcare Project Management KPI Tracking Sheet. This is an immediately available PowerPoint presentation that can be conveniently customized. Download it and convince your audience.
-
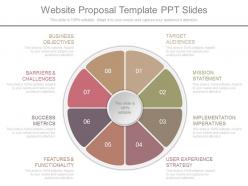 One website proposal template ppt slides
Presenting one website proposal template ppt slides. This is a website proposal template ppt slides. This is a eight stage process. The stages in this process are target audiences, mission statement, implementation imperatives, user experience strategy, feature and functionality, success metrics, barriers and challenges, business objectives.
-
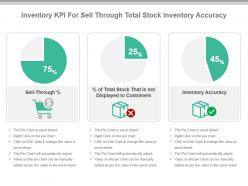 Inventory kpi for sell through total stock inventory accuracy presentation slide
Presenting inventory kpi for sell through total stock inventory accuracy presentation slide. This presentation slide shows Three Key Performance Indicators or KPIs in a Dashboard style design. The first KPI that can be shown is Sell Through Percentage. The second KPI is Percentage of Total Stock That is not Displayed to Customers. The third is Inventory Accuracy. These KPI Powerpoint graphics are all data driven, and the shape automatically adjusts according to your data. Just right click on the KPI graphic, enter the right value and the shape will adjust automatically. Make a visual impact with our KPI slides.
-
 Kpi for user share direct url access last member login time powerpoint slide
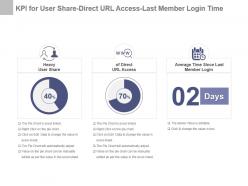
Presenting kpi for user share direct url access last member login time powerpoint slide. This presentation slide shows three Key Performance Indicators or KPIs in a Dashboard style design. The first KPI that can be shown is Heavy User Share. The second KPI is of Direct URL Access and the third is Average Time Since Last Member Login. These KPI Powerpoint graphics are all data driven, and the shape automatically adjusts according to your data. Just right click on the KPI graphic, enter the right value and the shape will adjust automatically. Make a visual impact with our KPI slides.
-
 Carrying kpi for agreed delivery time free orders cost fuel per package presentation slide
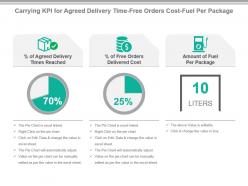
Presenting carrying kpi for agreed delivery time free orders cost fuel per package presentation slide. This presentation slide shows three Key Performance Indicators or KPIs in a Dashboard style design. The first KPI that can be shown is percentage of Agreed Delivery Times Reached. The second KPI is percentage of Free Orders Delivered Cost and the third is Amount of Fuel Per Package. These KPI Powerpoint graphics are all data driven, and the shape automatically adjusts according to your data. Just right click on the KPI graphic, enter the right value and the shape will adjust automatically. Make a visual impact with our KPI slides.
-
 Kpi for average crew per ship c02e nox emissions per 1000 miles ppt slide
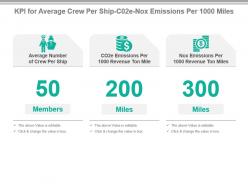
Presenting kpi for average crew per ship c02e nox emissions per 1000 miles ppt slide. This presentation slide shows three Key Performance Indicators or KPIs in a Dashboard style design. The first KPI that can be shown is Average Number of Crew Per Ship. The second KPI is CO2e Emissions Per 1000 Revenue Ton Mile and the third is Nox Emissions Per 1000 Revenue Ton Miles. These KPI Powerpoint graphics are all data driven, and the shape automatically adjusts according to your data. Just right click on the KPI graphic, enter the right value and the shape will adjust automatically. Make a visual impact with our KPI slides.
-
 Kpi for preventive corrective maintenance time co2e emissions powerpoint slide
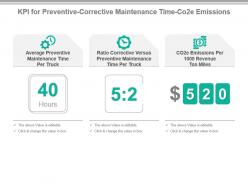
Presenting kpi for preventive corrective maintenance time co2e emissions powerpoint slide. This presentation slide shows Three Key Performance Indicators or KPIs in a Dashboard style design. The first KPI that can be shown is Average Preventive Maintenance Time Per Truck. The second KPI is Ratio Corrective Versus Preventive Maintenance Time Per Truck. The third is CO2e Emissions Per 1000 Revenue Ton Miles. These KPI Powerpoint graphics are all data driven, and the shape automatically adjusts according to your data. Just right click on the KPI graphic, enter the right value and the shape will adjust automatically. Make a visual impact with our KPI slides.
-
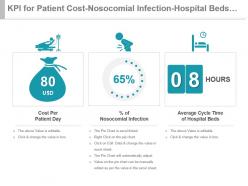 Kpi for patient cost nosocomial infection hospital beds cycle time powerpoint slide
Presenting kpi for patient cost nosocomial infection hospital beds cycle time powerpoint slide. This presentation slide shows three Key Performance Indicators or KPIs in a Dashboard style design. The first KPI that can be shown is Cost Per Patient Day. The second KPI is percentage of Nosocomial Infection and the third is Average Cycle Time of Hospital Beds. These KPI Powerpoint graphics are all data driven, and the shape automatically adjusts according to your data. Just right click on the KPI graphic, enter the right value and the shape will adjust automatically. Make a visual impact with our KPI slides.
-
 Business kpi showing key performance indicator of company through target point and line graph
Presenting this set of slides with name - Business Kpi Showing Key Performance Indicator Of Company Through Target Point And Line Graph. This is a three stage process. The stages in this process are Business Kpi, Business Dashboard, Business Metrics.
-
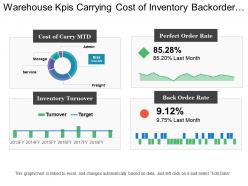 Warehouse kpis carrying cost of inventory backorder rate inventory turnover
Presenting this set of slides with name - Warehouse Kpis Carrying Cost Of Inventory Backorder Rate Inventory Turnover. This is a four stage process. The stages in this process are Warehouse Kpi, Warehouse Dashboard, Warehouse Metrics.
-
 Insurance company performance kpi dashboard analysis
Presenting this set of slides with name Insurance Company Performance KPI Dashboard Analysis. The topics discussed in these slides are Insurance Company Performance KPI Dashboard Analysis. This is a completely editable PowerPoint presentation and is available for immediate download. Download now and impress your audience.
-
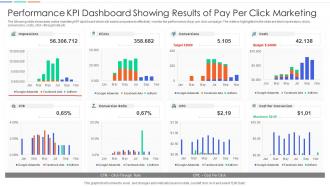 Performance KPI Dashboard Showing Results Of Pay Per Click Marketing
The following slide showcases online marketing KPI dashboard which will assist companies to effectively monitor the performance of pay per click campaign. The metrics highlighted in the slide are total impressions, clicks, conversions, costs, click through rate etc. Presenting our well structured Performance KPI Dashboard Showing Results Of Pay Per Click Marketing. The topics discussed in this slide are Impressions, Clicks, Conversions, Costs, Cost Per Conversion, Conversion Ratio, CPC. This is an instantly available PowerPoint presentation that can be edited conveniently. Download it right away and captivate your audience.
-
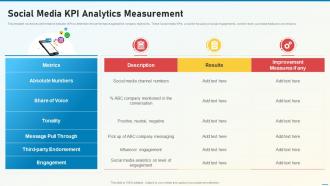 Social Media Playbook Kpi Analytics Measurement
This template covers key performance indicator KPI to determine the performance against the company objectives. These Social media KPIs would be focusing on social engagements, content reach, purchase leads and conversions. Deliver an outstanding presentation on the topic using this Social Media Playbook Kpi Analytics Measurement. Dispense information and present a thorough explanation of Analytics, Measurement, Performance using the slides given. This template can be altered and personalized to fit your needs. It is also available for immediate download. So grab it now.
-
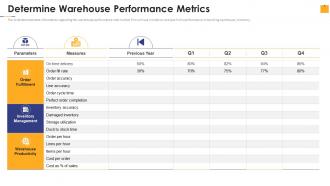 Warehouse Management Inventory Control Determine Warehouse Performance Metrics
The slide demonstrates information regarding the warehouse performance metrics that firm will use in order to analyze firms performance in handling warehouse, inventory. Present the topic in a bit more detail with this Warehouse Management Inventory Control Determine Warehouse Performance Metrics. Use it as a tool for discussion and navigation on Order Fulfillment, Inventory Management, Warehouse Productivity. This template is free to edit as deemed fit for your organization. Therefore download it now.
-
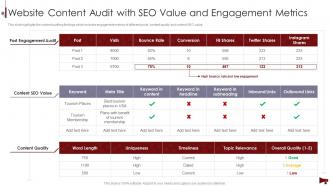 Digital Marketing Audit Of Website Website Content Audit With SEO Value And Engagement Metrics
This slide highlights the content auditing findings which includes engagement metrics of different posts, content quality and content SEO value. Present the topic in a bit more detail with this Digital Marketing Audit Of Website Website Content Audit With SEO Value And Engagement Metrics. Use it as a tool for discussion and navigation on Post Engagement Audit, Content SEO Value, Content Quality. This template is free to edit as deemed fit for your organization. Therefore download it now.
-
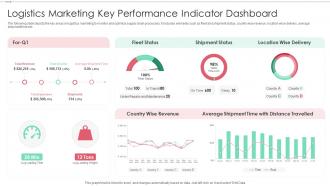 Logistics Marketing Key Performance Indicator Dashboard
The following slide depicts the key areas in logistics marketing to monitor and optimize supply chain processes. It includes elements such as fleet and shipment status, country wise revenue, location wise delivery, average shipment time etc. Introducing our Logistics Marketing Key Performance Indicator Dashboard set of slides. The topics discussed in these slides are Country Wise Revenue, Average Shipment, Distance Travelled. This is an immediately available PowerPoint presentation that can be conveniently customized. Download it and convince your audience.
-
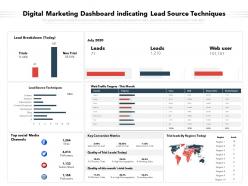 Digital marketing dashboard indicating lead source techniques
Presenting this set of slides with name Digital Marketing Dashboard Indicating Lead Source Techniques. The topics discussed in these slides are Conversion Metrics, Social Media Channels, Quality, Lead, Target. This is a completely editable PowerPoint presentation and is available for immediate download. Download now and impress your audience.
-
 Yearly products inventory turnover kpi
Presenting this set of slides with name Yearly Products Inventory Turnover KPI. The topics discussed in these slides are Transaction, Inventory, Target. This is a completely editable PowerPoint presentation and is available for immediate download. Download now and impress your audience.
-
 Kpi for enterprise performance management system
Introducing our premium set of slides with KPI For Enterprise Performance Management System. Elucidate the three stages and present information using this PPT slide. This is a completely adaptable PowerPoint template design that can be used to interpret topics like KPI For Enterprise Performance Management System. So download instantly and tailor it with your information.
-
 Inventory Management Icon With KPI Checklist
Introducing our premium set of slides with Inventory Management Icon With KPI Checklist. Ellicudate the three stages and present information using this PPT slide. This is a completely adaptable PowerPoint template design that can be used to interpret topics like Inventory Management Icon, KPI Checklist. So download instantly and tailor it with your information.
-
 Kpi for executive directors remuneration cost per director board of directors presentation slide
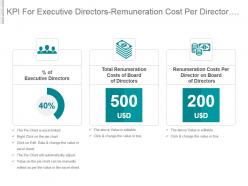
Presenting kpi for executive directors remuneration cost per director board of directors presentation slide. This presentation slide shows three Key Performance Indicators or KPIs in a Dashboard style design. The first KPI that can be shown is percentage of Executive Directors. The second KPI is Total Renumeration Costs of Board of Directors and the third is Renumeration Costs Per Director on Board of Directors. These KPI Powerpoint graphics are all data driven, and the shape automatically adjusts according to your data. Just right click on the KPI graphic, enter the right value and the shape will adjust automatically. Make a visual impact with our KPI slides.
-
 On Time Delivery Shipping KPI Report With Process Flowchart
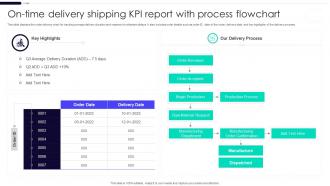
This slide displays the order delivery chart for tracking average delivery duration and reasons for shipment delays. It also includes order details such as order ID, date of the order, delivery date, and key highlights of the delivery process. Introducing our On Time Delivery Shipping KPI Report With Process Flowchart set of slides. The topics discussed in these slides are Order Received, Order Accepted, Begin Production, Production Process, Dispatched. This is an immediately available PowerPoint presentation that can be conveniently customized. Download it and convince your audience.


