Social Media KPI Dashboard, Excel, Metrics PowerPoint Templates
-
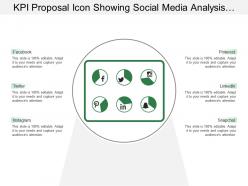 Kpi proposal icon showing social media analysis dashboard
Presenting this set of slides with name - Kpi Proposal Icon Showing Social Media Analysis Dashboard. This is a six stage process. The stages in this process are Kpi Proposal, Kpi Plan, Kpi Scheme.
-
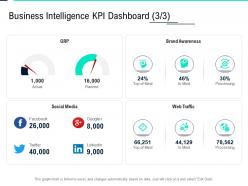 Business intelligence kpi dashboard social data integration ppt gallery maker
Present the topic in a bit more detail with this Business Intelligence Kpi Dashboard Social Data Integration Ppt Gallery Maker. Use it as a tool for discussion and navigation on Brand Awareness, Social Media, Web Traffic, Processing. This template is free to edit as deemed fit for your organization. Therefore download it now.
-
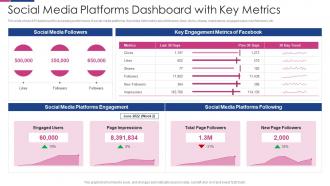 Social Media Platforms Dashboard With Key Social Media Engagement To Improve Customer Outreach
This slide shows KPI dashboard for assessing performance of social media platforms. It provides information about followers, likes, clicks, shares, impressions, engaged users, new followers, etc. Present the topic in a bit more detail with this Social Media Platforms Dashboard With Key Social Media Engagement To Improve Customer Outreach. Use it as a tool for discussion and navigation on Social Media Platforms Dashboard With Key Metrics. This template is free to edit as deemed fit for your organization. Therefore download it now.
-
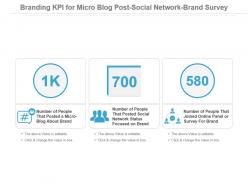 Branding Kpi For Micro Blog Post Social Network Brand Survey Presentation Slide
Presenting branding kpi for micro blog post social network brand survey presentation slide. This presentation slide shows three Key Performance Indicators or KPIs in a Dashboard style design. The first KPI that can be shown is Number of People That Posted a Micro Blog About Brand. The second KPI is Number of People That Posted Social Network Status Focused on Brand and the third is Number of People That Joined Online Panel or Survey For Brand. These KPI Powerpoint graphics are all data driven, and the shape automatically adjusts according to your data. Just right click on the KPI graphic, enter the right value and the shape will adjust automatically. Make a visual impact with our KPI slides.
-
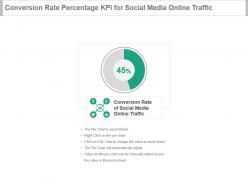 Conversion rate percentage kpi for social media online traffic ppt slide
Presenting conversion rate percentage kpi for social media online traffic ppt slide. This presentation slide shows one Key Performance Indicators or KPIs in a Dashboard style design. The first KPI that can be shown is Conversion Rate of Social Media Online Traffic. These KPI Powerpoint graphics are all data driven, and the shape automatically adjusts according to your data. Just right click on the KPI graphic, enter the right value and the shape will adjust automatically. Make a visual impact with our KPI slides.
-
 E resources kpi for send button messages news feed ticker powerpoint slide
Presenting e resources kpi for send button messages news feed ticker powerpoint slide. This presentation slide shows three Key Performance Indicators or KPIs in a Dashboard style design. The first KPI that can be shown is Number of Clicks Sent to Your Site From Send Button Messages. The second KPI is Number of Times Your Posts Were Seen in News Feed or Ticker or on Visits to Your Page and the third is Number of People Who Visited Your Page, or Saw Your Page or One of Its Posts in News Feed or Ticker. These KPI Powerpoint graphics are all data driven, and the shape automatically adjusts according to your data. Just right click on the KPI graphic, enter the right value and the shape will adjust automatically. Make a visual impact with our KPI slides.
-
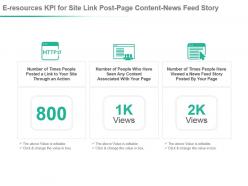 E resources kpi for site link post page content news feed story presentation slide
Presenting e resources kpi for site link post page content news feed story presentation slide. This presentation slide shows three Key Performance Indicators or KPIs in a Dashboard style design. The first KPI that can be shown is Number of Times People Posted a Link to Your Site Through an Action. The second KPI is Number of People Who Have Seen Any Content Associated With Your Page and the third is Number of Times People Have Viewed a News Feed Story Posted By Your Page. These KPI Powerpoint graphics are all data driven, and the shape automatically adjusts according to your data. Just right click on the KPI graphic, enter the right value and the shape will adjust automatically. Make a visual impact with our KPI slides.
-
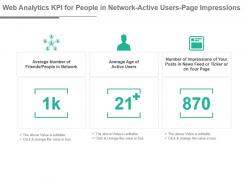 Web analytics kpi for people in network active users page impressions ppt slide
Presenting web analytics kpi for people in network active users page impressions ppt slide. This presentation slide shows three Key Performance Indicators or KPIs in a Dashboard style design. The first KPI that can be shown is Average Number of Friends People in Network. The second KPI is Average Age of Active Users and the third is Number of Impressions of Your Posts in News Feed or Ticker or on Your Page. These KPI Powerpoint graphics are all data driven, and the shape automatically adjusts according to your data. Just right click on the KPI graphic, enter the right value and the shape will adjust automatically. Make a visual impact with our KPI slides.
-
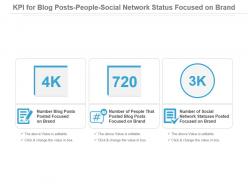 Kpi For Blog Posts People Social Network Status Focused On Brand Powerpoint Slide
Presenting kpi for blog posts people social network status focused on brand powerpoint slide. This presentation slide shows three Key Performance Indicators or KPIs in a Dashboard style design. The first KPI that can be shown is Number Blog Posts Posted Focused on Brand. The second KPI is Number of People That Posted Blog Posts Focused on Brand and the third is Number of Social Network Statuses Posted Focused on Brand. These KPI Powerpoint graphics are all data driven, and the shape automatically adjusts according to your data. Just right click on the KPI graphic, enter the right value and the shape will adjust automatically. Make a visual impact with our KPI slides.
-
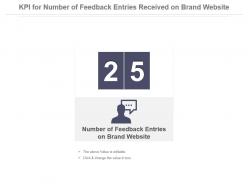 Kpi for number of feedback entries received on brand website presentation slide
Presenting kpi for number of feedback entries received on brand website presentation slide. This presentation slide shows one Key Performance Indicators or KPIs in a Dashboard style design. The first KPI that can be shown is Number of Feedback Entries on Brand Website. These KPI Powerpoint graphics are all data driven, and the shape automatically adjusts according to your data. Just right click on the KPI graphic, enter the right value and the shape will adjust automatically. Make a visual impact with our KPI slides.
-
 Kpi for number of news feed clicks send button impressions powerpoint slide
Presenting kpi for number of news feed clicks send button impressions powerpoint slide. This presentation slide shows two Key Performance Indicators or KPIs in a Dashboard style design. The first KPI that can be shown is Number of Clicks Sent to Your Site From Stories in News Feed or Page. The second KPI is Number of Impressions on The Send Button on Your Domain. These KPI Powerpoint graphics are all data driven, and the shape automatically adjusts according to your data. Just right click on the KPI graphic, enter the right value and the shape will adjust automatically. Make a visual impact with our KPI slides.
-
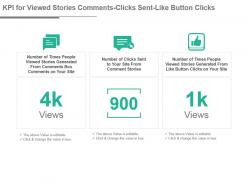 Kpi for viewed stories comments clicks sent like button clicks ppt slide
Presenting kpi for viewed stories comments clicks sent like button clicks ppt slide. This presentation slide shows three Key Performance Indicators or KPIs in a Dashboard style design. The first KPI that can be shown is Number of Times People Viewed Stories Generated From Comments Box Comments on Your Site. The second KPI is Number of Clicks Sent to Your Site From Comment Stories and the third is Number of Times People Viewed Stories Generated From Like Button Clicks on Your Site. These KPI Powerpoint graphics are all data driven, and the shape automatically adjusts according to your data. Just right click on the KPI graphic, enter the right value and the shape will adjust automatically. Make a visual impact with our KPI slides.
-
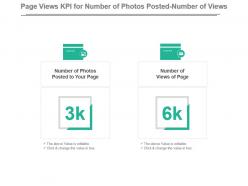 Page views kpi for number of photos posted number of views presentation slide
Presenting page views kpi for number of photos posted number of views presentation slide. This presentation slide shows two Key Performance Indicators or KPIs in a Dashboard style design. The first KPI that can be shown is Number of Photos Posted to Your Page. The second KPI is Number of Views of Page. These KPI Powerpoint graphics are all data driven, and the shape automatically adjusts according to your data. Just right click on the KPI graphic, enter the right value and the shape will adjust automatically. Make a visual impact with our KPI slides.
-
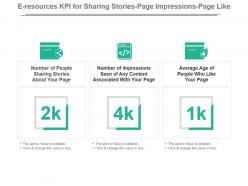 E resources kpi for sharing stories page impressions page like ppt slide
Presenting e resources kpi for sharing stories page impressions page like ppt slide. This presentation slide shows three Key Performance Indicators or KPIs in a Dashboard style design. The first KPI that can be shown is Number of People Sharing Stories About Your Page. The second KPI is Number of Impressions Seen of Any Content Associated With Your Page and the third is Average Age of People Who Like Your Page. These KPI Powerpoint graphics are all data driven, and the shape automatically adjusts according to your data. Just right click on the KPI graphic, enter the right value and the shape will adjust automatically. Make a visual impact with our KPI slides.
-
 Kpi for page content deleted likes videos post audio files played ppt slide
Presenting kpi for page content deleted likes videos post audio files played ppt slide. This presentation slide shows three Key Performance Indicators or KPIs in a Dashboard style design. The first KPI that can be shown is Number of Deletes of Likes of Your Pages Content. The second KPI is Number of Videos Posted to Your Page and the third is Number of Times Your Pages Audio Files Where Played. These KPI Powerpoint graphics are all data driven, and the shape automatically adjusts according to your data. Just right click on the KPI graphic, enter the right value and the shape will adjust automatically. Make a visual impact with our KPI slides.
-
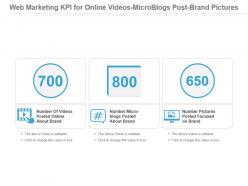 Web Marketing Kpi For Online Videos Microblogs Post Brand Pictures Presentation Slide
Presenting web marketing kpi for online videos microblogs post brand pictures presentation slide. This presentation slide shows three Key Performance Indicators or KPIs in a Dashboard style design. The first KPI that can be shown is Number Of Videos Posted Online About Brand. The second KPI is Number Micro blogs Posted About Brand and the third is Number Pictures Posted Focused on Brand. These KPI Powerpoint graphics are all data driven, and the shape automatically adjusts according to your data. Just right click on the KPI graphic, enter the right value and the shape will adjust automatically. Make a visual impact with our KPI slides.
-
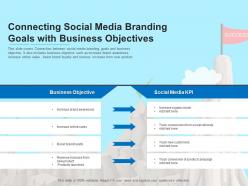 Connecting social media branding goals with business objectives
Presenting our set of slides with Connecting Social Media Branding Goals With Business Objectives. This exhibits information on one stages of the process. This is an easy-to-edit and innovatively designed PowerPoint template. So download immediately and highlight information on Business Objective, Social Media KPI.
-
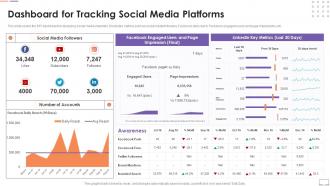 F553 Dashboard For Tracking Social Media Platforms Customer Touchpoint Guide To Improve User Experience
This slide covers the KPI dashboard for analyzing social media channels. It includes metrics such as social media followers, Facebook daily reach, Facebook engaged users and page impressions, etc. Deliver an outstanding presentation on the topic using this F553 Dashboard For Tracking Social Media Platforms Customer Touchpoint Guide To Improve User Experience. Dispense information and present a thorough explanation of Dashboard, Impressions, Analyzing using the slides given. This template can be altered and personalized to fit your needs. It is also available for immediate download. So grab it now.
-
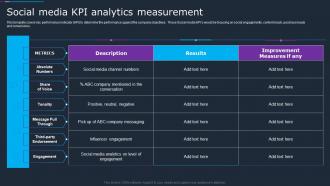 Social Media Kpi Analytics Measurement Company Social Strategy Guide
This template covers key performance indicator KPI to determine the performance against the company objectives. These Social media KPIs would be focusing on social engagements, content reach, purchase leads and conversions. Deliver an outstanding presentation on the topic using this Social Media Kpi Analytics Measurement Company Social Strategy Guide. Dispense information and present a thorough explanation of Analytics, Measurement, Performance using the slides given. This template can be altered and personalized to fit your needs. It is also available for immediate download. So grab it now.
-
 B2b Social Media Marketing And Promotion Impact Of New Social Media Marketing Campaign
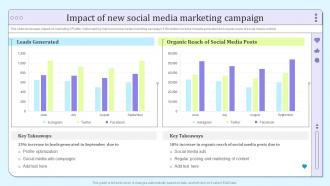
This slide showcases impact on marketing KPI after implementing improved social media marketing campaign. It illustrates increase in leads generated and organic reach of social media content. Deliver an outstanding presentation on the topic using this B2b Social Media Marketing And Promotion Impact Of New Social Media Marketing Campaign. Dispense information and present a thorough explanation of Marketing, Campaign, Optimization using the slides given. This template can be altered and personalized to fit your needs. It is also available for immediate download. So grab it now.
-
 Dashboard For Tracking Social Media Platforms Customer Journey Touchpoint Mapping Strategy
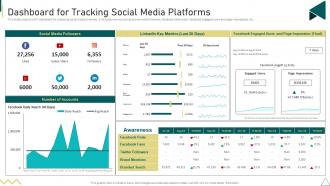
This slide covers the KPI dashboard for analyzing social media channels. It includes metrics such as social media followers, Facebook daily reach, Facebook engaged users and page impressions, etc. Deliver an outstanding presentation on the topic using this Dashboard For Tracking Social Media Platforms Customer Journey Touchpoint Mapping Strategy. Dispense information and present a thorough explanation of Dashboard For Tracking, Social Media Platforms using the slides given. This template can be altered and personalized to fit your needs. It is also available for immediate download. So grab it now.
-
 Dashboard For Tracking Social Media Platforms Identifying And Optimizing Customer Touchpoints
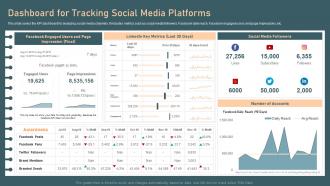
This slide covers the KPI dashboard for analyzing social media channels. It includes metrics such as social media followers, Facebook daily reach, Facebook engaged users and page impressions, etc. Deliver an outstanding presentation on the topic using this Dashboard For Tracking Social Media Platforms Identifying And Optimizing Customer Touchpoints. Dispense information and present a thorough explanation of Dashboard For Tracking, Social Media Platforms using the slides given. This template can be altered and personalized to fit your needs. It is also available for immediate download. So grab it now.
-
 Dashboard For Tracking Social Media Platforms Digital Consumer Touchpoint Strategy
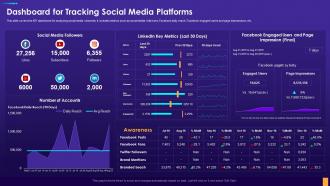
This slide covers the KPI dashboard for analyzing social media channels. It includes metrics such as social media followers, Facebook daily reach, Facebook engaged users and page impressions, etc. Present the topic in a bit more detail with this Dashboard For Tracking Social Media Platforms Digital Consumer Touchpoint Strategy. Use it as a tool for discussion and navigation on Dashboard For Tracking, Social Media Platforms. This template is free to edit as deemed fit for your organization. Therefore download it now
-
 Increment In Social Media Engagement Through Campaign KPI
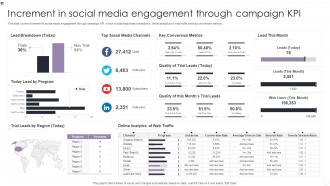
This slide covers increment in social media engagement through campaign KPI which include lead break breakdown, online analytics of web traffic and key conversion metrics. Presenting our well structured Increment In Social Media Engagement Through Campaign KPI. The topics discussed in this slide are Key Conversion Metrics, Lead Breakdown, Online Analytics. This is an instantly available PowerPoint presentation that can be edited conveniently. Download it right away and captivate your audience.
-
 Brand Followers Kpi On Social Networks Microblogging Site Focused Groups Ppt Slide
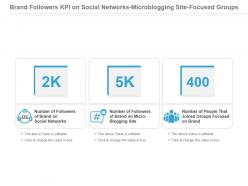
Presenting brand followers kpi on social networks microblogging site focused groups ppt slide. This presentation slide shows three Key Performance Indicators or KPIs in a Dashboard style design. The first KPI that can be shown is Number of Followers of Brand on Social Networks. The second KPI is Number of Followers of Brand on Micro Blogging Site and the third is Number of People That Joined Groups Focused on Brand. These KPI Powerpoint graphics are all data driven, and the shape automatically adjusts according to your data. Just right click on the KPI graphic, enter the right value and the shape will adjust automatically. Make a visual impact with our KPI slides.
-
 Kpi for online video games played users added item to favorites powerpoint slide
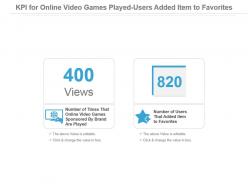
Presenting kpi for online video games played users added item to favorites powerpoint slide. This presentation slide shows two Key Performance Indicators or KPIs in a Dashboard style design. The first KPI that can be shown is Number of Times That Online Video Games Sponsored By Brand Are Played. The second KPI is Number of Users That Added Item to Favorites. These KPI Powerpoint graphics are all data driven, and the shape automatically adjusts according to your data. Just right click on the KPI graphic, enter the right value and the shape will adjust automatically. Make a visual impact with our KPI slides.
-
 Social media kpi for average number of friend requests received powerpoint slide
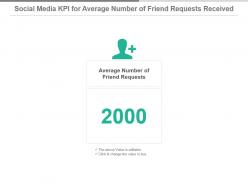
Presenting social media kpi for average number of friend requests received powerpoint slide. This presentation slide shows one Key Performance Indicators or KPIs in a Dashboard style design. The first KPI that can be shown is Average Number of Friend Requests. These KPI Powerpoint graphics are all data driven, and the shape automatically adjusts according to your data. Just right click on the KPI graphic, enter the right value and the shape will adjust automatically. Make a visual impact with our KPI slides.
-
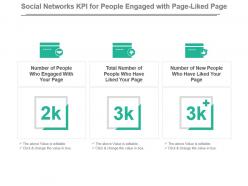 Social networks kpi for people engaged with page liked page ppt slide
Presenting social networks kpi for people engaged with page liked page ppt slide. This presentation slide shows three Key Performance Indicators or KPIs in a Dashboard style design. The first KPI that can be shown is Number of People Who Engaged With Your Page. The second KPI is Total Number of People Who Have Liked Your Page and the third is Number of New People Who Have Liked Your Page. These KPI Powerpoint graphics are all data driven, and the shape automatically adjusts according to your data. Just right click on the KPI graphic, enter the right value and the shape will adjust automatically. Make a visual impact with our KPI slides.
-
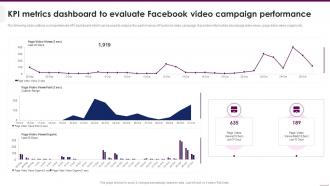 KPI Metrics Dashboard To Evaluate Implementing Video Marketing Strategies
The following slide outlines a comprehensive KPI dashboard which can be used to analyze the performance of Facebook video campaign. It provides information about page video views, page video views organic etc. Deliver an outstanding presentation on the topic using this KPI Metrics Dashboard To Evaluate Implementing Video Marketing Strategies. Dispense information and present a thorough explanation of Metrics Dashboard, Campaign Performance using the slides given. This template can be altered and personalized to fit your needs. It is also available for immediate download. So grab it now.
-
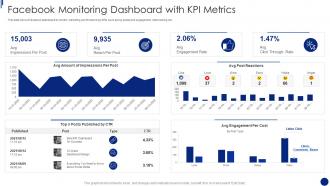 Facebook Marketing For Small Business Facebook Monitoring Dashboard With KPI Metrics
This slide shows Facebook dashboard to monitor marketing performance by KPIs such as top posts and engagement rate tracking etc. Deliver an outstanding presentation on the topic using this Facebook Marketing For Small Business Facebook Monitoring Dashboard With KPI Metrics. Dispense information and present a thorough explanation of Avg Amount Impressions Per Post, Top 3 Posts Published CTR, Avg Engagement Per Cost using the slides given. This template can be altered and personalized to fit your needs. It is also available for immediate download. So grab it now.
-
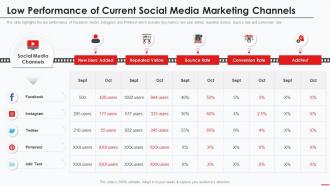 Marketing Guide Promote Products Channel Low Performance Of Current Social Media Marketing
This slide highlights the low performance of Facebook, twitter, Instagram and Pinterest which includes key metrics new user added, repeated visitors, bounce rate and conversion rate. Present the topic in a bit more detail with this Marketing Guide Promote Products Channel Low Performance Of Current Social Media Marketing. Use it as a tool for discussion and navigation on Marketing, Channels, Performance. This template is free to edit as deemed fit for your organization. Therefore download it now.
-
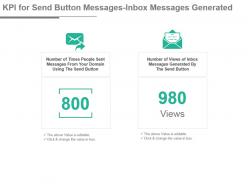 Kpi for send button messages inbox messages generated presentation slide
Presenting kpi for send button messages inbox messages generated presentation slide. This presentation slide shows two Key Performance Indicators or KPIs in a Dashboard style design. The first KPI that can be shown is Number of Times People Sent Messages From Your Domain Using The Send Button. The second KPI is Number of Views of Inbox Messages Generated By The Send Button. These KPI Powerpoint graphics are all data driven, and the shape automatically adjusts according to your data. Just right click on the KPI graphic, enter the right value and the shape will adjust automatically. Make a visual impact with our KPI slides.
-
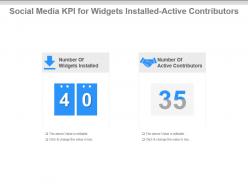 Social media kpi for widgets installed active contributors presentation slide
Presenting social media kpi for widgets installed active contributors presentation slide. This presentation slide shows two Key Performance Indicators or KPIs in a Dashboard style design. The first KPI that can be shown is Number Of Widgets Installed. The second KPI is Number Of Active Contributors. These KPI Powerpoint graphics are all data driven, and the shape automatically adjusts according to your data. Just right click on the KPI graphic, enter the right value and the shape will adjust automatically. Make a visual impact with our KPI slides.
-
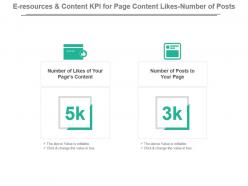 E resources and content kpi for page content likes number of posts powerpoint slide
Presenting e resources and content kpi for page content likes number of posts powerpoint slide. This presentation slide shows two Key Performance Indicators or KPIs in a Dashboard style design. The first KPI that can be shown is Number of Likes of Your Pages Content. The second KPI is Number of Posts to Your Page. These KPI Powerpoint graphics are all data driven, and the shape automatically adjusts according to your data. Just right click on the KPI graphic, enter the right value and the shape will adjust automatically. Make a visual impact with our KPI slides.
-
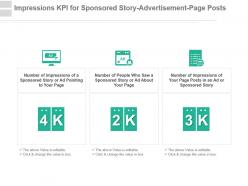 Impressions kpi for sponsored story advertisement page posts powerpoint slide
Presenting impressions kpi for sponsored story advertisement page posts powerpoint slide. This presentation slide shows three Key Performance Indicators or KPIs in a Dashboard style design. The first KPI that can be shown is Number of Impressions of a Sponsored Story or Ad Pointing to Your Page. The second KPI is Number of People Who Saw a Sponsored Story or Ad About Your Page and the third is Number of Impressions of Your Page Posts in an Ad or Sponsored Story. These KPI Powerpoint graphics are all data driven, and the shape automatically adjusts according to your data. Just right click on the KPI graphic, enter the right value and the shape will adjust automatically. Make a visual impact with our KPI slides.
-
 Kpi for pages discussion board modified page reviews powerpoint slide
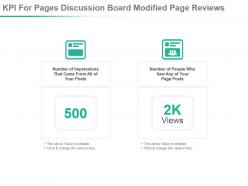
Presenting kpi for pages discussion board modified page reviews powerpoint slide. This presentation slide shows two Key Performance Indicators or KPIs in a Dashboard style design. The first KPI that can be shown is Number of Impressions That Came From All of Your Posts. The second KPI is Number of People Who Saw Any of Your Page Posts. These KPI Powerpoint graphics are all data driven, and the shape automatically adjusts according to your data. Just right click on the KPI graphic, enter the right value and the shape will adjust automatically. Make a visual impact with our KPI slides.
-
 Social platform kpi for brand reviews people commercial videos presentation slide
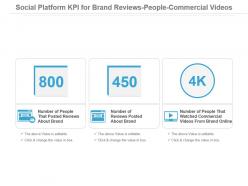
Presenting social platform kpi for brand reviews people commercial videos presentation slide. This presentation slide shows three Key Performance Indicators or KPIs in a Dashboard style design. The first KPI that can be shown is Number of People That Posted Reviews About Brand. The second KPI is Number of Reviews Posted About Brand and the third is Number of People That Watched Commercial Videos From Brand Online. These KPI Powerpoint graphics are all data driven, and the shape automatically adjusts according to your data. Just right click on the KPI graphic, enter the right value and the shape will adjust automatically. Make a visual impact with our KPI slides.
-
 Kpi metrics r731 ppt powerpoint presentation portfolio shapes
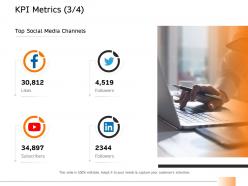
Presenting this set of slides with name KPI Metrics R731 Ppt Powerpoint Presentation Portfolio Shapes. This is a one stage process. The stages in this process are KPI Metrics. This is a completely editable PowerPoint presentation and is available for immediate download. Download now and impress your audience.
-
 Content creation kpi for story published about page powerpoint slide
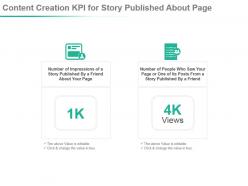
Presenting content creation kpi for story published about page powerpoint slide. This presentation slide shows two Key Performance Indicators or KPIs in a Dashboard style design. The first KPI that can be shown is Number of Impressions of a Story Published By a Friend About Your Page. The second KPI is Number of People Who Saw Your Page or One of Its Posts From a Story Published By a Friend. These KPI Powerpoint graphics are all data driven, and the shape automatically adjusts according to your data. Just right click on the KPI graphic, enter the right value and the shape will adjust automatically. Make a visual impact with our KPI slides.
-
 Data analytics kpi for page viewed stories domain impressions presentation slide
Presenting data analytics kpi for page viewed stories domain impressions presentation slide. This presentation slide shows two Key Performance Indicators or KPIs in a Dashboard style design. The first KPI that can be shown is Number of Times People Viewed Stories That Link to Your Site in News Feed or Page. The second KPI is Number of Comments Box Impressions on Your Domain. These KPI Powerpoint graphics are all data driven, and the shape automatically adjusts according to your data. Just right click on the KPI graphic, enter the right value and the shape will adjust automatically. Make a visual impact with our KPI slides.
-
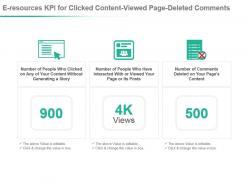 E resources kpi for clicked content viewed page deleted comments presentation slide
Presenting e resources kpi for clicked content viewed page deleted comments presentation slide. This presentation slide shows three Key Performance Indicators or KPIs in a Dashboard style design. The first KPI that can be shown is Number of People Who Clicked on Any of Your Content Without Generating a Story. The second KPI is Number of People Who Have Interacted With or Viewed Your Page or Its Posts and the third is Number of Comments Deleted on Your Pages Content. These KPI Powerpoint graphics are all data driven, and the shape automatically adjusts according to your data. Just right click on the KPI graphic, enter the right value and the shape will adjust automatically. Make a visual impact with our KPI slides.
-
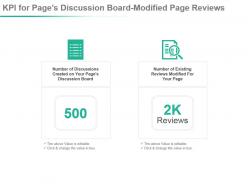 E resources and content kpi for post impressions viewed page posts ppt slide
Presenting e resources and content kpi for post impressions viewed page posts ppt slide. This presentation slide shows two Key Performance Indicators or KPIs in a Dashboard style design. The first KPI that can be shown is Number of Discussions Created on Your Pages Discussion Board. The second KPI is Number of Existing Reviews Modified For Your Page. These KPI Powerpoint graphics are all data driven, and the shape automatically adjusts according to your data. Just right click on the KPI graphic, enter the right value and the shape will adjust automatically. Make a visual impact with our KPI slides.
-
 Kpi metrics channels ppt powerpoint presentation styles format
Presenting this set of slides with name KPI Metrics Channels Ppt Powerpoint Presentation Styles Format. This is a one stage process. The stages in this process are Top Social Media Channels. This is a completely editable PowerPoint presentation and is available for immediate download. Download now and impress your audience.
-
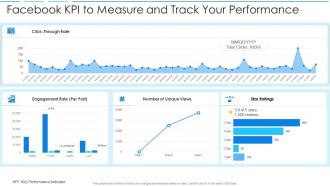 Facebook kpi to measure and track your performance
Introducing our Facebook KPI To Measure And Track Your Performance set of slides. The topics discussed in these slides are Facebook KPI To Measure And Track Your Performance. This is an immediately available PowerPoint presentation that can be conveniently customized. Download it and convince your audience.
-
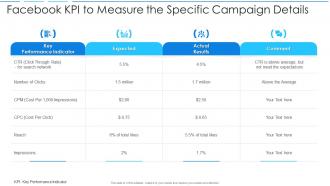 Facebook kpi to measure the specific campaign details
Presenting our well structured Facebook KPI To Measure The Specific Campaign Details. The topics discussed in this slide are Facebook KPI To Measure The Specific Campaign Details. This is an instantly available PowerPoint presentation that can be edited conveniently. Download it right away and captivate your audience.
-
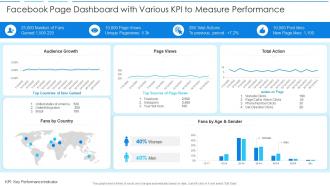 Facebook page dashboard with various kpi to measure performance
Presenting our well structured Facebook Page Dashboard With Various KPI To Measure Performance. The topics discussed in this slide are Facebook Page Dashboard With Various KPI To Measure Performance. This is an instantly available PowerPoint presentation that can be edited conveniently. Download it right away and captivate your audience.
-
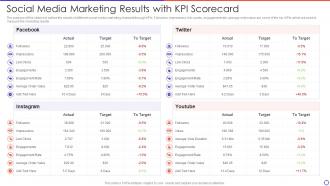 Social Media Marketing Results With Kpi Scorecard
The purpose of this slide is to outline the results of different social media marketing channels through KPIs. Followers, impressions, link counts, engagement rate, average order value are some of the key KPIs which are used to measure the marketing results. Presenting our well-structured Social Media Marketing Results With Kpi Scorecard. The topics discussed in this slide are Social Media Marketing Results With KPI Scorecard. This is an instantly available PowerPoint presentation that can be edited conveniently. Download it right away and captivate your audience.
-
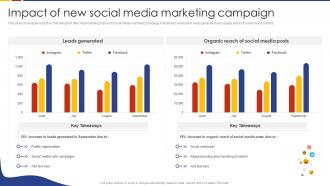 Impact Of New Social Media Marketing Campaign Social Media Marketing Strategic
This slide showcases impact on marketing KPI after implementing improved social media marketing campaign. It illustrates increase in leads generated and organic reach of social media content. Present the topic in a bit more detail with this Impact Of New Social Media Marketing Campaign Social Media Marketing Strategic. Use it as a tool for discussion and navigation on Leads Generated, Organic Reach, Social Media Posts. This template is free to edit as deemed fit for your organization. Therefore download it now.
-
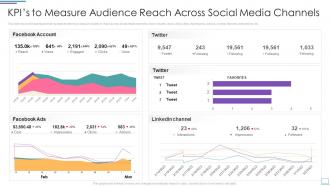 KPIs To Measure Audience Reach Across Social Media Channels Incorporating Social Media Marketing
This slide shows the dashboard that represents metrics to measure audience reach across social media channels which includes views, clicks, likes, impressions, actions, tweets, followers, interactions, etc. Present the topic in a bit more detail with this KPIs To Measure Audience Reach Across Social Media Channels Incorporating Social Media Marketing. Use it as a tool for discussion and navigation on Measure Audience, Social Media Channels. This template is free to edit as deemed fit for your organization. Therefore download it now.
-
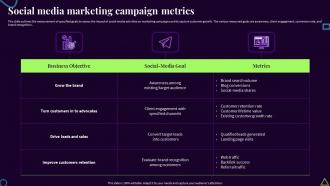 Social Media Marketing Campaign Metrics
This slide outlines the measurement of specified goals to assess the impact of social media activities on marketing campaigns and to capture customer growth. The various measured goals are awareness, client engagement, conversion rate, and brand recognition. Introducing our Social Media Marketing Campaign Metrics set of slides. The topics discussed in these slides are Business Objective, Social Media Goal, Metrics. This is an immediately available PowerPoint presentation that can be conveniently customized. Download it and convince your audience.
-
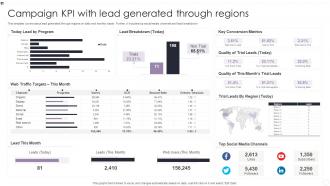 Campaign KPI With Lead Generated Through Regions
This template covers about lead generated through regions on daily and monthly basis . Further, it includes top social media channels and lead breakdown. Introducing our Campaign KPI With Lead Generated Through Regions set of slides. The topics discussed in these slides are Lead Breakdown, Key Conversion Metrics, Web Traffic Targets. This is an immediately available PowerPoint presentation that can be conveniently customized. Download it and convince your audience.
-
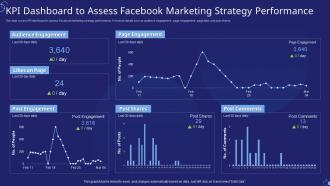 KPI Dashboard To Assess Facebook Marketing Strategy Performance
This slide covers KPI dashboard to assess Facebook marketing strategy performance. It involves details such as audience engagement, page engagement, page likes and post shares. Introducing our KPI Dashboard To Assess Facebook Marketing Strategy Performance set of slides. The topics discussed in these slides are KPI Dashboard, Marketing Strategy Performance. This is an immediately available PowerPoint presentation that can be conveniently customized. Download it and convince your audience.
-
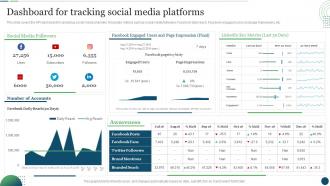 Dashboard For Tracking Social Media Platforms Customer Touchpoint Plan To Enhance Buyer Journey
This slide covers the KPI dashboard for analyzing social media channels. It includes metrics such as social media followers, Facebook daily reach, Facebook engaged users and page impressions, etc. Deliver an outstanding presentation on the topic using this Dashboard For Tracking Social Media Platforms Customer Touchpoint Plan To Enhance Buyer Journey. Dispense information and present a thorough explanation of Dashboard, Analysing, Impressions using the slides given. This template can be altered and personalized to fit your needs. It is also available for immediate download. So grab it now.
-
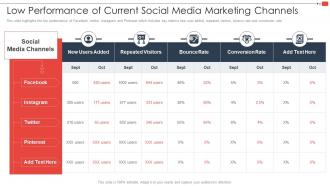 Youtube Marketing Strategy Low Performance Of Current Social Media Marketing Channels
This slide highlights the low performance of Facebook, twitter, Instagram and Pinterest which includes key metrics new user added, repeated visitors, bounce rate and conversion rate. Present the topic in a bit more detail with this Youtube Marketing Strategy Low Performance Of Current Social Media Marketing Channels. Use it as a tool for discussion and navigation on Conversion Rate, Bounce Rate, Social Media Channels. This template is free to edit as deemed fit for your organization. Therefore download it now.
-
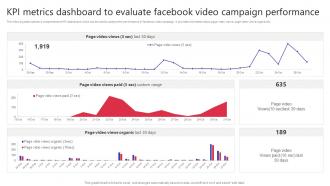 KPI Metrics Dashboard To Evaluate Campaign Performance Building Video Marketing Strategies
The following slide outlines a comprehensive KPI dashboard which can be used to analyze the performance of facebook video campaign. It provides information about page video views, page video views organic etc.Deliver an outstanding presentation on the topic using this KPI Metrics Dashboard To Evaluate Campaign Performance Building Video Marketing Strategies. Dispense information and present a thorough explanation of Metrics Dashboard, Evaluate Facebook, Campaign Performance using the slides given. This template can be altered and personalized to fit your needs. It is also available for immediate download. So grab it now.


