Linear progression ppt infographic
Simple linear PowerPoint template is a PowerPoint presentation template and it is perfect to represent the gradual progress in the process or project. The linear progression design slide is useful to show a growth model or you can make an awesome presentation for showing the growth trend in the business. A user can also use the line chart progression PPT template to illustrate a moderated growth after passing through a tipping point where it starts to slow down the process. The infographic linear presentation template is suitable for resembling trends in the life-cycle of many living things as well as phenomena. The linear progression slide is useful to explain all sorts of contexts such as product development and also in leadership training or even in biology and agriculture. A linear business growth diagram slide is suitable when a user wants to share details of different business units within his organization as well as compare the performance. When a presenter wants to prepare presentations on business forecast revenue as well as growth along with calculating GDP annual growth rate or other economics presentations, the linear progression infographic slide is perfect. Encourage jokes with our Linear Progression Ppt Infographic. Enable folks to indulge in humorous interaction.
Simple linear PowerPoint template is a PowerPoint presentation template and it is perfect to represent the gradual progress..
- Google Slides is a new FREE Presentation software from Google.
- All our content is 100% compatible with Google Slides.
- Just download our designs, and upload them to Google Slides and they will work automatically.
- Amaze your audience with SlideTeam and Google Slides.
-
Want Changes to This PPT Slide? Check out our Presentation Design Services
- WideScreen Aspect ratio is becoming a very popular format. When you download this product, the downloaded ZIP will contain this product in both standard and widescreen format.
-

- Some older products that we have may only be in standard format, but they can easily be converted to widescreen.
- To do this, please open the SlideTeam product in Powerpoint, and go to
- Design ( On the top bar) -> Page Setup -> and select "On-screen Show (16:9)” in the drop down for "Slides Sized for".
- The slide or theme will change to widescreen, and all graphics will adjust automatically. You can similarly convert our content to any other desired screen aspect ratio.
Compatible With Google Slides

Get This In WideScreen
You must be logged in to download this presentation.
PowerPoint presentation slides
Presenting linear progression PPT infographic PowerPoint slide. The linear graph template is 100% compatible with Google Slides and can also edit it in PowerPoint. A user may insert his organization's name and logo. Template's quality remains same, even after doing changes in it, for example, editing color, font size, font type, and insert text as per requirement. The graph diagram template is suitable for explaining progression model. You can download this template easily. The slide is compatible with other formats such as JPEG and PDF.
People who downloaded this PowerPoint presentation also viewed the following :
Content of this Powerpoint Presentation
Description:
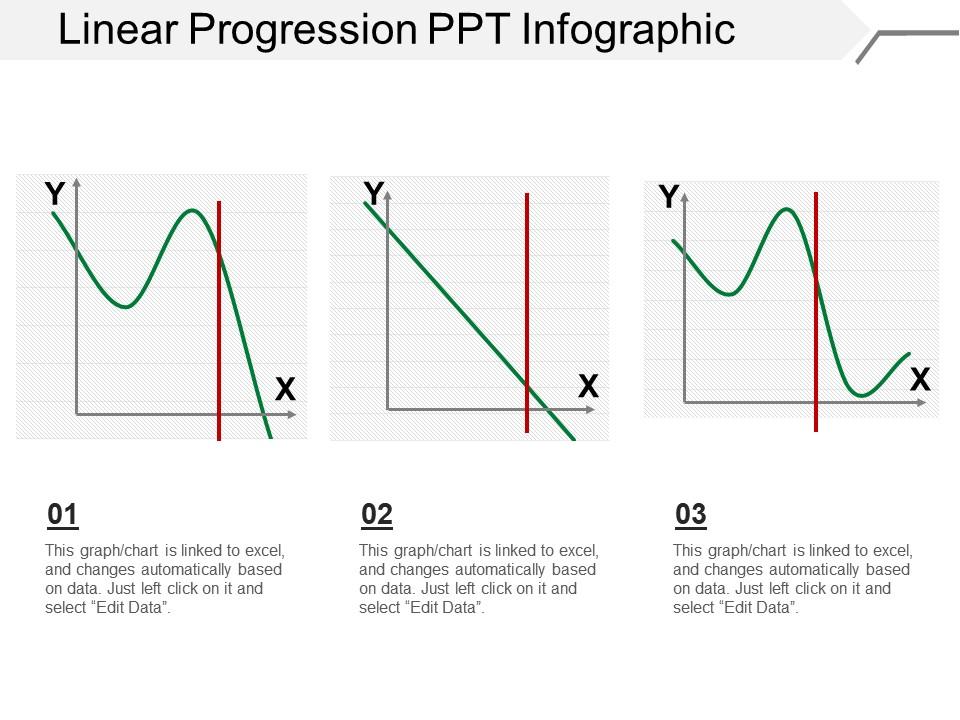
The image depicts a PowerPoint slide titled "Linear Progression PPT Infographic." It features three graphs labeled 01, 02, and 03, each displaying a curve on a Cartesian coordinate system with axes labeled X and Y. A vertical red line intersects each graph at different points, perhaps indicating a moment of significant change or a critical value.
Text Elements:
Each graph/chart is noted to be linked to Excel, indicating that the data is dynamic and can be updated by editing the source data in Excel. The instruction "Just left-click on it and select 'Edit Data'" suggests a user-friendly method for updating the graphs.
Use Cases:
This type of slide is useful for presenting data trends, progress, or comparisons over time or between scenarios in various industries.
1. Finance:
Use: Visualizing market trends.
Presenter: Financial Analyst
Audience: Investors, Portfolio Managers
2. Marketing:
Use: Tracking campaign performance.
Presenter: Marketing Manager
Audience: Marketing Teams, Executives
3. Sales:
Use: Showing sales growth or decline.
Presenter: Sales Director
Audience: Sales Representatives, Management Teams
4. Healthcare:
Use: Demonstrating patient recovery rates.
Presenter: Medical Researcher
Audience: Healthcare Providers, Administrators
5. Education:
Use: Analyzing student performance data.
Presenter: Educational Data Analyst
Audience: Teachers, Education Administrators
6. Manufacturing:
Use: Monitoring production quality control.
Presenter: Quality Assurance Manager
Audience: Production Teams, Operational Managers
7. Technology:
Use: Evaluating software performance metrics.
Presenter: IT Project Manager
Audience: Developers, Stakeholders
Linear progression ppt infographic with all 5 slides:
Every event becomes enjoyable with our Linear Progression Ppt Infographic. They allow you to have great fun.
-
Amazing product with appealing content and design.
-
Understandable and informative presentation.


