Roi Calculation Powerpoint Presentation Slides
Highlight your financial business data in a professional way with our ROI calculation PPT template. Our dedicated designing team has made this brilliant Presentation possible. Representing the data can sometimes be problematic as you need to ensure that all the information is shown way which is easily understandable by your audience. Our ROI calculation PowerPoint slideshow consists of ready-made PPT slides with graphics, icons and visuals to represent your important financial numbers and statistics. Return on investment is a measurement of efficiency in converting your business investment into profit. Therefore, it is vital to projecting whether a business venture is worthwhile and what adjustments to make once a company is active. The content is extensively researched, and designs are professional in this ROI calculation Presentation deck. So, create the proper datasheets, tables and charts for your financial data and then work towards analyzing it. Download the slideshow now. Our Roi Calculation Powerpoint Presentation Slides are reviewed from day to day. They are designed to keep you in front.
- Google Slides is a new FREE Presentation software from Google.
- All our content is 100% compatible with Google Slides.
- Just download our designs, and upload them to Google Slides and they will work automatically.
- Amaze your audience with SlideTeam and Google Slides.
-
Want Changes to This PPT Slide? Check out our Presentation Design Services
- WideScreen Aspect ratio is becoming a very popular format. When you download this product, the downloaded ZIP will contain this product in both standard and widescreen format.
-

- Some older products that we have may only be in standard format, but they can easily be converted to widescreen.
- To do this, please open the SlideTeam product in Powerpoint, and go to
- Design ( On the top bar) -> Page Setup -> and select "On-screen Show (16:9)” in the drop down for "Slides Sized for".
- The slide or theme will change to widescreen, and all graphics will adjust automatically. You can similarly convert our content to any other desired screen aspect ratio.
Compatible With Google Slides

Get This In WideScreen
You must be logged in to download this presentation.
PowerPoint presentation slides
Striking ROI calculation PowerPoint template. This presentation covers 22 professionally designed PowerPoint slides, all of them being 100% editable in PowerPoint. Offers wide variety of options and colors to alter the appearance. Allows adding of enterprise personal details such as brand name, logo and much more. Enough space available to enter text and its related points in the PPT table. High-resolution PowerPoint presentation backgrounds for better clarity of the information displayed. These PPT slides are available in both Standard and Widescreen slide size.
People who downloaded this PowerPoint presentation also viewed the following :
Content of this Powerpoint Presentation
Slide 1: This slide shows ROI Calculation with relevant imagery.
Slide 2: This is an Agenda slide. State company agendas here in a professional manner.
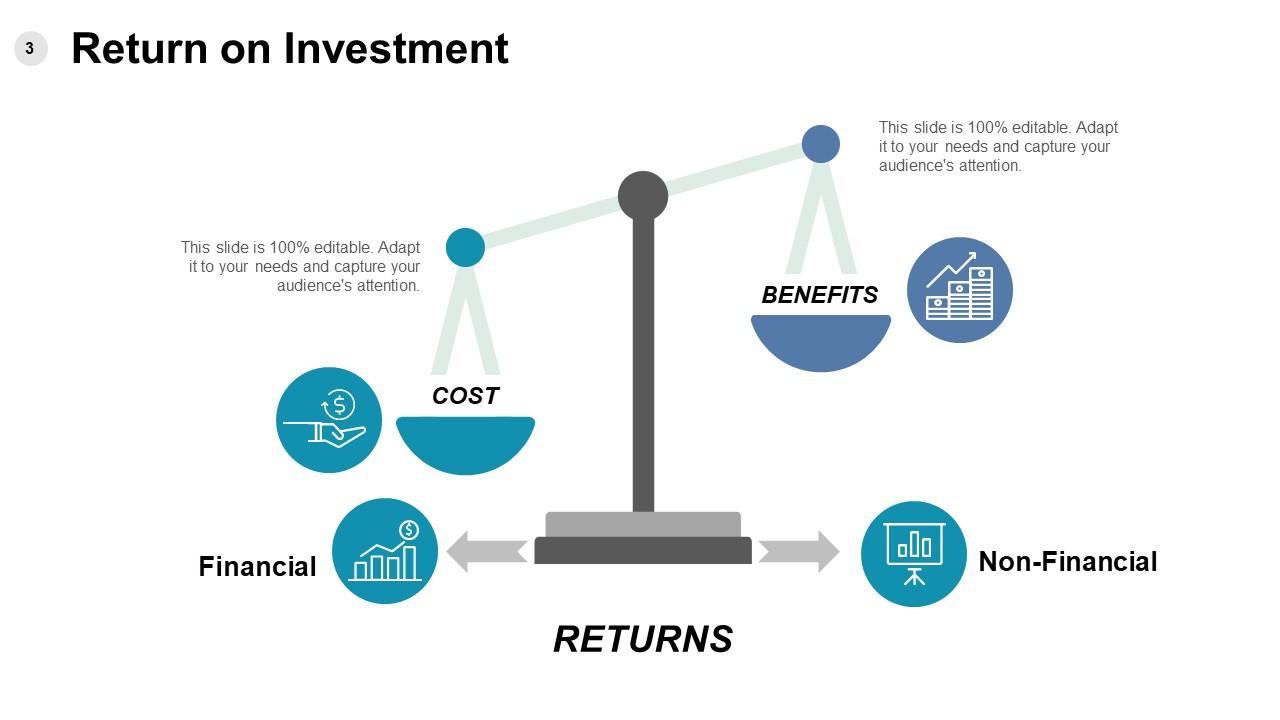
Slide 3: This is Return on Investment slide showing COST, BENEFITS, RETURNS, Non-Financial, Financial aspects.
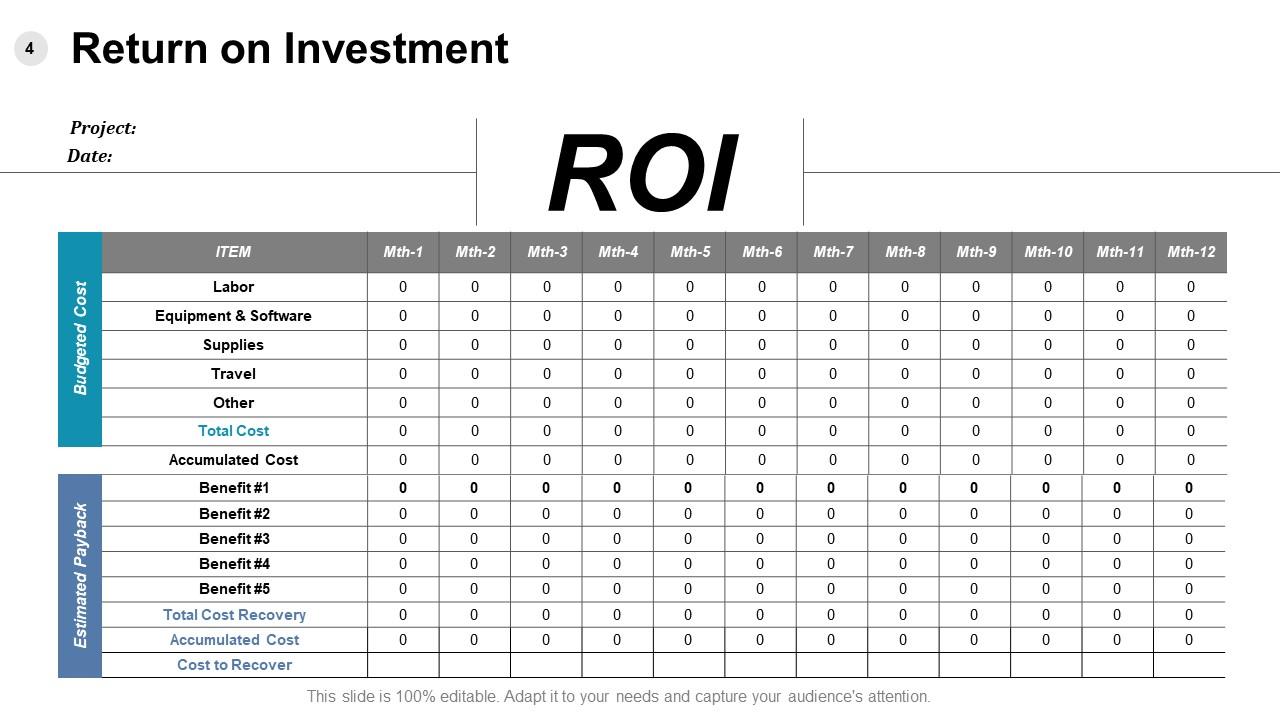
Slide 4: This is also a Return on Investment slide which shows Budgeted Cost, Estimated Payback.
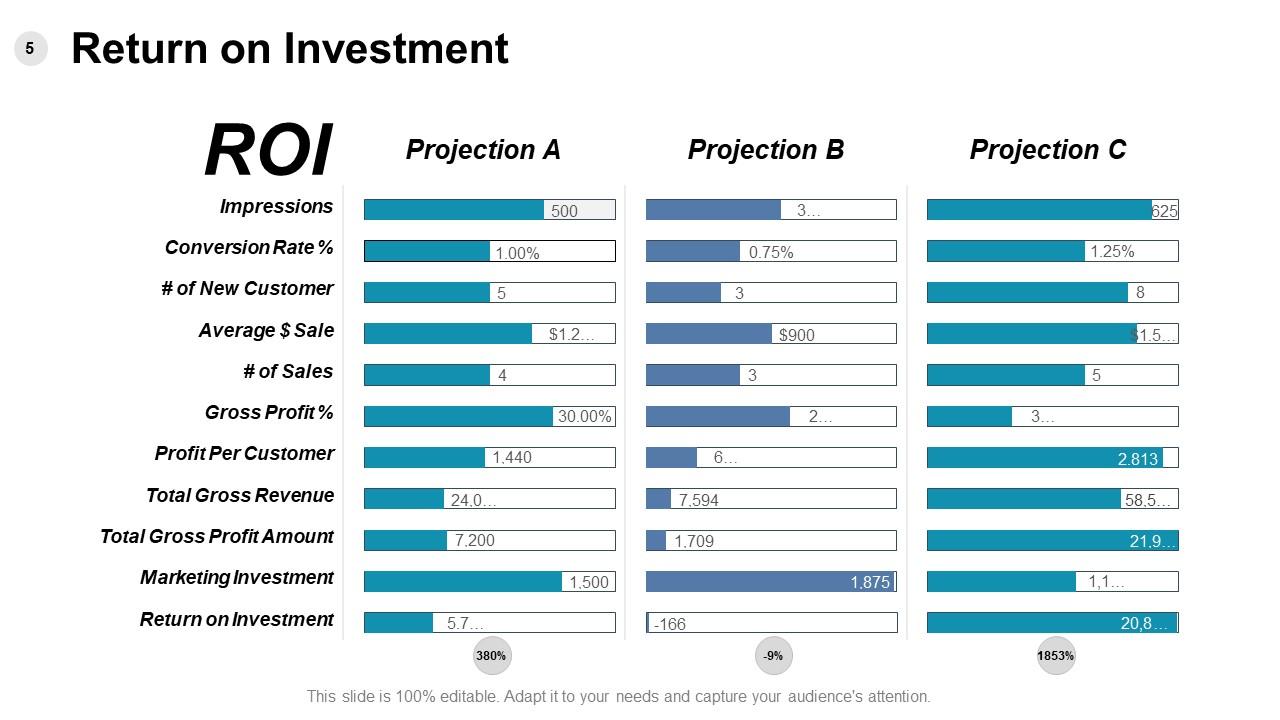
Slide 5: This is another slide showing Return on Investment of Projection A, Projection B and Projection C simultaneously.
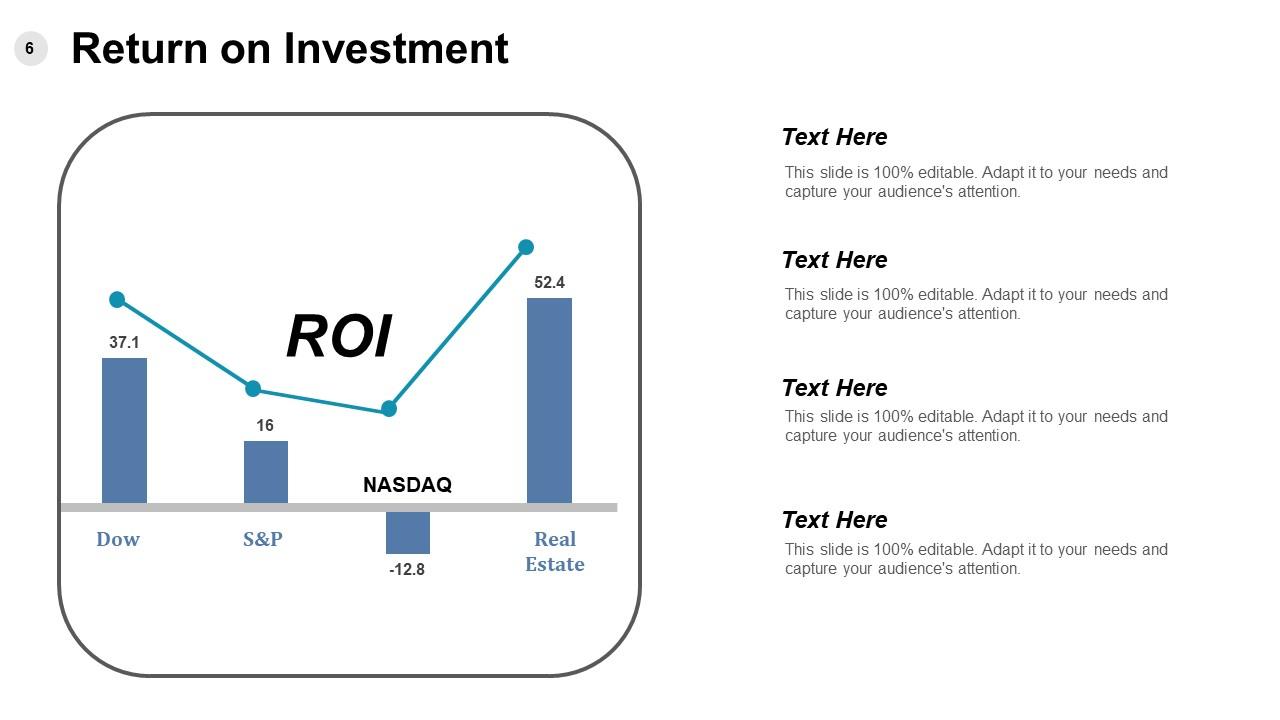
Slide 6: This slide shows the Return on Investment graph.
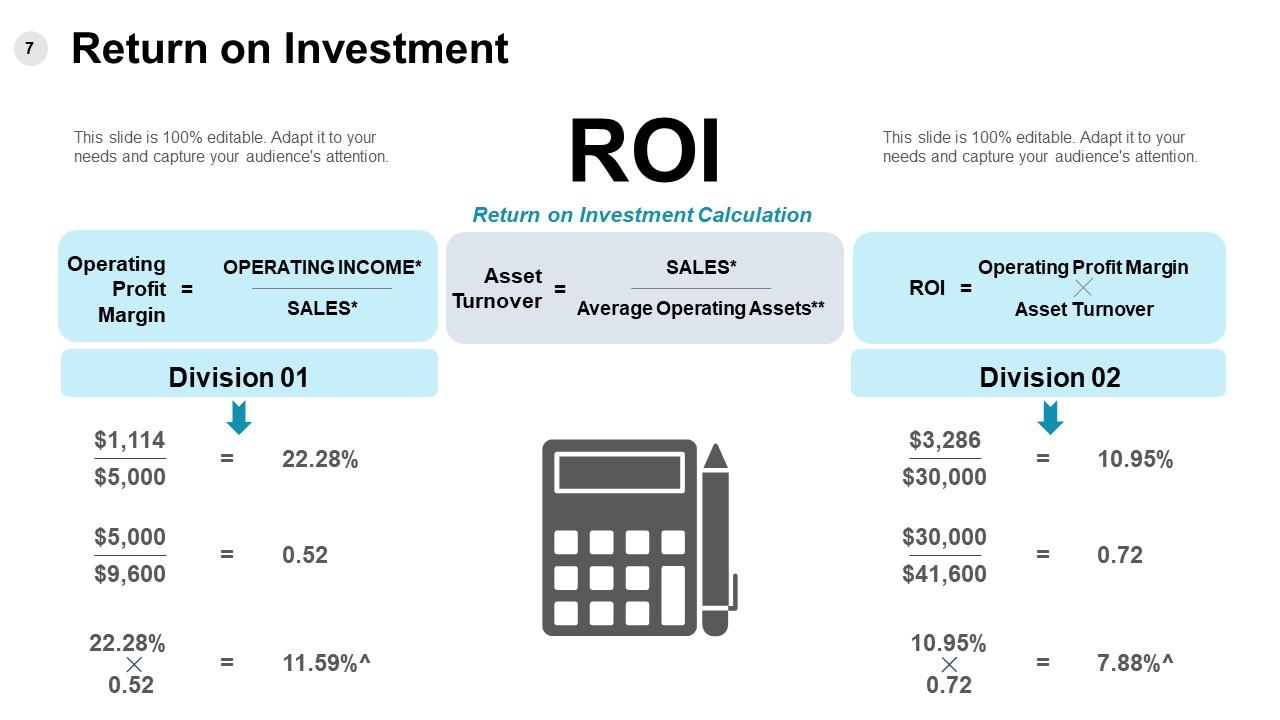
Slide 7: This too is a Return on Investment slide showing Return on Investment Calculation formula. Use this formula to calculate your own return on investment.
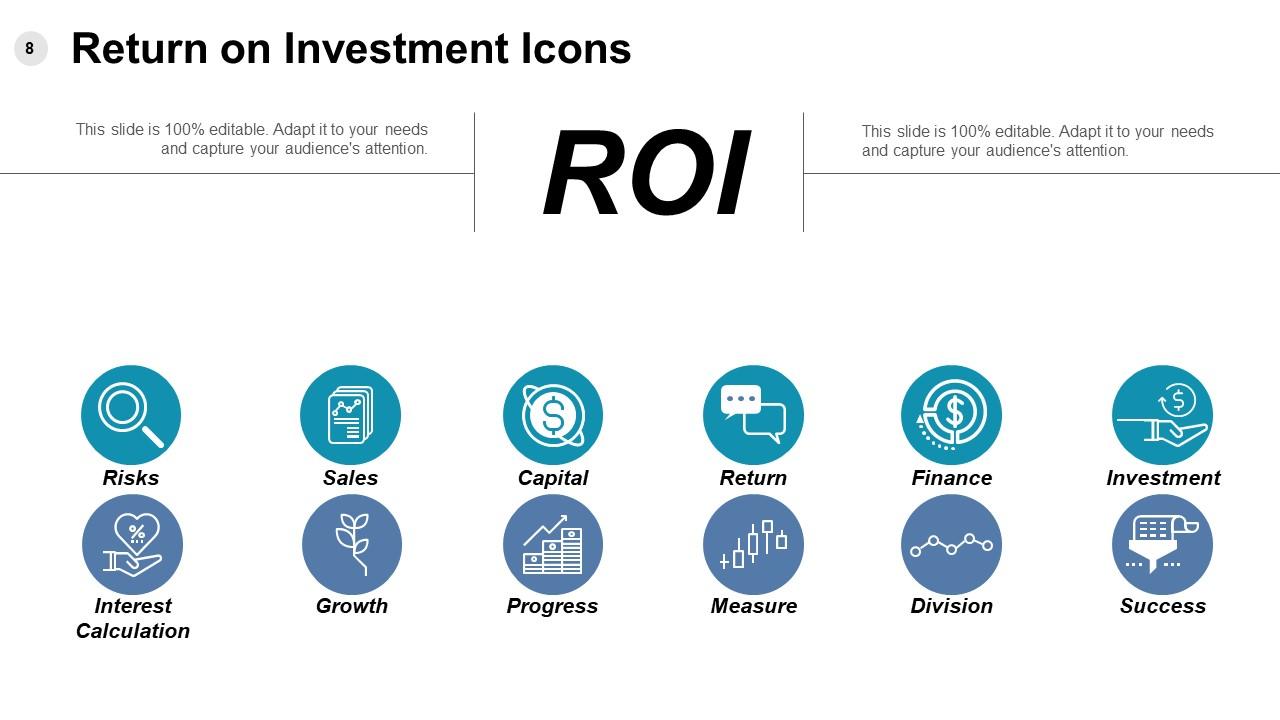
Slide 8: This slide displays Return on Investment Icons. Use as per your business requirement.
Slide 9: This slide is titled Additional Slides to move forward. You can change the slide content as per need.
Slide 10: This slide showcases Meet Our Team with designation, text boxes and image to fit.
Slide 11: This is a Quotes slide to convey company/ organization message, beliefs etc. You may change the slide content as per need.
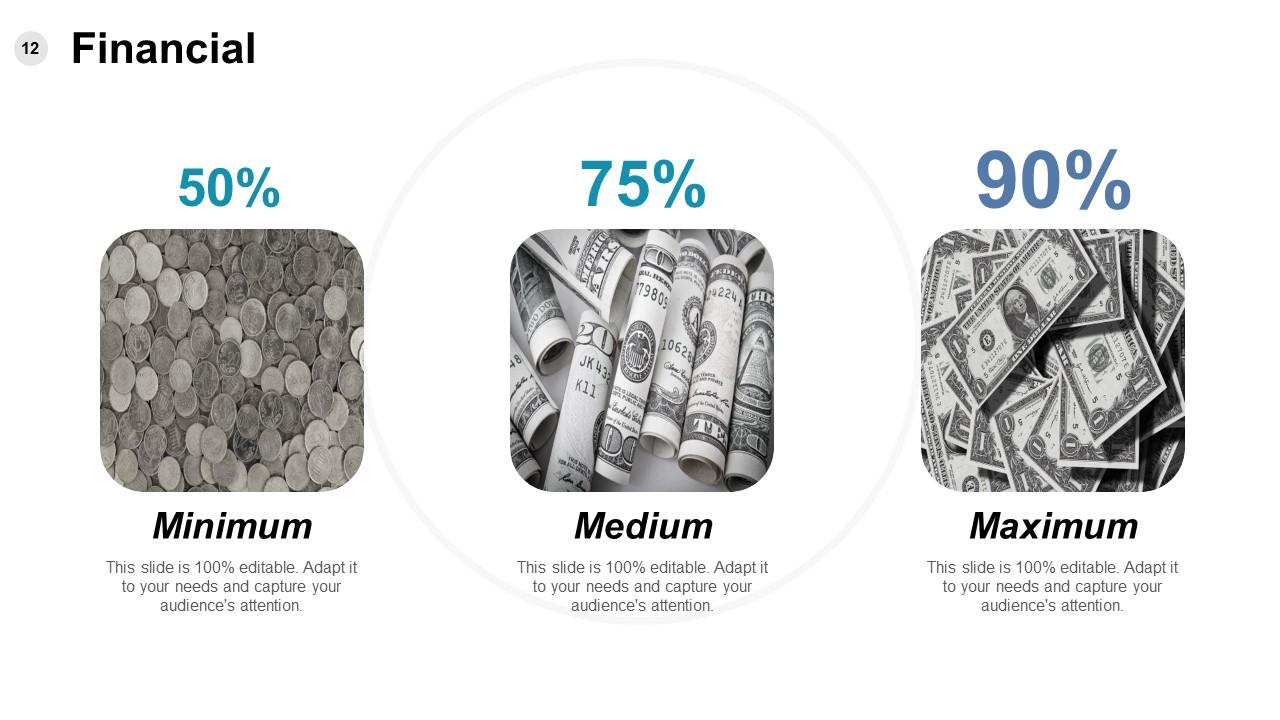
Slide 12: This slide shows Financial score. State financial aspects here.
Slide 13: This is a Mind Map image slide with text boxes to fill information.
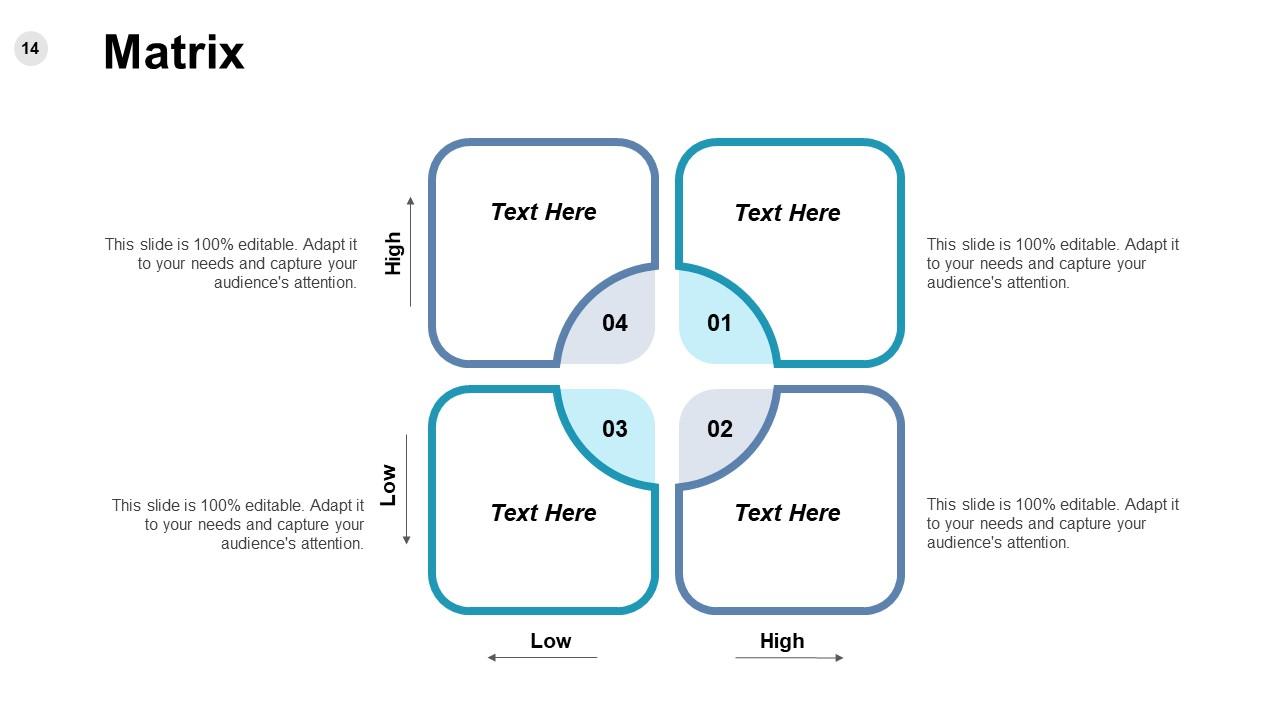
Slide 14: This is a MATRIX slide. Put relevant comparing data here.
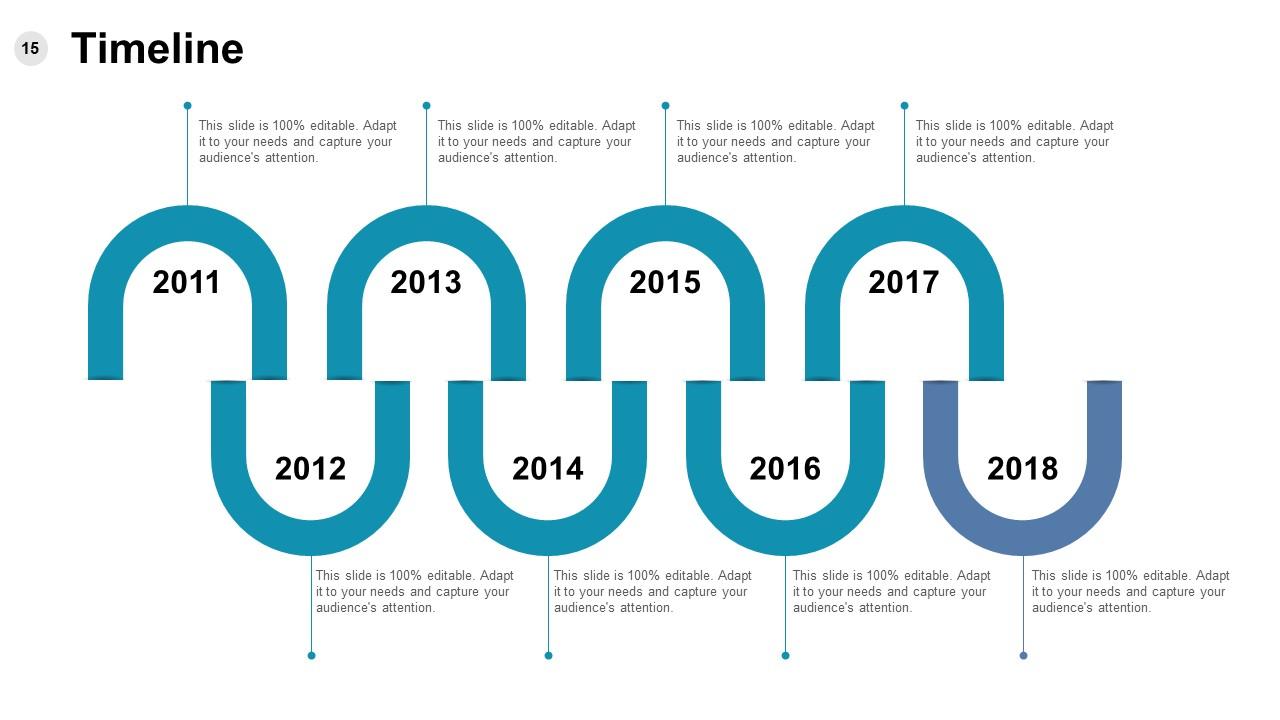
Slide 15: This is a Timeline slide to present important dates, journey, evolution, milestones etc.
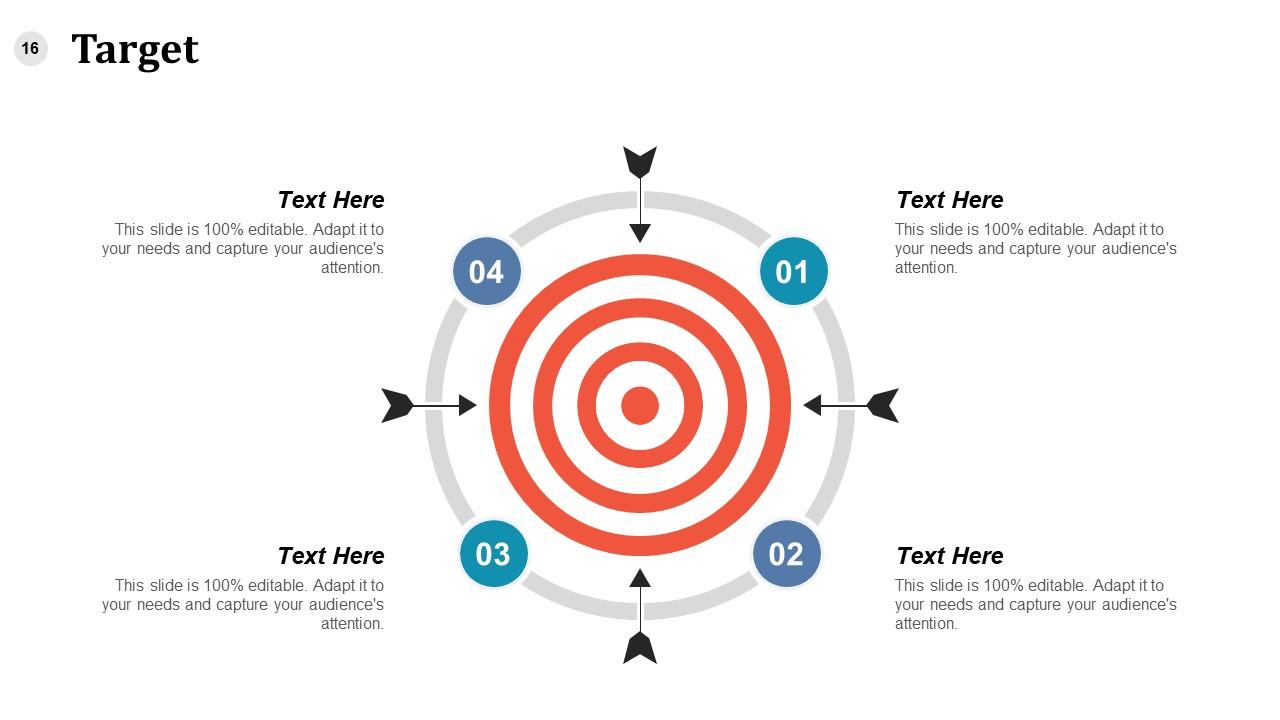
Slide 16: This is a Target image slide. State targets, etc. here.
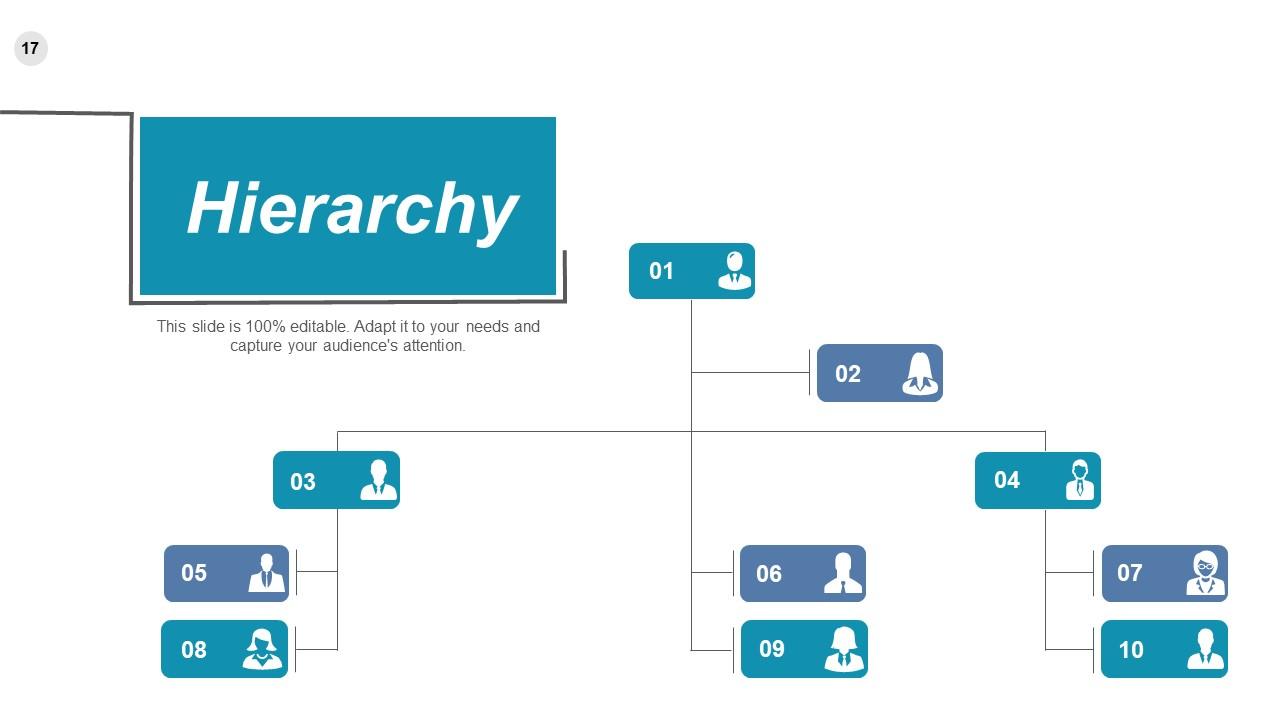
Slide 17: This is a Hierarchy image slide to show information, organization/ team structure, specifications etc.
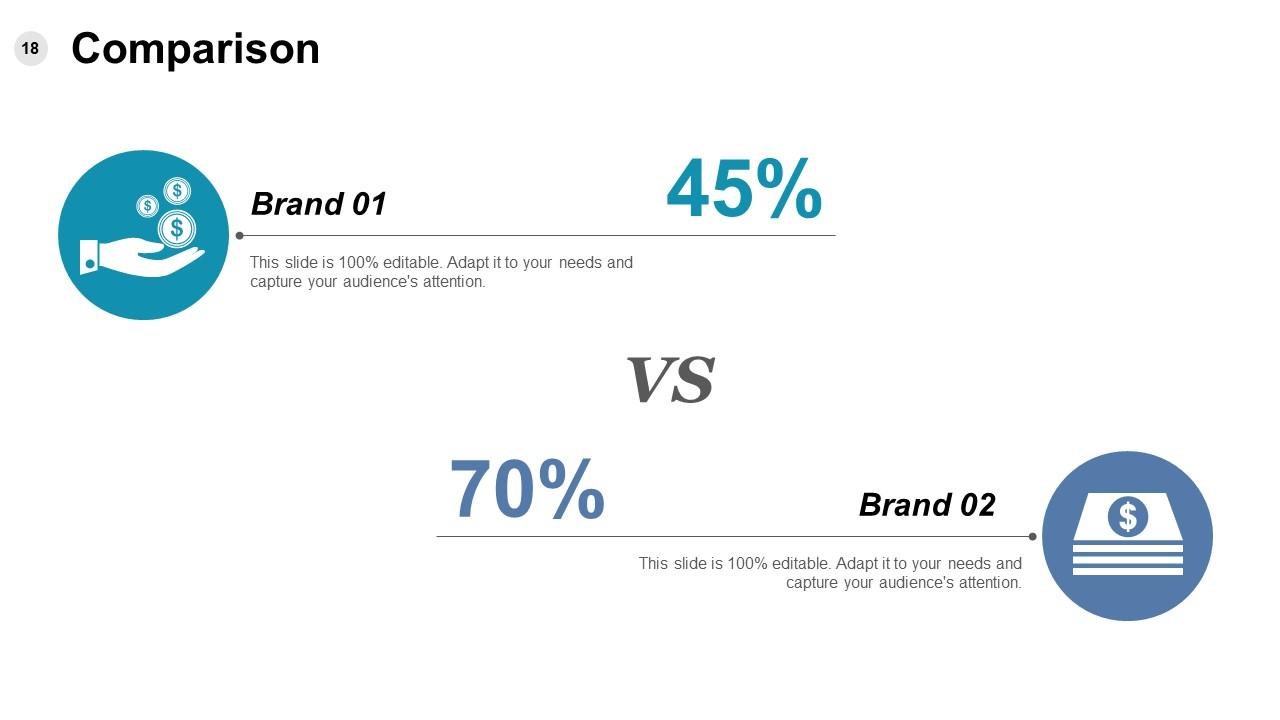
Slide 18: This slide shows a Comparison between two brands.
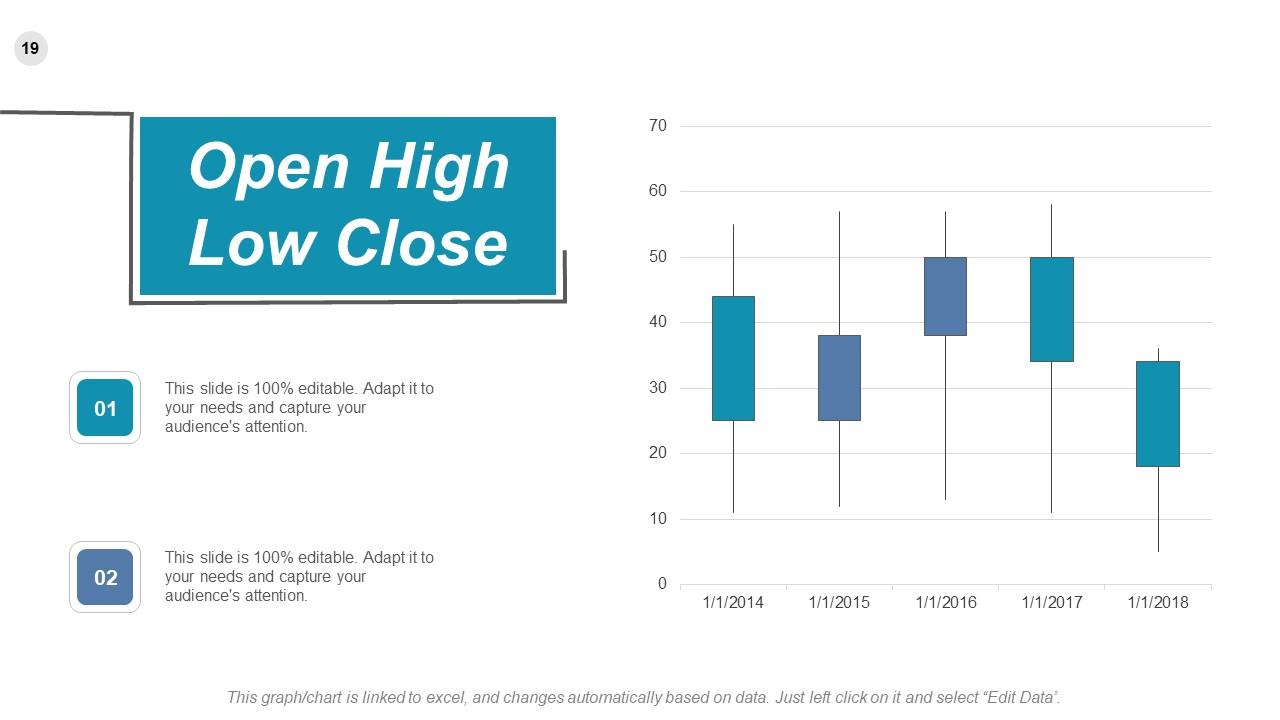
Slide 19: This is an Open High Low Close Chart slide to present product/ entity comparison, specifications etc.
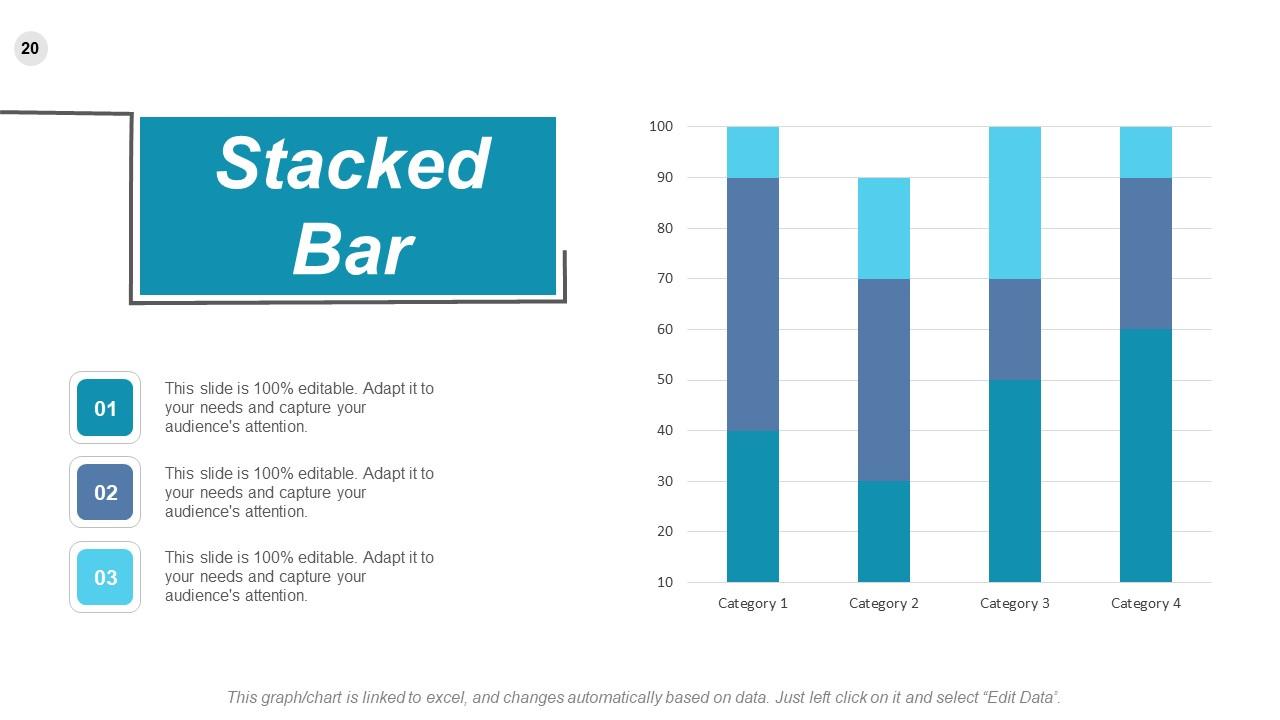
Slide 20: This is a Stacked Bar chart slide to present product/ entity comparison, specifications etc.
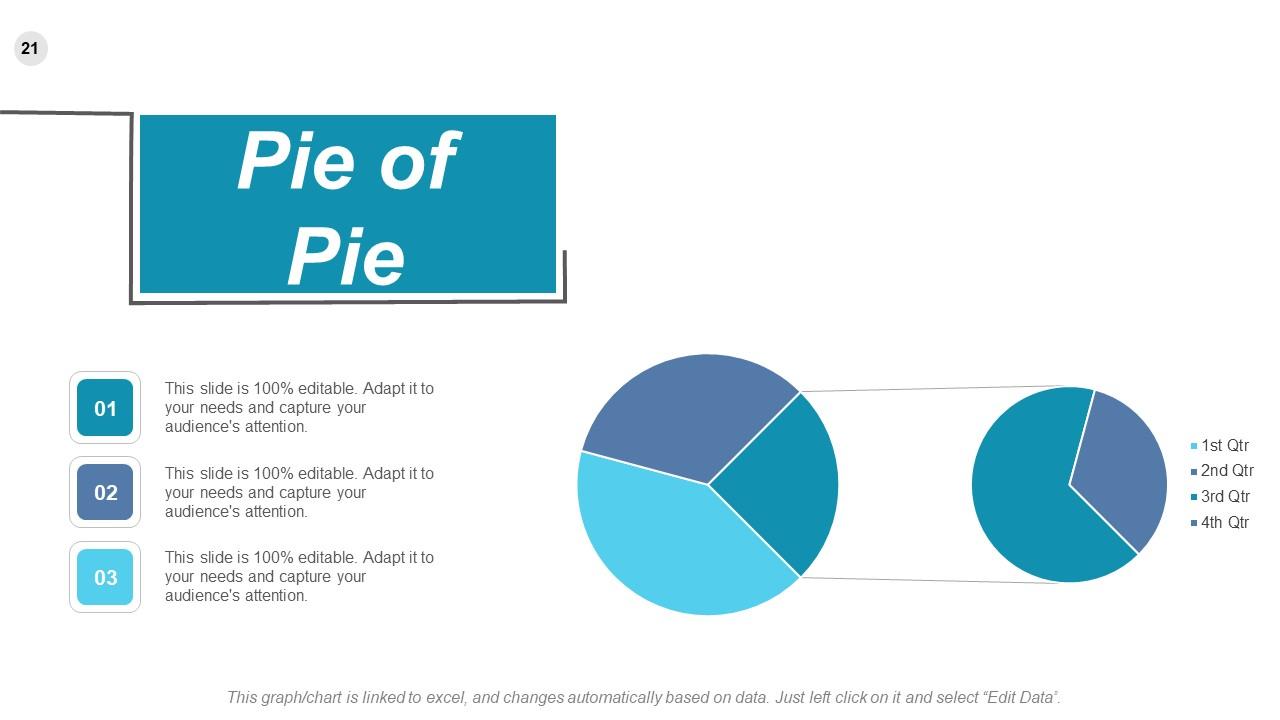
Slide 21: This is a Pie of Pie Chart slide to present product/ entity comparison, specifications etc.
Slide 22: This is Thank You slide stating Address# street number, city, state, Contact Numbers, Email Address.
Roi Calculation Powerpoint Presentation Slides with all 21 slides:
Identify good holiday destinations with our Roi Calculation Powerpoint Presentation Slides. Enumerate all the advantages in detail.
No Reviews


