Monthly Business Review Powerpoint PPT Template Bundles

Rating:
90%
Monthly Business Review Powerpoint PPT Template Bundles
Slide 1 of 15
Favourites Favourites

Try Before you Buy Download Free Sample Product

Audience Impress Your
Audience
Editable 100%
Editable
Time Save Hours
of Time
The Biggest Sale is ending soon in
0
0
:
0
0
:
0
0
Rating:
90%
If you require a professional template with great design, then this Monthly Business Review Powerpoint PPT Template Bundles is an ideal fit for you. Deploy it to enthrall your audience and increase your presentation threshold with the right graphics, images, and structure. Portray your ideas and vision using ten slides included in this complete deck. This template is suitable for expert discussion meetings presenting your views on the topic. With a variety of slides having the same thematic representation, this template can be regarded as a complete package. It employs some of the best design practices, so everything is well-structured. Not only this, it responds to all your needs and requirements by quickly adapting itself to the changes you make. This PPT slideshow is available for immediate download in PNG, JPG, and PDF formats, further enhancing its usability. Grab it by clicking the download button.

FAQs for Monthly Business Review Powerpoint

Start with the money stuff - revenue, margins, cash flow. That's your bread and butter. Customer acquisition costs and retention rates are huge too. I'm big on tracking employee satisfaction because miserable teams tank everything else. Industry-specific KPIs matter obviously, plus market share if you can get decent data on it. Honestly though? Stick to like 8-10 max. Leadership gets overwhelmed with too many dashboards. Focus on metrics that actually let you make decisions, not just pretty charts that look good in meetings.

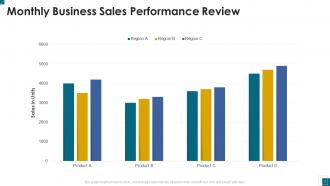
Honestly, visuals are a game-changer for MBRs. Nobody's gonna sit there and parse through endless spreadsheet cells - your brain just shuts off after like 5 minutes. Bar charts work great for comparing stuff, line graphs show trends over time, and heat maps are perfect for spotting performance gaps across different areas. The trick is matching your visual to what story you're actually telling. Oh, and don't cram everything onto one slide because people won't remember any of it. Keep each chart focused on one main point and you'll actually hold their attention.

Honestly, competitor analysis is like your reality check - shows where you actually stand vs where you think you stand. I'd pick 2-3 direct competitors and track the same stuff monthly: pricing changes, product launches, market share moves, any big strategic shifts. It's super easy to skip this when you're drowning in your own numbers, but that's literally when you need it most. Short sentences work better for spotting trends early. You'll catch things before you're scrambling to catch up, which... trust me, is way better than reacting after the fact.

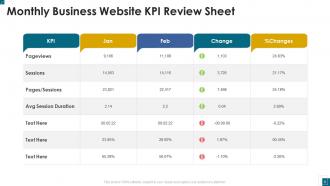
Honestly, just build a simple dashboard with green/yellow/red status lights for each initiative. Track maybe 2-3 key metrics per thing, plus any big milestones you hit or totally whiffed on. Don't get fancy with charts - I've watched so many teams waste time on beautiful reports nobody actually looks at. Tell the real story instead: what's working, what's completely stuck, and how you're gonna fix it. Oh, and add a quick "next month we're doing..." bit for each one. Keeps everyone on the same page without making your monthly review feel like watching paint dry.

Definitely grab your finance, sales, marketing, and ops leads - that's your core group right there. Finance owns the budget stuff, sales knows what's actually happening with deals, marketing can speak to lead quality (which honestly matters way more than volume), and ops will call out any workflow issues. Product team too if you're tracking feature adoption or rolling out new stuff. Just don't go overboard with invites. Map out your main KPIs first, then figure out who actually owns each metric. You want people who can explain why numbers moved, not just read them off a dashboard.

Give yourself at least a week to gather everything - trust me, you don't want to be pulling numbers the night before. Hit up your CRM, analytics, whatever financial systems you use. I throw it all into a basic spreadsheet because switching between different dashboards mid-meeting is the worst. Look for trends, not just single data points. Honestly, the executives care way more about what the numbers actually mean than the raw data itself. Have 2-3 solid insights ready to go, plus what you think the team should do about any weird patterns you've found.

Honestly, just turn your boring data into actual stories. Don't say "sales dropped 15%" - explain how that March supply chain mess pissed off customers and tanked Q2. Way more memorable than spreadsheets, trust me. Structure it like any good story: here's the problem, here's what we tried, here's how it worked out. Oh and try opening sections with something like "Here's what we found when we actually looked at the numbers..." People eat that stuff up. Our brains are just wired for stories over raw data.

Don't just dump every number you have onto slides - people zone out instantly. I learned this the hard way lol. Focus on trends and what you're actually doing about the data instead of just reading stats at everyone. Make it interactive too, not some boring hour-long monologue. Honestly, stakeholders care about specific stuff, so figure out what matters to them rather than just showing what's easiest to track. Stick to maybe 3-5 main points max. And always wrap up each section with concrete next steps or decisions that need to happen.

Honestly, I always make two different versions of the same presentation because it saves so much headache. Stakeholders want the big picture stuff – revenue numbers, key wins, where you're headed strategically. Don't bog them down with operational details or they'll check out. Your team needs the opposite though. Give them the real talk: what's working, what's broken, who's crushing it, what roadblocks you're hitting. Oh and timing matters too – execs think in quarters while your team needs weekly updates. Before you even start building anything, just ask each group what decisions they're trying to make. Makes everything way easier.

Dude, start with Tableau or Power BI - they'll automatically pull your data so you're not stuck doing everything manually. Canva's got solid business templates that actually look fresh instead of those boring PowerPoint decks everyone's tired of. Google Data Studio works great too if you're already using their stuff, plus it's free which is nice. Monday.com or Notion are clutch for tracking all those follow-up tasks that somehow always get forgotten. My advice? Don't go crazy trying to implement everything at once. Pick one dashboard tool and stick with it until your team gets the hang of it.

Start every MBR by going through old action items - seriously, this is where most meetings become useless because people just ignore follow-ups. Keep a tracker that rolls forward anything incomplete with new deadlines and owners. Each item needs a specific person and actual date, not some wishy-washy "sometime next month" garbage. Honestly, if something keeps getting delayed meeting after meeting, either give it to someone else or just scrap it. Wrap up by confirming new action items and shoot them out within a day so they don't disappear into the void.

Oh man, MBRs with global teams are tricky. Different cultures handle feedback completely differently - some are brutally direct, others hint around issues. The time zone thing sucks, but honestly the bigger problem is communication styles. Like, people from certain cultures won't speak up in groups even when they're sitting on game-changing info. Plus there's the whole hierarchy thing - some won't question leadership or admit screwups publicly. I'd say set ground rules early, maybe hop on quick calls with your key regions beforehand. Then always circle back privately to dig up what people didn't share.

Honestly, those boring MBRs are the worst. Try data storytelling sessions instead - have teams turn their metrics into actual stories. Speed rounds work too where each department gets like 3 minutes max to share wins and problems. Dashboard walkthroughs beat those soul-crushing PowerPoints every time. Mix things up by letting different departments run the meeting, or do deep dives into specific KPIs that actually matter. Oh, and async video updates with live Q&A after? Game changer. Just get people talking about the data instead of sitting there half-asleep.

Honestly, just make someone own each task before everyone leaves the room. Like, write "Sarah will do X by Friday" - not "the team will handle it" because that's where good ideas go to die. Set up a shared doc everyone can see and actually start your next meeting by going through what got finished. Send those slightly annoying reminder emails a couple days before deadlines too. The whole point is making it weird if someone doesn't deliver. I know it sounds pushy but celebrating the wins when people follow through really works.

Dude, startup MBRs are brutal. Your numbers bounce around like crazy each month - it's impossible to tell what's actually a trend vs just random chaos. Historical data? What historical data lol. You can't do those nice year-over-year comparisons that big companies love. And let's be real, you're probably doing data collection between like three other jobs because that's startup life. Your team keeps changing, KPIs shift every time you pivot, and half the time you're measuring experiments anyway. Honestly, I'd focus on 3-month rolling averages instead of monthly changes. Smooths out all that noise.

Ratings and Reviews

90% of 100
Review Form
Write a review
Most Relevant Reviews
  1. 80%

    by Byrne Cruz

    Appreciate the research and its presentable format.
  2. 100%

    by Clay Castillo

    Awesomely designed templates, Easy to understand.

2 Item(s)

per page: