Pencil bar graph for data driven analysis powerpoint slides
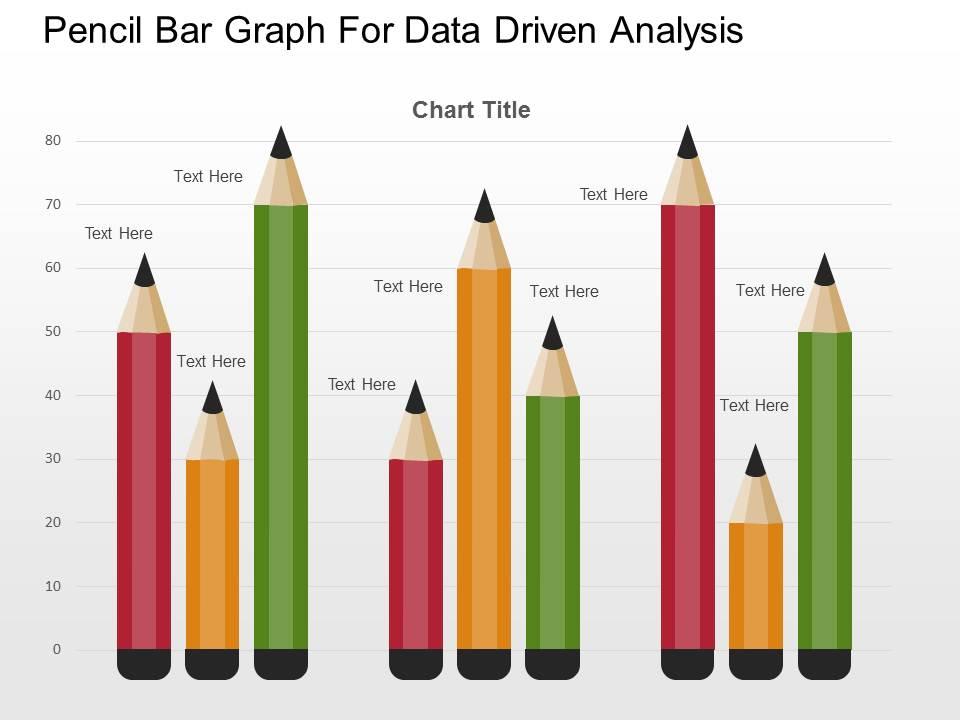
Want to showcase your data in a creative way? Here is the solution with our creative pencil bar graph for data driven analysis business PowerPoint Slide Design. Bar Graphs are very useful for sales managers, researchers, strategists and marketing people for drawing out effective conclusions. This PowerPoint Template Diagram has been designed with graphic of pencil and bar graph. This bar graph is data driven and can be used for business and trend analysis. Use this PPT Slide can be used for marketing and business related presentations. A bar graph is a chart that uses bars to show comparisons between categories of data. The bars can be either horizontal or vertical. To make the slide look more interesting and visually appealing, we have inserted a pencil graphics such that the audience get attracted towards the slide. This type of chart is easy to interpret. These charts are useful for displaying data that is classified into nominal or odinal categories. So don’t waste your time thinking and download this pencil bar graph for data driven analysis PPT Slide. Light up the sky with our Pencil Bar Graph For Data Driven Analysis Powerpoint Slides. Enthrall your audience with your bright ideas.
- Google Slides is a new FREE Presentation software from Google.
- All our content is 100% compatible with Google Slides.
- Just download our designs, and upload them to Google Slides and they will work automatically.
- Amaze your audience with SlideTeam and Google Slides.
-
Want Changes to This PPT Slide? Check out our Presentation Design Services
- WideScreen Aspect ratio is becoming a very popular format. When you download this product, the downloaded ZIP will contain this product in both standard and widescreen format.
-

- Some older products that we have may only be in standard format, but they can easily be converted to widescreen.
- To do this, please open the SlideTeam product in Powerpoint, and go to
- Design ( On the top bar) -> Page Setup -> and select "On-screen Show (16:9)” in the drop down for "Slides Sized for".
- The slide or theme will change to widescreen, and all graphics will adjust automatically. You can similarly convert our content to any other desired screen aspect ratio.
Compatible With Google Slides

Get This In WideScreen
You must be logged in to download this presentation.
PowerPoint presentation slides
Pre-designed PPT Template for marketing professionals, researchers, analysts, sales executives, etc. for data driven analysis. Colors, text and font can be easily changed as the PPT slide is completely editable. You can also add company logo, trademark or name. Easy and fast downloading process. Unaffected high resolution even after customization. This PPT Slide is available in both Standard and Widescreen slide size.
People who downloaded this PowerPoint presentation also viewed the following :
Pencil bar graph for data driven analysis powerpoint slides with all 3 slides:
Hand pick our Pencil Bar Graph For Data Driven Analysis Powerpoint Slides for your convenience. Their excellence is an airtight guarantee.
-
Colors used are bright and distinctive.
-
Great product with highly impressive and engaging designs.


