Pmp process chart it powerpoint presentation slides
Try Before you Buy Download Free Sample Product
Audience
Editable
of Time
Process Charts are one of the simpler forms of workflow charting that depicts the various stages of a process in a logical order. Every process chart consists of actions, the roles in charge of carrying them out, and the inputs and outputs for each step. Here is a professionally designed template on the PMP Process Chart IT that can assist the project managers in representing the development process in the form of a visual chart. The proposal includes a set of slides covering different process charts, knowledge areas, progress groups, activities, and deliverables. It incorporates Project management process chart utilizing a table that presents the information in a legible format. Also, it employs slides that talk about five different phases of the PMP Process chart. Using this process chart slide will help you better organize your organizational tasks and increase efficiency. Managers can use our template to achieve their goal of clarity and transparency, which will increase the success rates of their projects. To present their current position to clients, one can even mention details about their company, target audience, premium services, client values, financials, etc. Book a free demo with our experts and customize this 100 percent editable template. Get access now.
People who downloaded this PowerPoint presentation also viewed the following :
Content of this Powerpoint Presentation
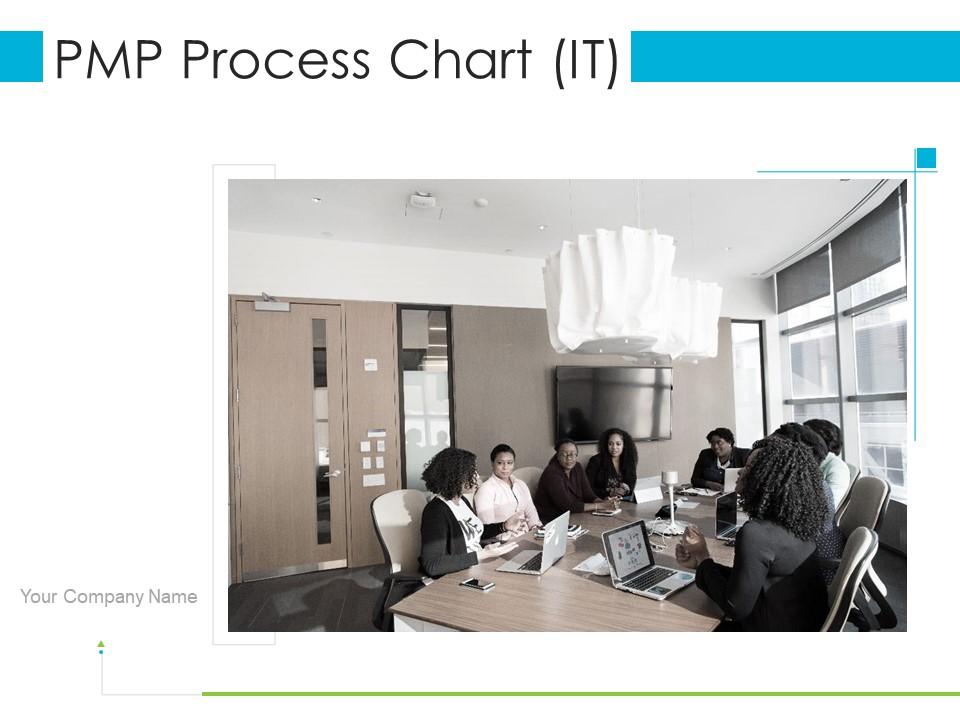
Slide 1: This slide displays title i.e. 'PMP Process Chart (IT)' and your Company Name.
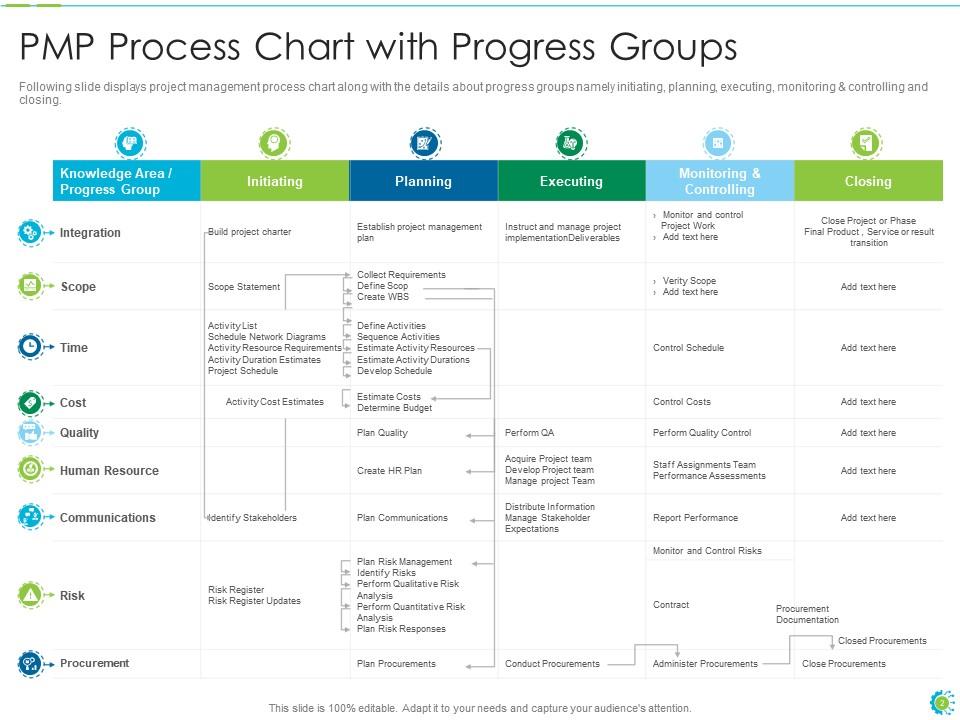
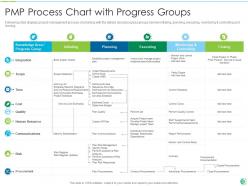
Slide 2: This slide displays project management process chart along with the details about progress groups.
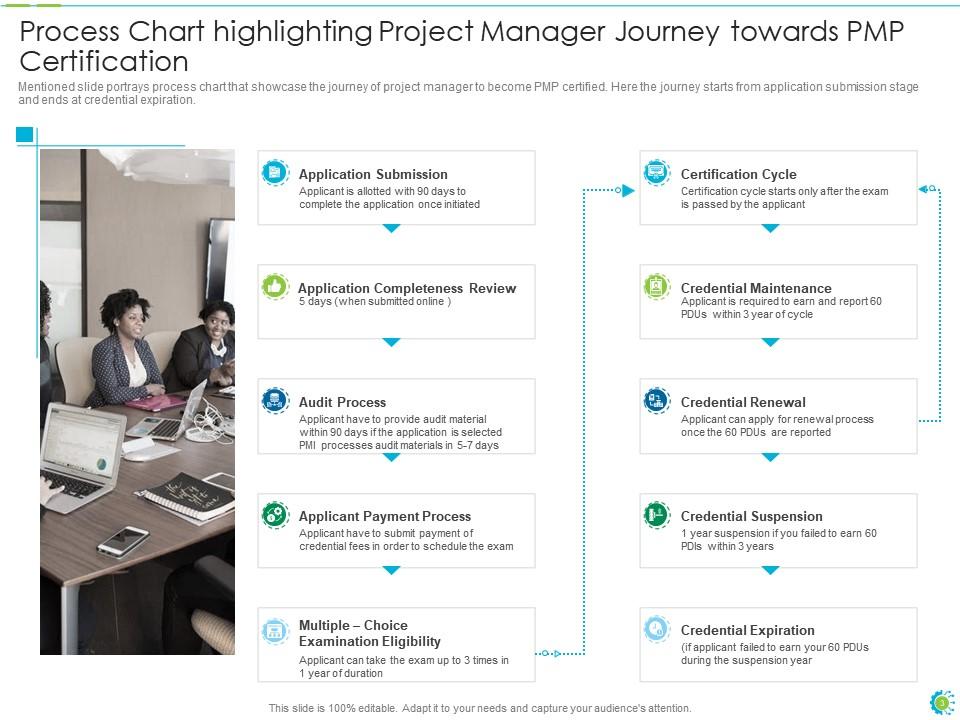
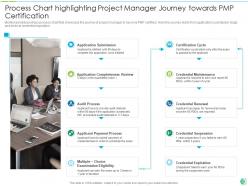
Slide 3: This slide portrays process chart that showcase the journey of project manager to become PMP certified.
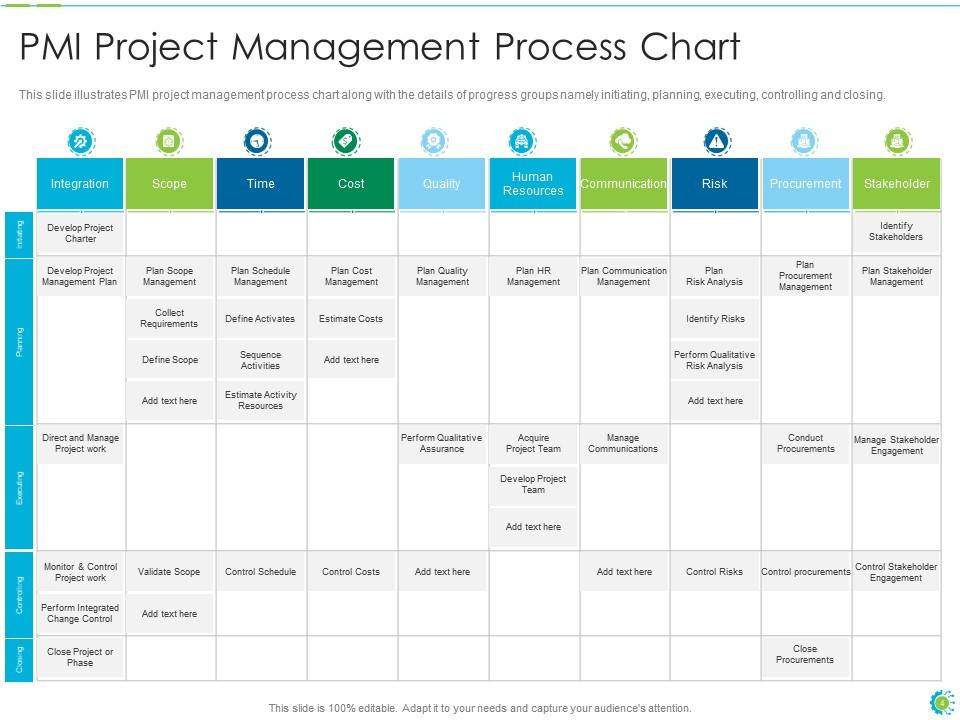
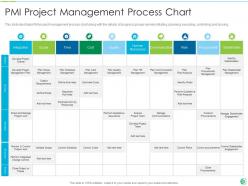
Slide 4: This slide illustrates PMI project management process chart along with the details of progress groups.
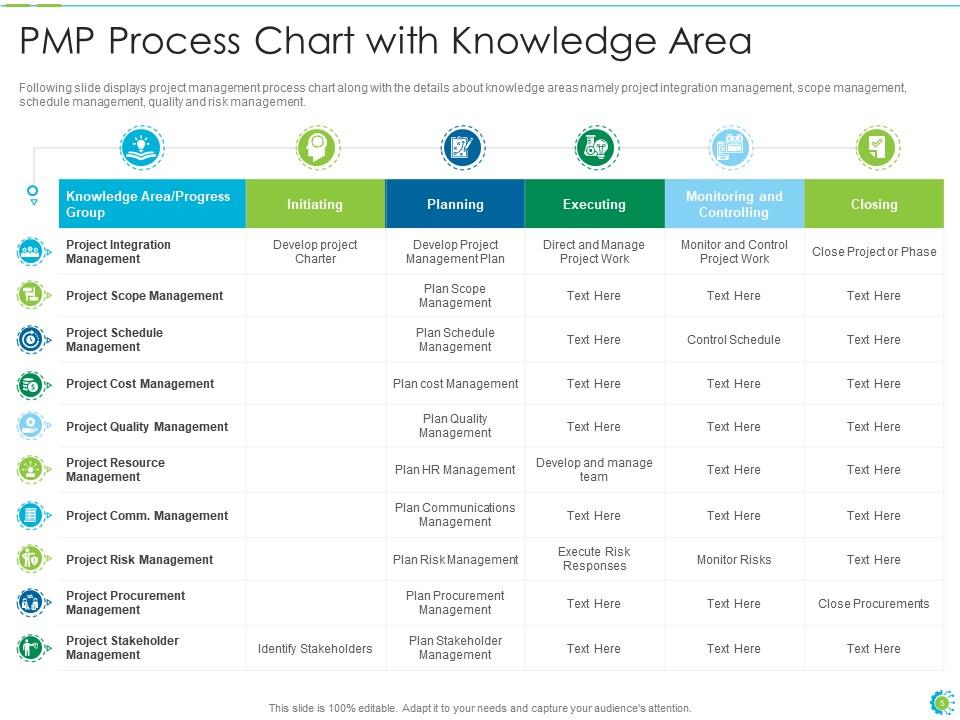
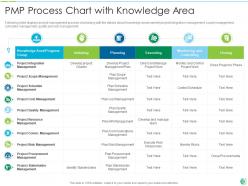
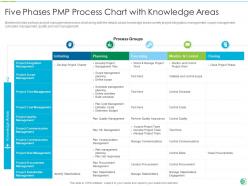
Slide 5: This slide displays project management process chart along with the details about knowledge areas.
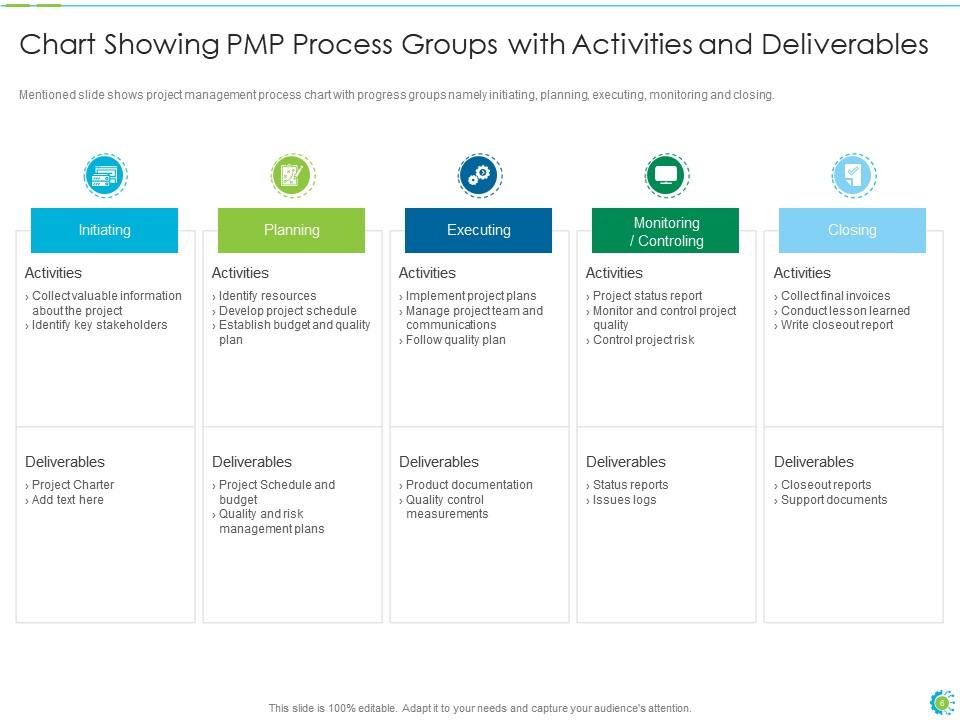
Slide 6: This slide shows project management process chart with progress groups.
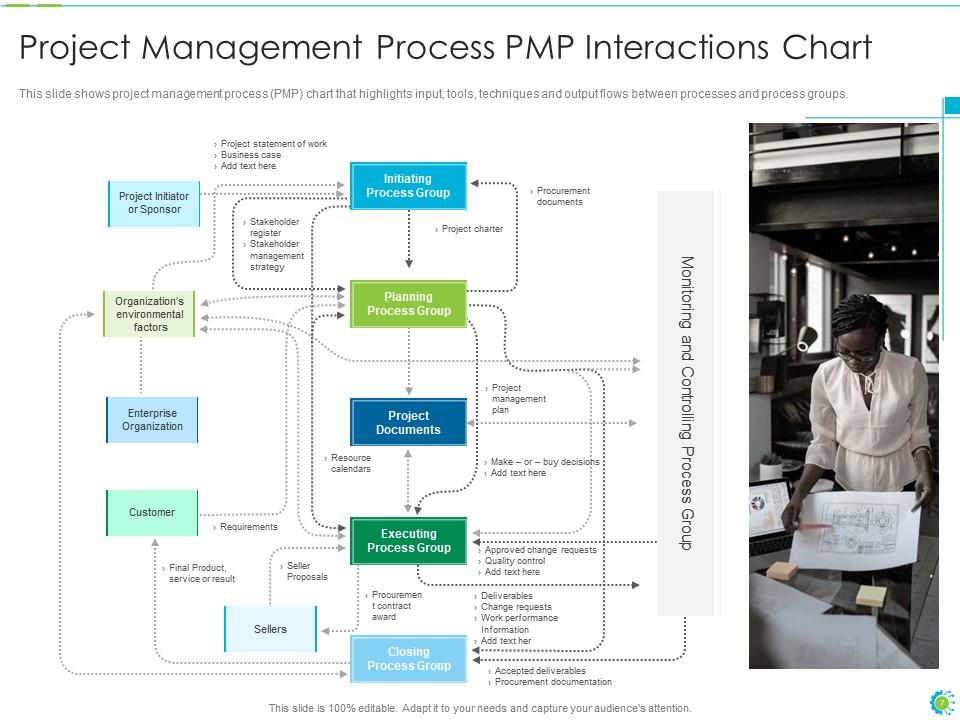
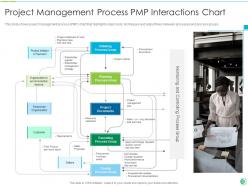
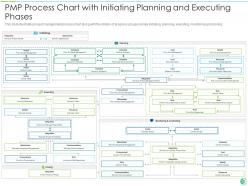
Slide 7: This slide shows project management process (PMP) chart that highlights input, tools, etc.
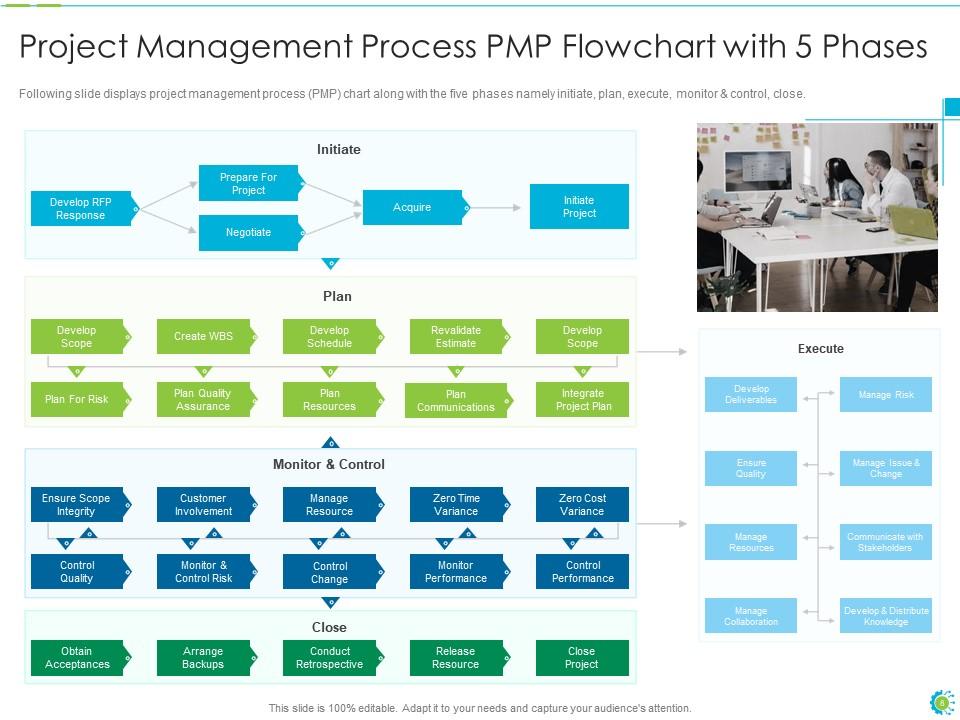
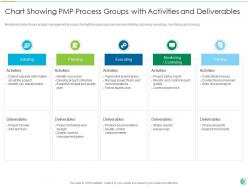
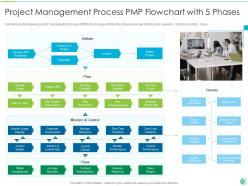
Slide 8: This slide displays project management process (PMP) chart along with the five phases.
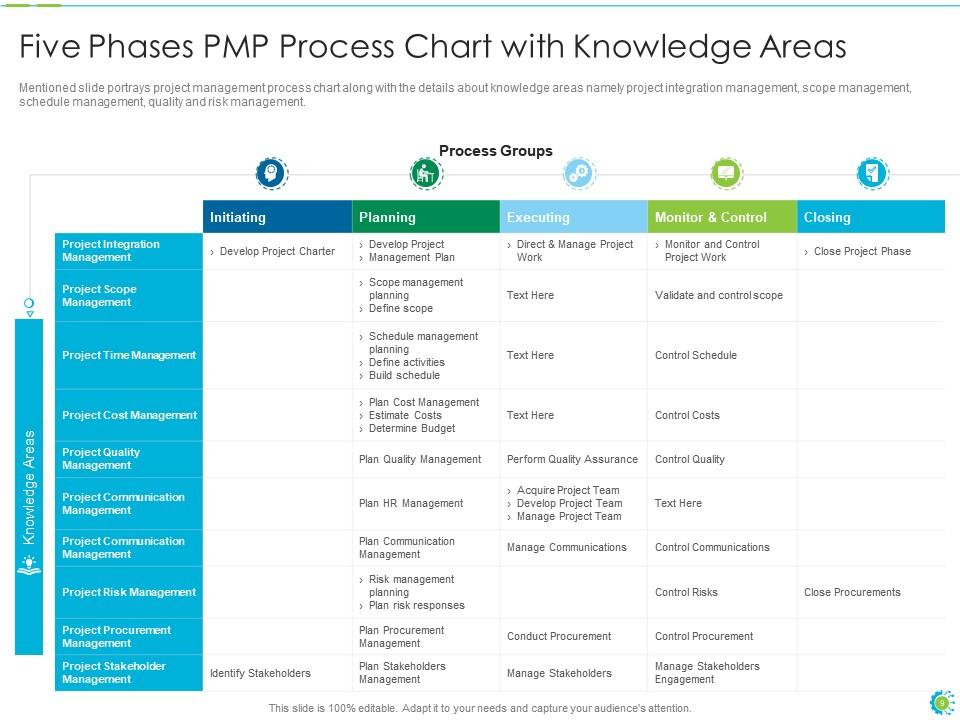
Slide 9: This slide portrays project management process chart along with the details about knowledge areas.
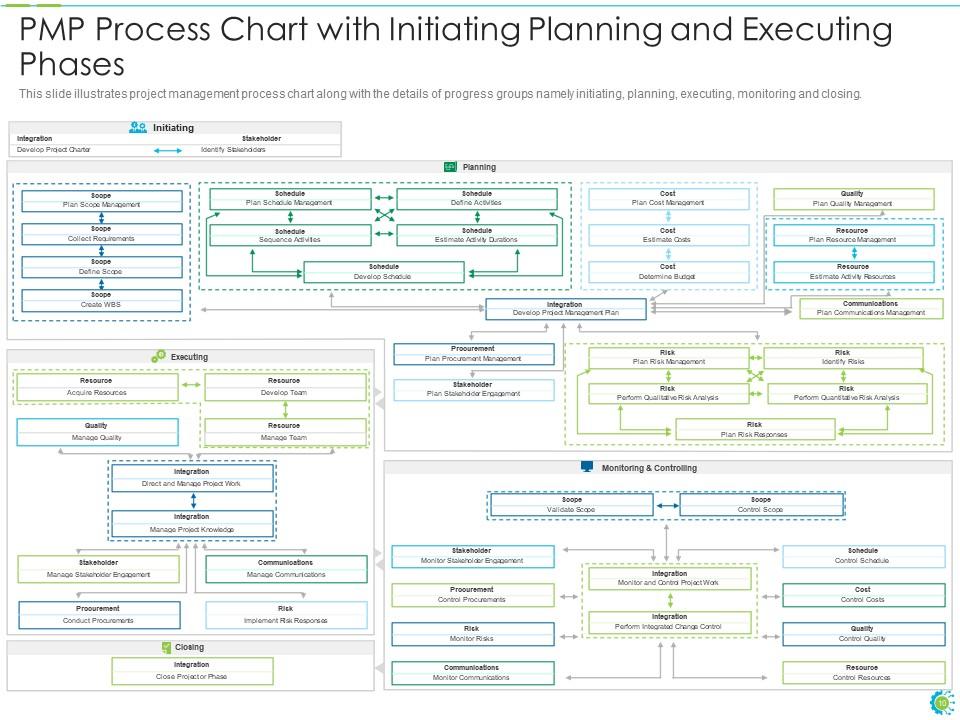
Slide 10: This slide illustrates project management process chart along with the details of progress groups.
Slide 11: This is the icons slide.
Slide 12: This slide presents title for additional slides.
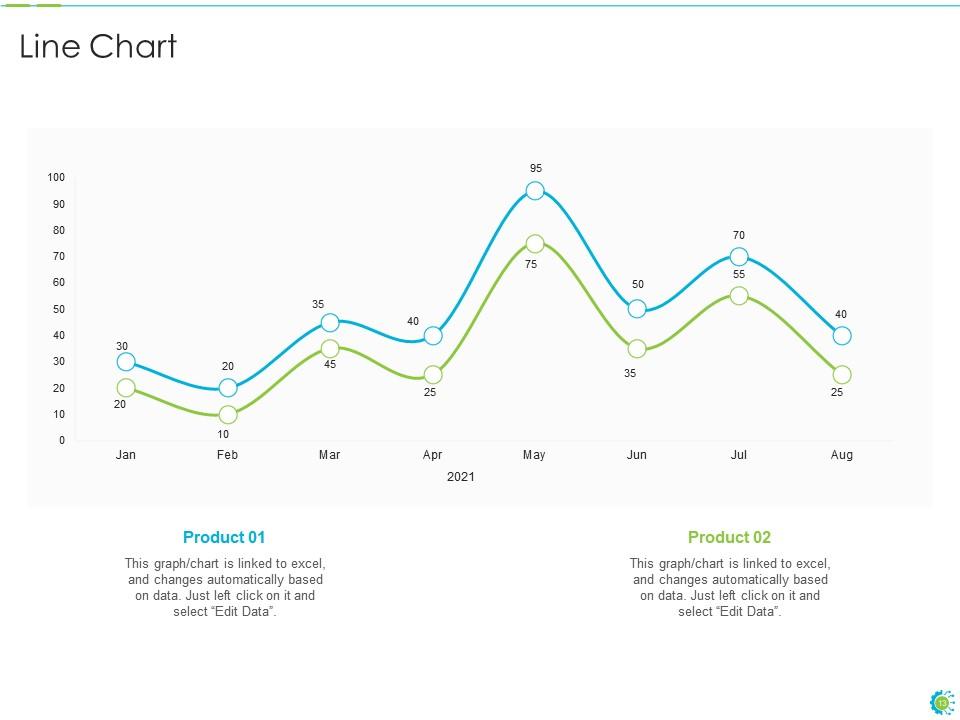
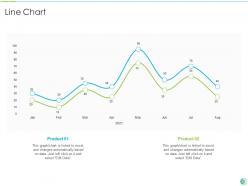
Slide 13: This slide exhibits monthly line charts for different products. The charts are linked to Excel.
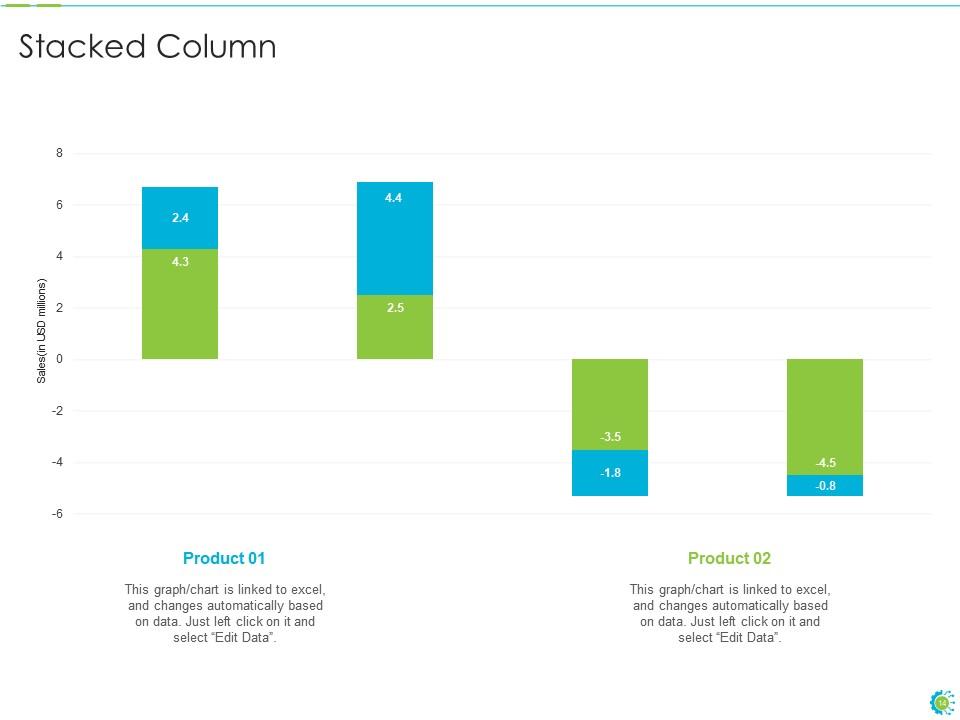
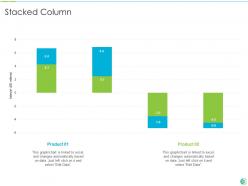
Slide 14: This slide displays sales stacked column charts for different products. The charts are linked to Excel.
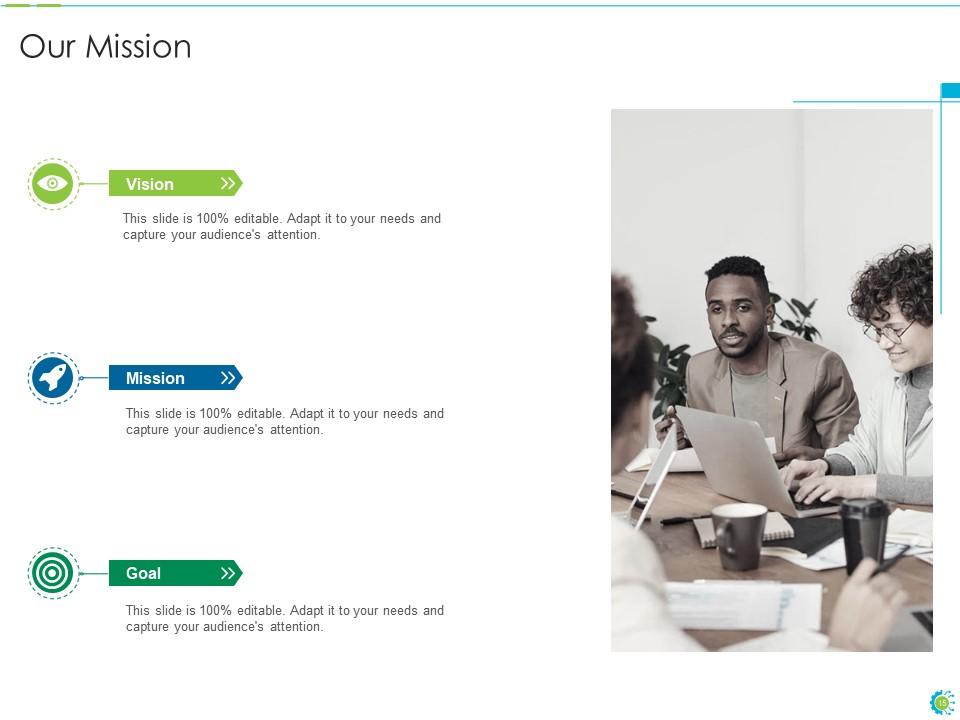
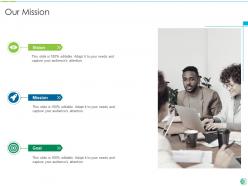
Slide 15: This slide presents your company's vision, mission and goals.
Slide 16: This slide shows about your company, target audience and its client's values.
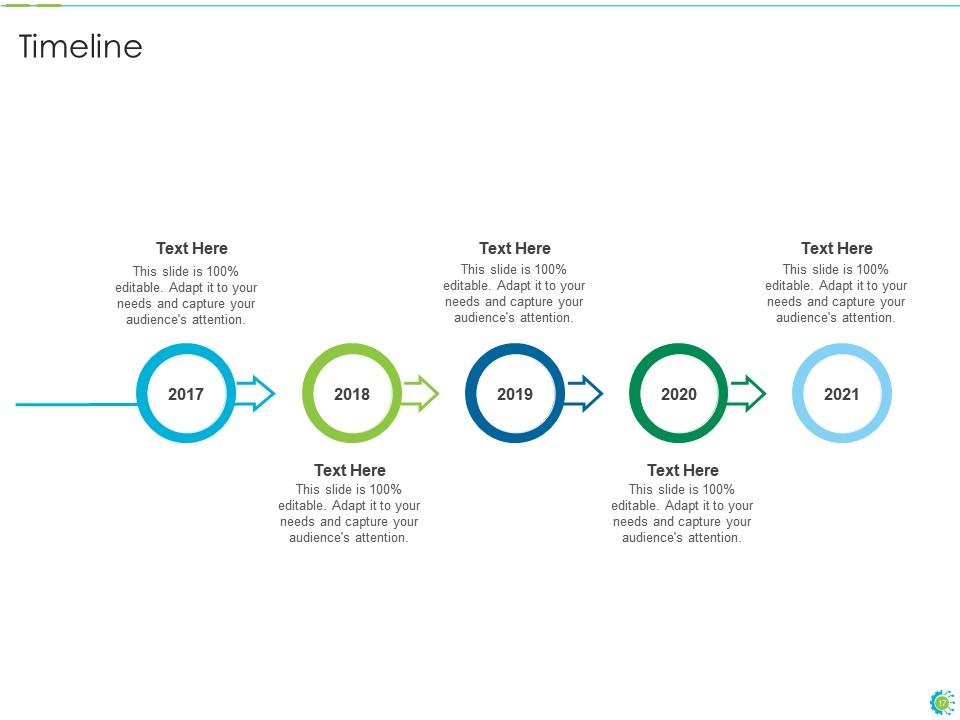
Slide 17: This slide exhibits yearly timeline.
Slide 18: This slide depicts posts for past experiences of clients.
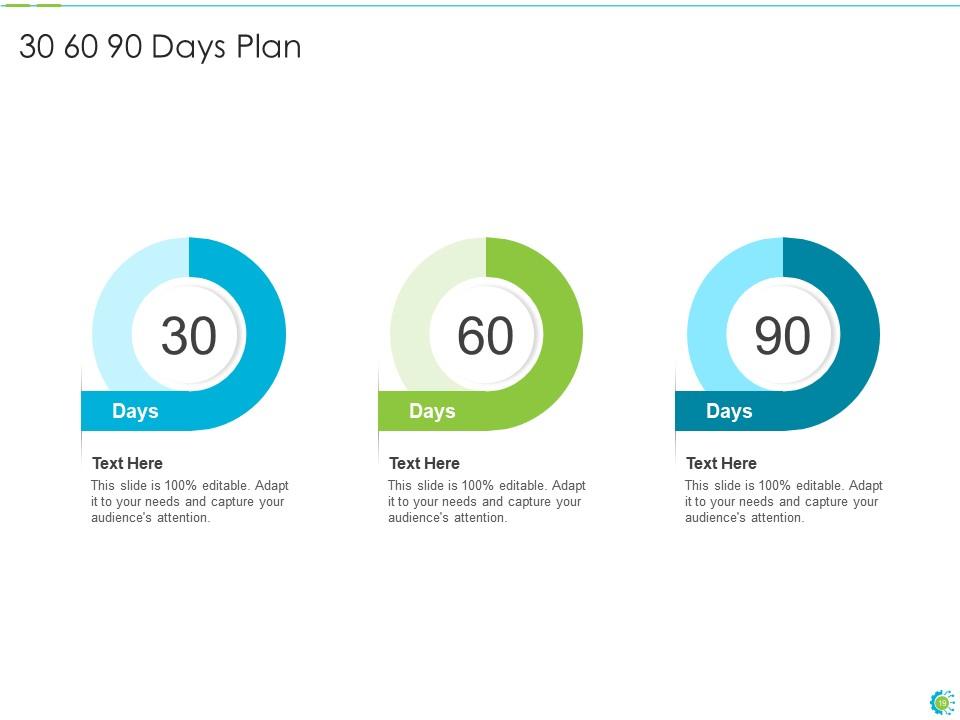
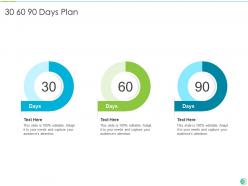
Slide 19: This slide depicts 30-60-90 days plan for projects.
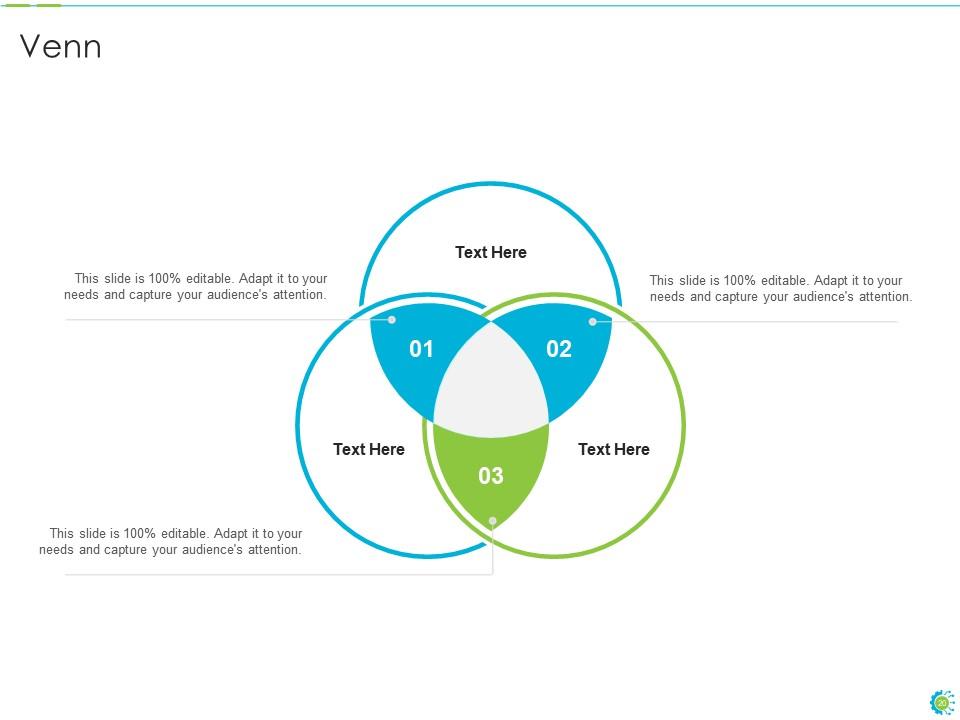
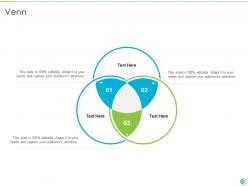
Slide 20: This slide displays Venn.
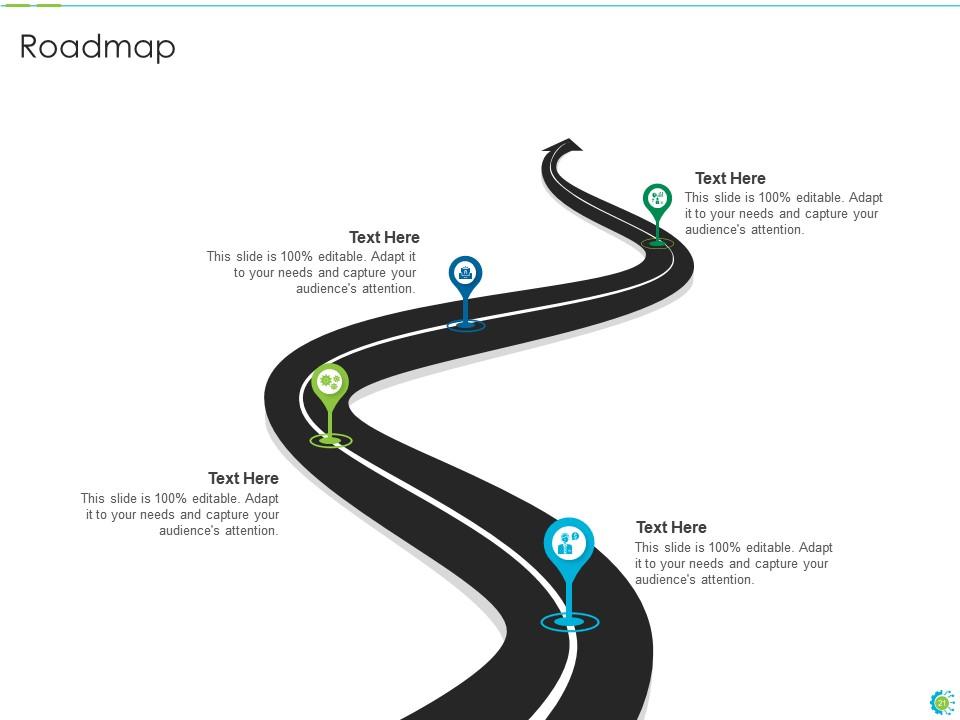
Slide 21: This slide shows roadmap.
Slide 22: This is thank you slide & contains contact details of company like office address, phone no., etc.
Pmp process chart it powerpoint presentation slides with all 22 slides:
Use our PMP Process Chart IT Powerpoint Presentation Slides to effectively help you save your valuable time. They are readymade to fit into any presentation structure.
FAQs for Pmp process chart it
The PMP Process Chart provides a comprehensive visual framework that maps the 49 project management processes across five process groups and ten knowledge areas, enabling project managers to understand workflow dependencies, identify critical touchpoints, and ensure systematic project execution. This strategic tool streamlines project planning by clarifying process relationships and sequencing, ultimately delivering improved project outcomes and enhanced organizational efficiency.
The PMP Process Chart assists in visualizing project phases by mapping initiation, planning, executing, monitoring, and closing stages with clear process flows, dependencies, and deliverables. Through visual representation, project managers can identify critical pathways, resource allocation points, and milestone connections, while stakeholders gain comprehensive understanding of project progression, ultimately enabling better coordination, risk management, and strategic decision-making across complex project lifecycles.
The five process groups in the PMP Process Chart are Initiating, Planning, Executing, Monitoring and Controlling, and Closing. These structured phases guide project managers through comprehensive project delivery by defining clear objectives, developing detailed roadmaps, implementing strategic activities, and ensuring quality outcomes, ultimately enabling organizations to deliver projects on time, within budget, and meeting stakeholder expectations.
The PMP Process Chart enhances project communication by providing visual clarity on information flows, stakeholder touchpoints, and communication requirements across all process groups. Through structured mapping of inputs, outputs, and stakeholder interactions, project managers can identify communication gaps, streamline reporting processes, and ensure consistent messaging, ultimately delivering improved stakeholder engagement and reduced project risks.
A PMP Process Chart enhances stakeholder understanding by providing clear visual mapping of project workflows, dependencies, timelines, and decision points throughout the project lifecycle. This transparency enables stakeholders across different departments to grasp their roles, anticipate deliverables, and align expectations, while project managers can facilitate more productive discussions and secure stronger buy-in for critical milestones.
**INPUT**: What is the difference between the input, tools, techniques, and output in the PMP Process Chart? **OUTPUT**: In PMP Process Charts, inputs are resources and information required to start processes, tools and techniques are methods used to transform inputs, and outputs are deliverables produced. These components work systematically together, with many project managers finding that this structured approach streamlines project execution, enhances resource allocation, and ultimately delivers more predictable outcomes across complex organizational initiatives.
The PMP Process Chart facilitates project planning and execution by providing a visual framework that maps all 49 project management processes across five process groups and ten knowledge areas. This comprehensive tool enables project managers to identify process dependencies, ensure proper sequencing, and maintain systematic oversight throughout project lifecycles, ultimately delivering improved coordination, reduced oversight gaps, and enhanced project success rates across organizations.
The PMP Process Chart streamlines risk management by mapping risk identification, assessment, response planning, and monitoring activities across project phases, ensuring systematic coverage and accountability. Through structured visualization, project managers enhance risk visibility, accelerate response times, and maintain consistent mitigation strategies, with many organizations finding that integrated process mapping ultimately delivers better risk outcomes and project success rates.
Organizations can customize PMP Process Chart by adapting process groups to project complexity, industry requirements, stakeholder needs, and organizational maturity levels. Through tailored templates, companies streamline project workflows, enhance team collaboration, and ensure regulatory compliance, with many finding that customized charts improve delivery timelines, reduce resource conflicts, and ultimately deliver better project outcomes across diverse portfolios.
Common mistakes include overcomplicting workflows with unnecessary steps, failing to align processes with PMBOK standards, neglecting stakeholder input during chart development, and creating static documents that aren't regularly updated. These oversights can lead to confusion among team members, reduced project efficiency, and compliance issues, with many project managers finding that simplified, collaborative approaches ultimately deliver better adoption rates and clearer communication across all project phases.
PMP Process Charts should be updated during major project phase transitions, scope changes, and milestone reviews, typically aligning with project management plan updates and change control processes. Many project managers find that quarterly reviews or after significant deliverables work effectively, ensuring the chart reflects current processes while maintaining team alignment and stakeholder transparency throughout evolving project requirements.
Popular software tools for creating PMP Process Charts include Microsoft Visio, Lucidchart, Draw.io, SmartDraw, and Creately, along with project management platforms like Microsoft Project and Smartsheet. These tools streamline process mapping by offering pre-built templates, collaborative editing, and integration capabilities, with many project teams finding that cloud-based solutions enhance accessibility and real-time updates.
Including a PMP Process Chart in project documentation enhances project clarity, streamlines communication among stakeholders, ensures adherence to standardized methodologies, facilitates risk identification, and improves resource allocation tracking. These visual frameworks enable project managers to maintain consistent oversight across complex initiatives, with many organizations finding that structured process documentation reduces project delays by 25-30% while significantly improving team coordination and deliverable quality.
Visuals like the PMP Process Chart enhance project management training by simplifying complex frameworks, illustrating process interconnections, and providing clear reference points for knowledge retention. These visual tools enable new project managers to grasp methodologies faster, reduce learning curves significantly, and apply standardized practices more effectively, ultimately delivering improved project outcomes and accelerated professional development.
Emerging trends in PMP Process Charts for agile projects include interactive digital dashboards, real-time progress visualization, integrated sprint tracking, and hybrid methodologies that blend traditional and agile approaches. These enhanced charts streamline project oversight by incorporating kanban boards, automated milestone updates, and stakeholder collaboration tools, with many organizations finding that visual process integration ultimately delivers faster project cycles and improved team alignment.
-
Innovative and attractive designs.