Data analytic magnifying glass bar graph
The SlideTeam team has put together a few amazing data analytics powerpoint templates to help you get started. These templates will give you the ability to easily create graphs and charts that show your data in a clear and concise way. With these tools, you can quickly spot trends and patterns in your data that may not have been visible before. So what are you waiting for? Download our free templates today and start getting insights into your business data like never before.
The SlideTeam team has put together a few amazing data analytics powerpoint templates to help you get started. These templa..
- Google Slides is a new FREE Presentation software from Google.
- All our content is 100% compatible with Google Slides.
- Just download our designs, and upload them to Google Slides and they will work automatically.
- Amaze your audience with SlideTeam and Google Slides.
-
Want Changes to This PPT Slide? Check out our Presentation Design Services
- WideScreen Aspect ratio is becoming a very popular format. When you download this product, the downloaded ZIP will contain this product in both standard and widescreen format.
-

- Some older products that we have may only be in standard format, but they can easily be converted to widescreen.
- To do this, please open the SlideTeam product in Powerpoint, and go to
- Design ( On the top bar) -> Page Setup -> and select "On-screen Show (16:9)” in the drop down for "Slides Sized for".
- The slide or theme will change to widescreen, and all graphics will adjust automatically. You can similarly convert our content to any other desired screen aspect ratio.
Compatible With Google Slides

Get This In WideScreen
You must be logged in to download this presentation.
PowerPoint presentation slides
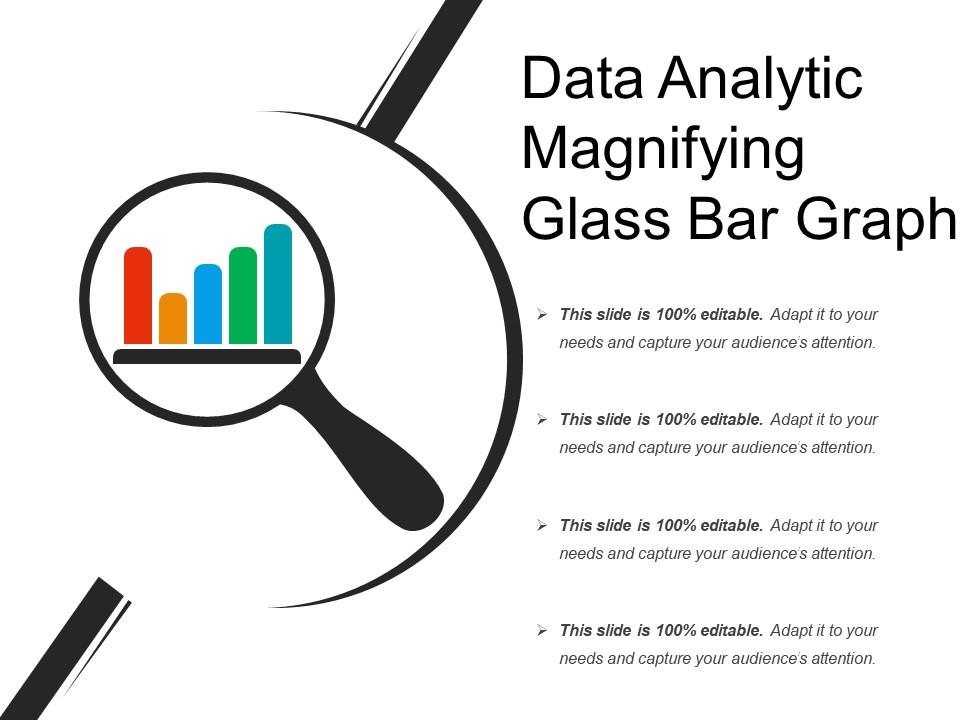
Presenting data analytic magnifying glass bar graph. This is a data analytic magnifying glass bar graph. This is a one stage process. The stages in this process are data analytics icons, information analytics icons, content analytics icons.
People who downloaded this PowerPoint presentation also viewed the following :
Data analytic magnifying glass bar graph with all 5 slides:
Use our Data Analytic Magnifying Glass Bar Graph to effectively help you save your valuable time. They are readymade to fit into any presentation structure.
-
It saves your time and decrease your efforts in half.
-
Great designs, really helpful.
-
Very unique, user-friendly presentation interface.
-
Awesome use of colors and designs in product templates.


