Startup Strategy Framework Powerpoint Presentation Slides
Startup Strategy Framework is the crux of any prosperous start-up and if you are in search of the right presentation on startup framework then you are at correct place. We present you our content-ready 79 slides Startup Strategy Framework Powerpoint Presentation Slides that will help you in representing your new business strategy clearly and effectively. Using this startup frameworks PPT slides, company chairperson can present their firm framework strategies to the potential stakeholders. This start-up strategy model PPT templates comprise of executive summary for problem-solution-market-mission, market insights, what we offer, key financials, our strategic positioning, startup summary and expenses, management team, assets and liabilities statement, products and services, market analysis, industry snapshot, pricing strategy, competitor analysis, organizational structure, and much more. This startup strategy framework PowerPoint presentation will be helpful for various topics like firm model canvas for a new venture, organizational structure pattern, scalable business layout, business structure strategies, entrepreneurial venture, seed money, venture capital etc. This startup business framework PowerPoint example presentation file is entirely editable and designed by our expert professional designers. Don’t think and wait. Instantaneously download this Startup Strategy Framework Powerpoint Presentation Slides. Address factors causing impatience with our Startup Strategy Framework Powerpoint Presentation Slides. Be able to handle irate folk.
- Google Slides is a new FREE Presentation software from Google.
- All our content is 100% compatible with Google Slides.
- Just download our designs, and upload them to Google Slides and they will work automatically.
- Amaze your audience with SlideTeam and Google Slides.
-
Want Changes to This PPT Slide? Check out our Presentation Design Services
- WideScreen Aspect ratio is becoming a very popular format. When you download this product, the downloaded ZIP will contain this product in both standard and widescreen format.
-

- Some older products that we have may only be in standard format, but they can easily be converted to widescreen.
- To do this, please open the SlideTeam product in Powerpoint, and go to
- Design ( On the top bar) -> Page Setup -> and select "On-screen Show (16:9)” in the drop down for "Slides Sized for".
- The slide or theme will change to widescreen, and all graphics will adjust automatically. You can similarly convert our content to any other desired screen aspect ratio.
Compatible With Google Slides

Get This In WideScreen
You must be logged in to download this presentation.
PowerPoint presentation slides
Introducing Start-up Strategy Framework PowerPoint presentation comprising a total of 79 slides. Each slide focuses on the aspects of start-up groundwork with content extensively researched by our business research team. Our team of PPT designers used the best of professional PowerPoint templates, images, icons and layouts. Also included are impressive, editable data visualization tools like charts, graphs and tables. When you download this presentation by clicking the Download button, you get the presentation in both standard and widescreen format. All slides are fully customizable. Change the colors, font, size, add and remove things as per your need and present before your audience.
People who downloaded this PowerPoint presentation also viewed the following :
Content of this Powerpoint Presentation
Slide 1: This slide introduces Startup Strategy Framework. State Your Company Logo and get started.
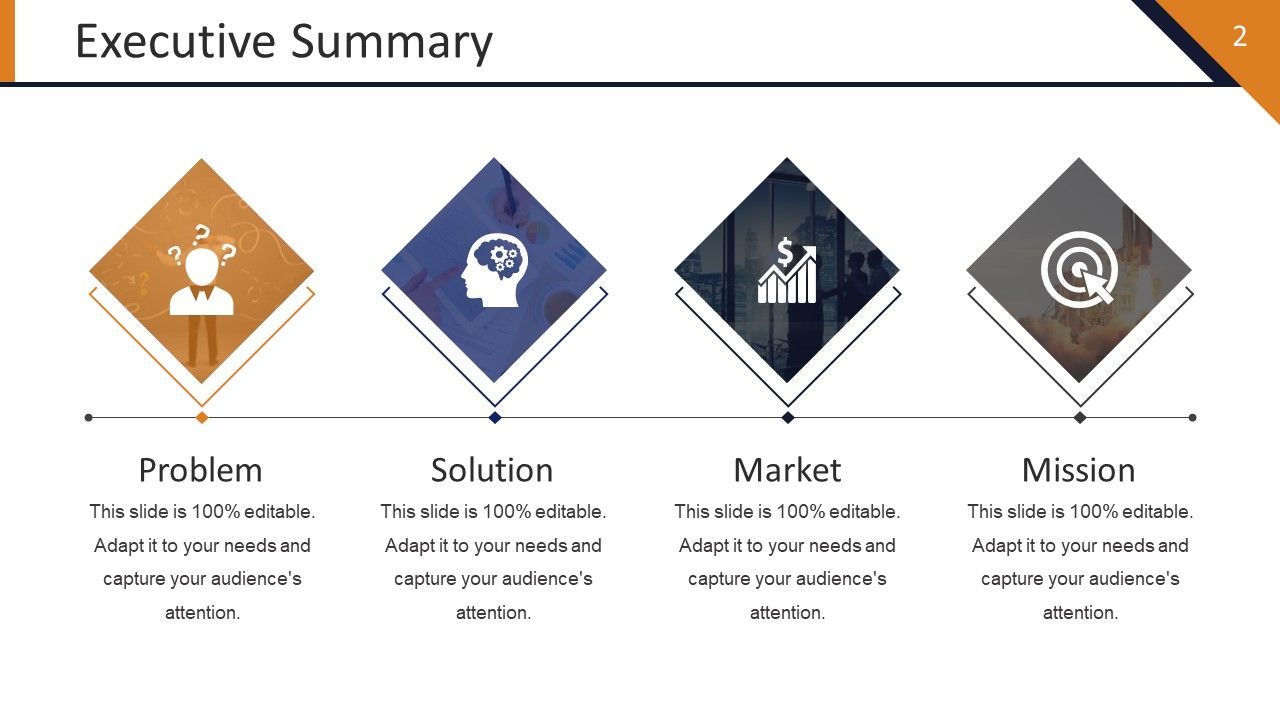
Slide 2: This slide showcases Executive Summary with- Problem, Market, Mission, Solution.
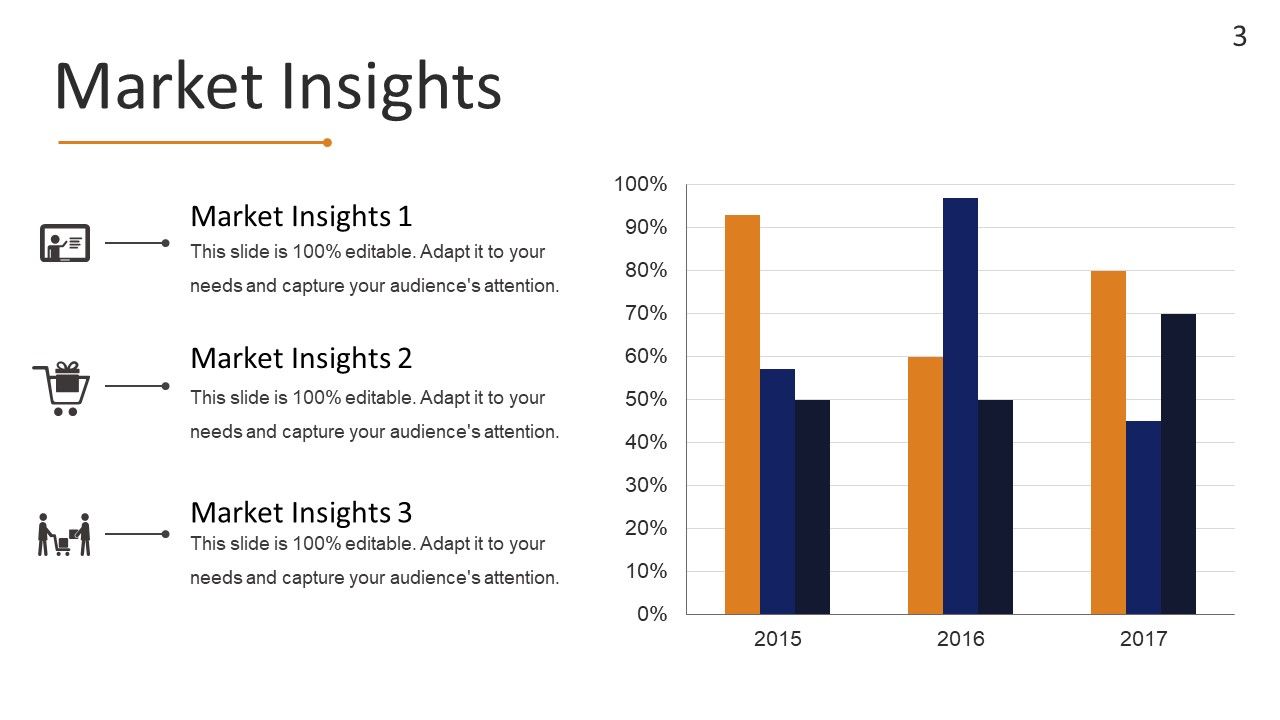
Slide 3: This is a Market Insights slide in graph form.
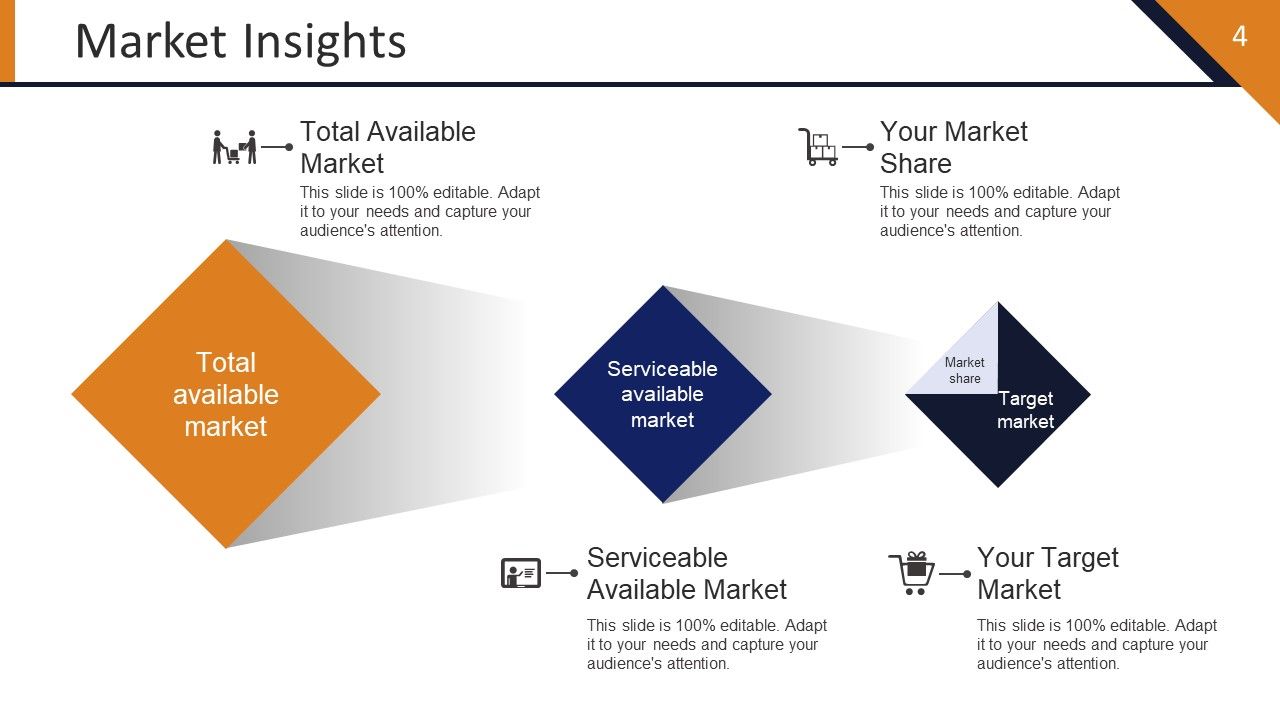
Slide 4: This slide Market Insights with- Market share, Target market, Serviceable available market (SAM), Total available market (TAM), Total Available Market, Serviceable Available Market, Your Target Market, Your Market Share.
Slide 5: This slide presents What We Offer.
Slide 6: This slide also presents What We Offer.
Slide 7: This slide presents Our Keys To Success. State success factors here.
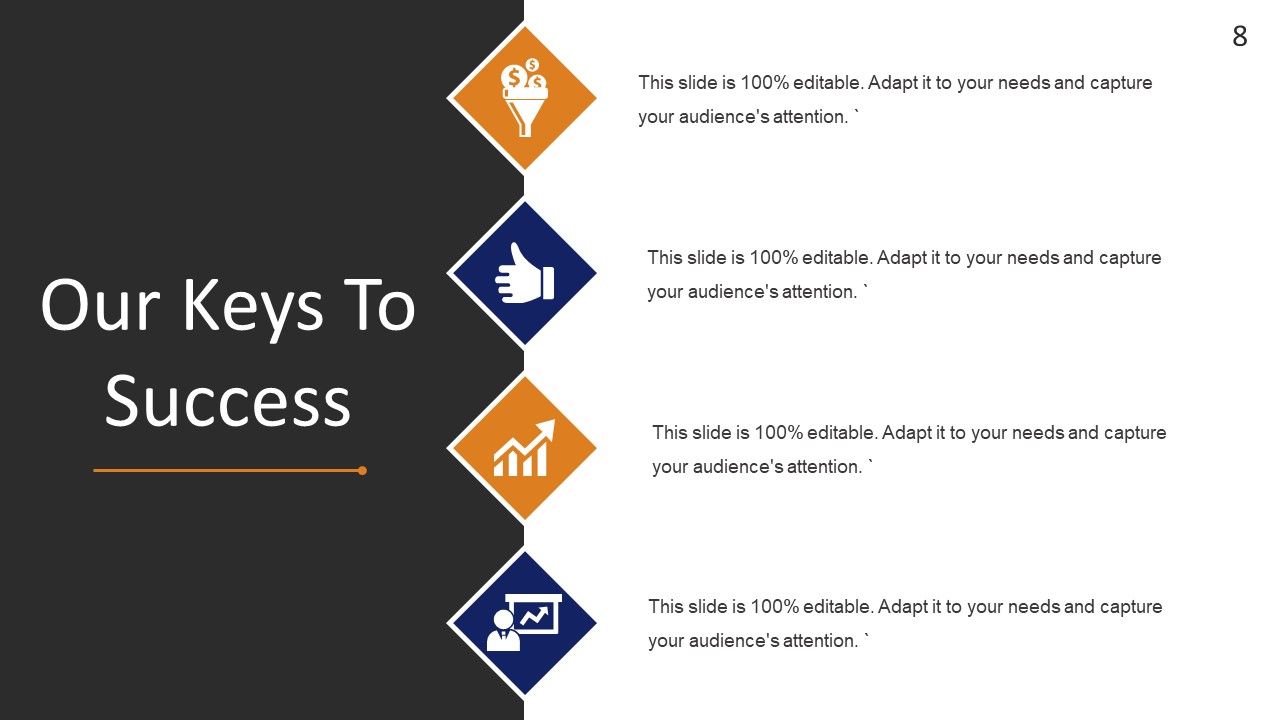
Slide 8: This slide presents Our Keys To Success. State success factors here.
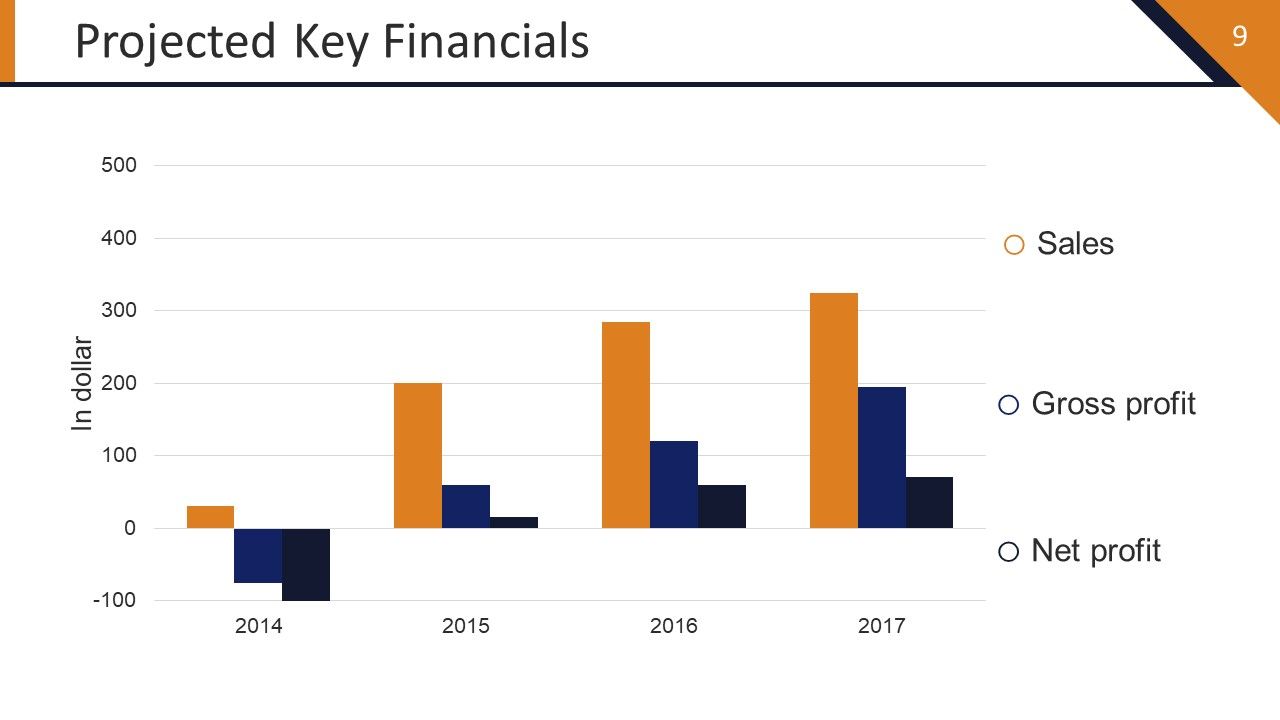
Slide 9: This slide showcases Projected Key Financials in bar graph form showing- Sales, Net profit, Gross profit.
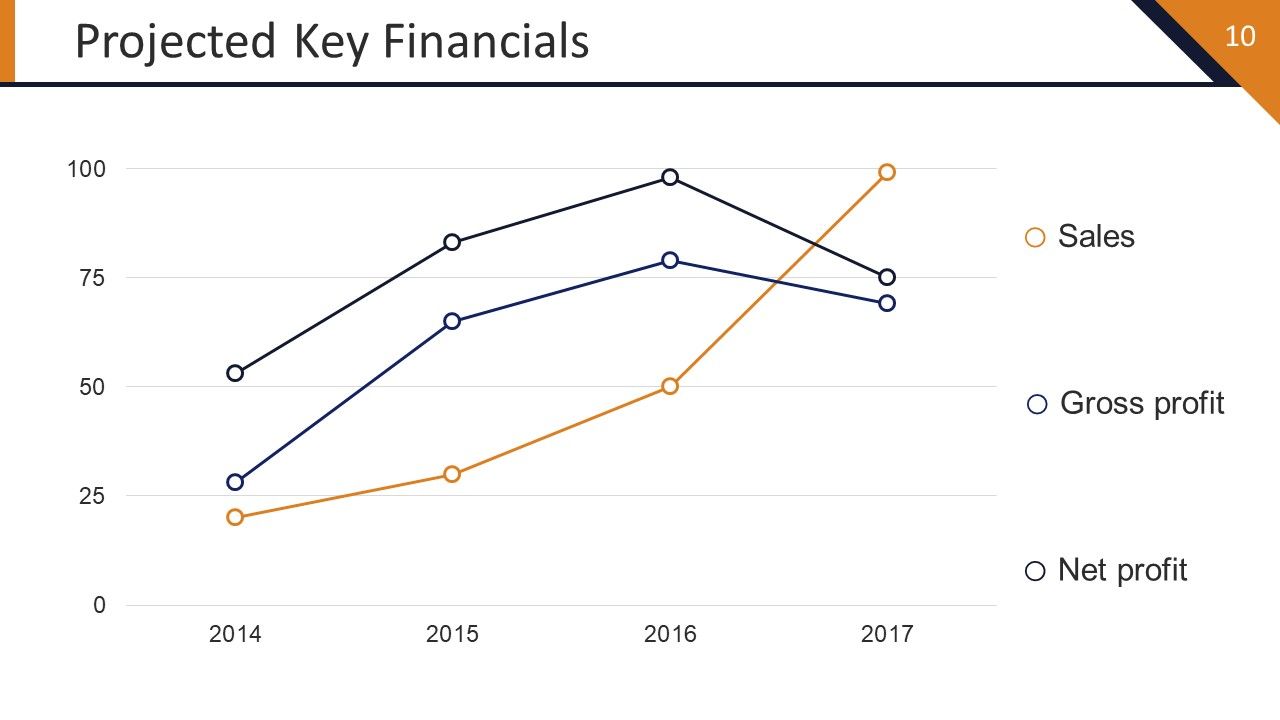
Slide 10: This slide showcases Projected Key Financials in line graph form showing- Sales, Net profit, Gross profit.
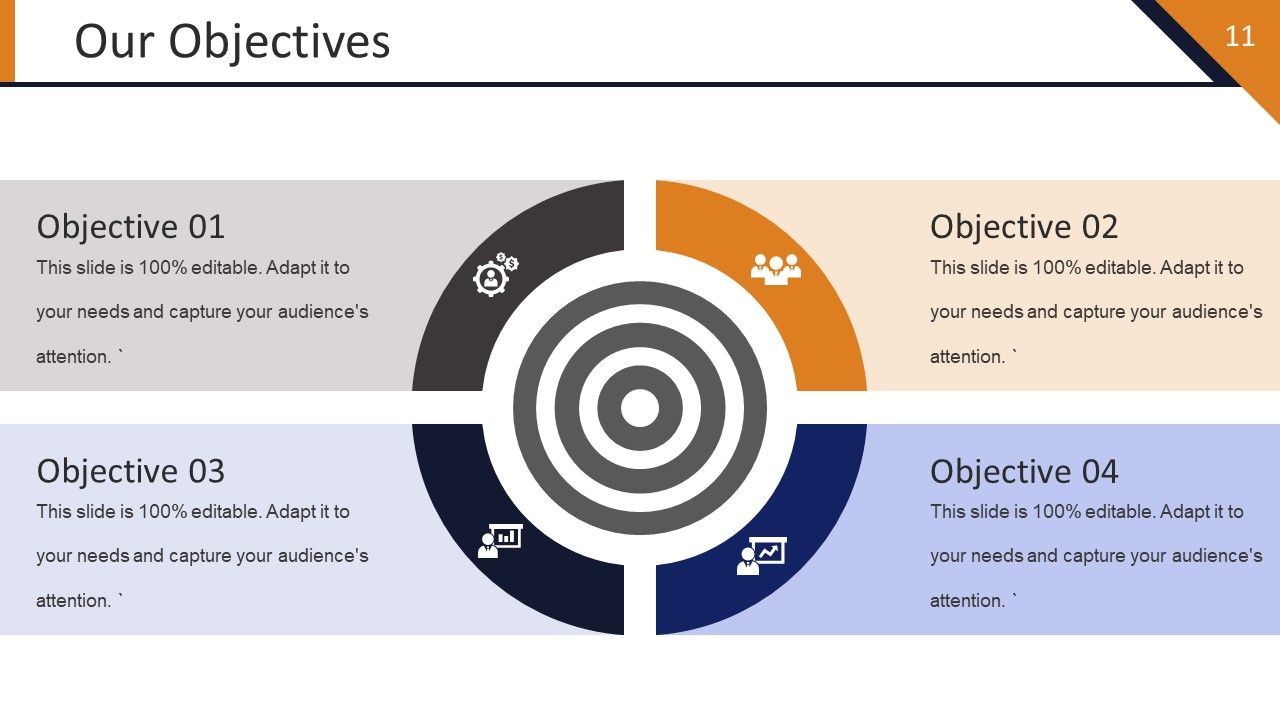
Slide 11: This slide presents Our Objectives. State Objectives etc. here.
Slide 12: This slide presents Our Strategic Positioning. Present positioning factors, strategies here.
Slide 13: This slide presents Our Strategic Positioning with an imagery to go with. Present positioning factros, strategies
Slide 14: This is Our Mission slide. State mission here.
Slide 15: This is About The Company slide. State business aspects/about the company facts, figures etc. here.
Slide 16: This is a Management Team slide with names, designation and image boxes to fill information for.
Slide 17: This is a Management Team slide with names, designation and image boxes to fill information for.
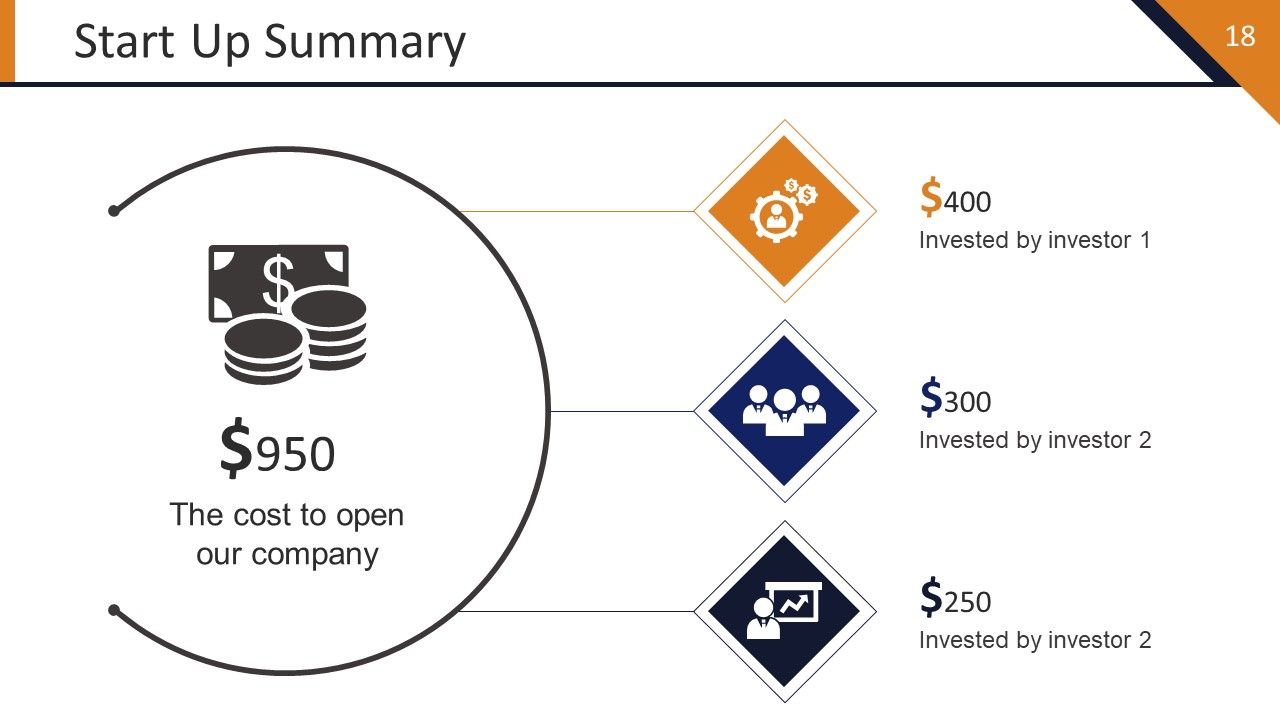
Slide 18: This slide presents Start Up Summary. State facts, figures, stats etc. here.
Slide 19: This slide presents Start Up Expenses. State facts, figures, stats etc. here.
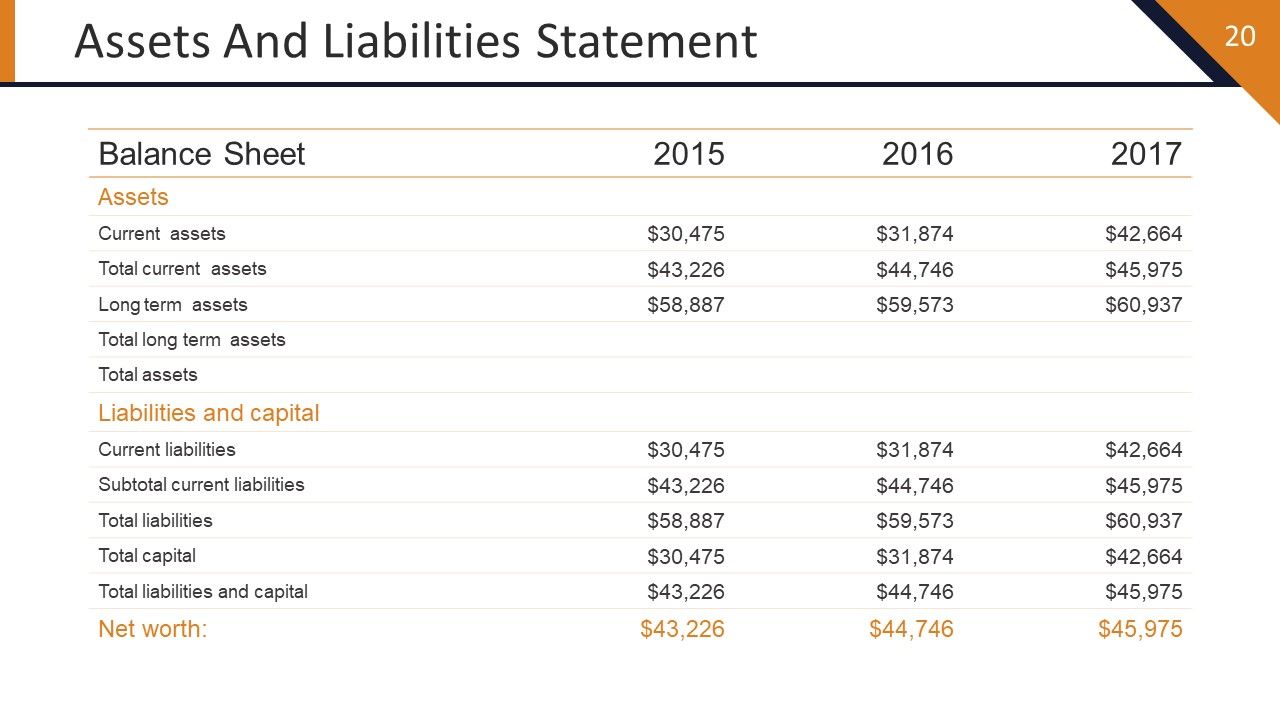
Slide 20: This slide showcases Assets And Liabilities Statement to be stated.
Slide 21: This slide showcases Financial Predictions. State facts, figures, stats etc. here.
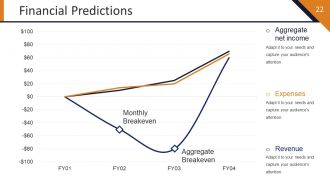
Slide 22: This slide showcases Financial Predictions. State facts, figures, stats etc. here such as- Monthly Breakeven, Aggregate Breakeven, Revenue, Expenses, Aggregate net income.
Slide 23: This slide shows Our Product And Services to be displayed.
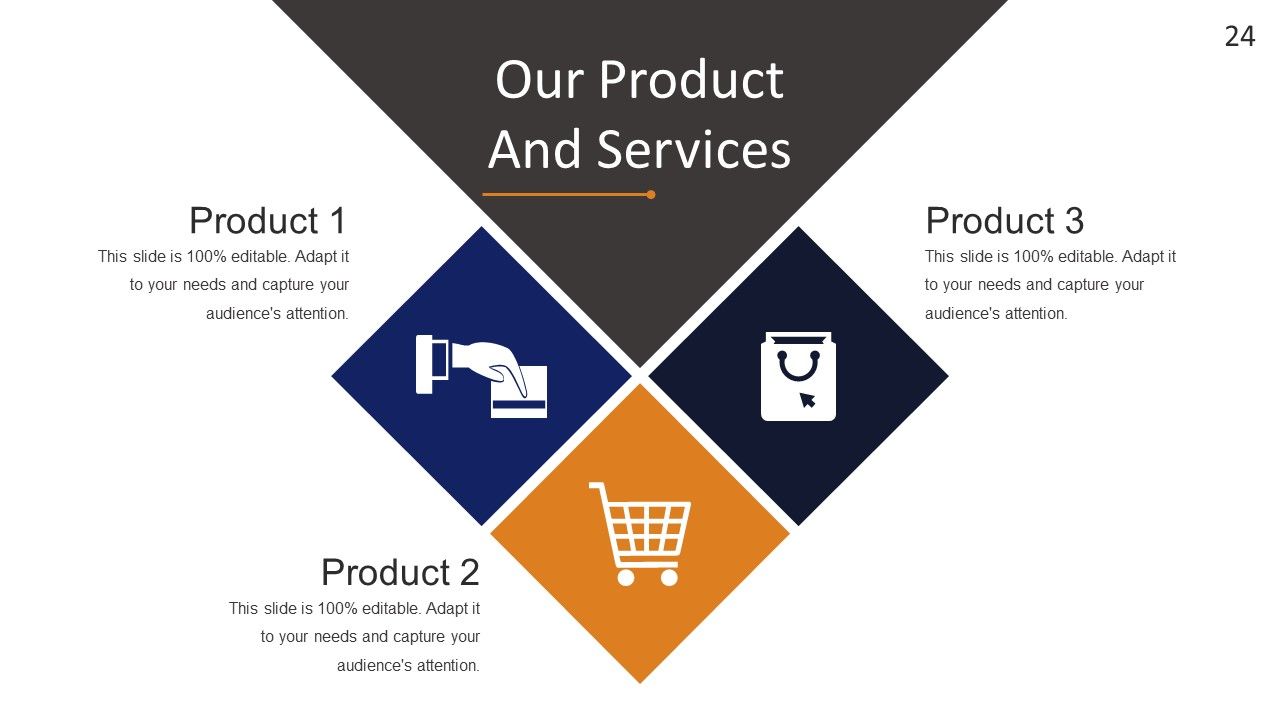
Slide 24: This slide shows Our Product And Services to be displayed.
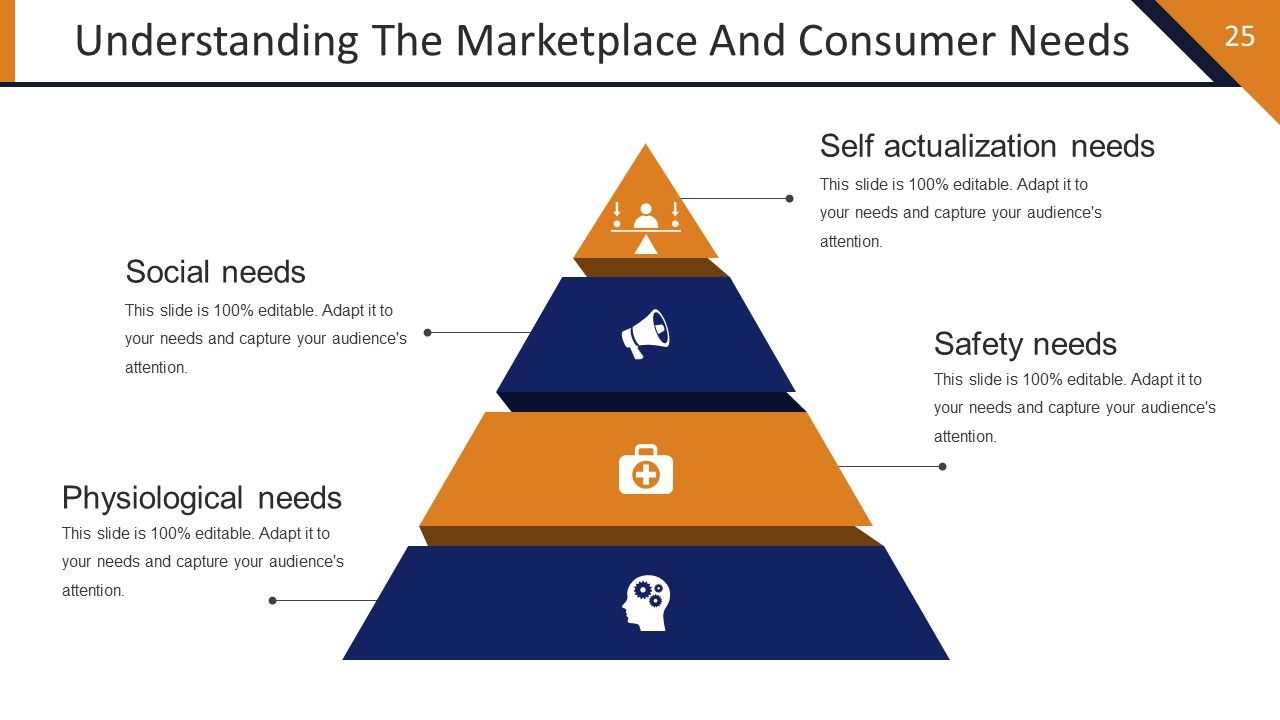
Slide 25: This slide shows Understanding The Marketplace And Consumer Needs pyramid containing- Physiological needs, Self actualization needs, Social needs, Safety needs.
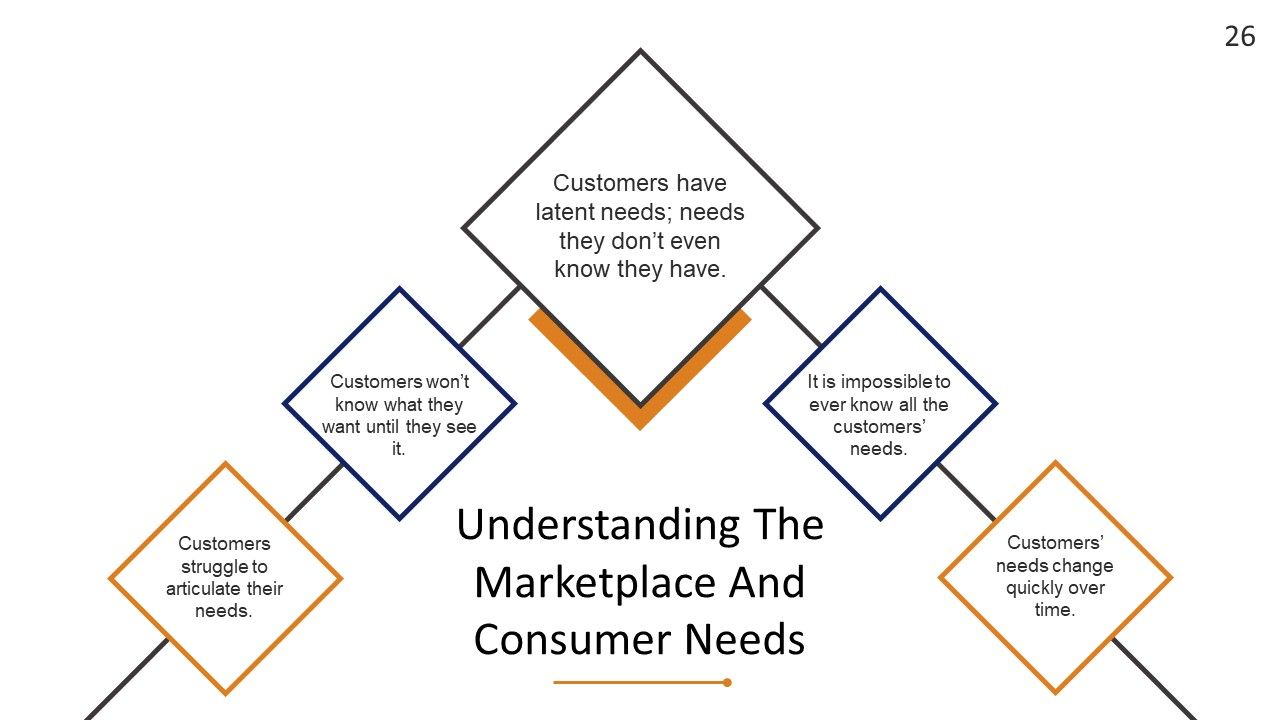
Slide 26: This slide shows Understanding The Marketplace And Consumer Needs showing- Customers won’t know what they want until they see it, It is impossible to ever know all the customers’ needs, Customers have latent needs; needs they don’t even know they have, Customers’ needs change quickly over time, Customers struggle to articulate their needs.
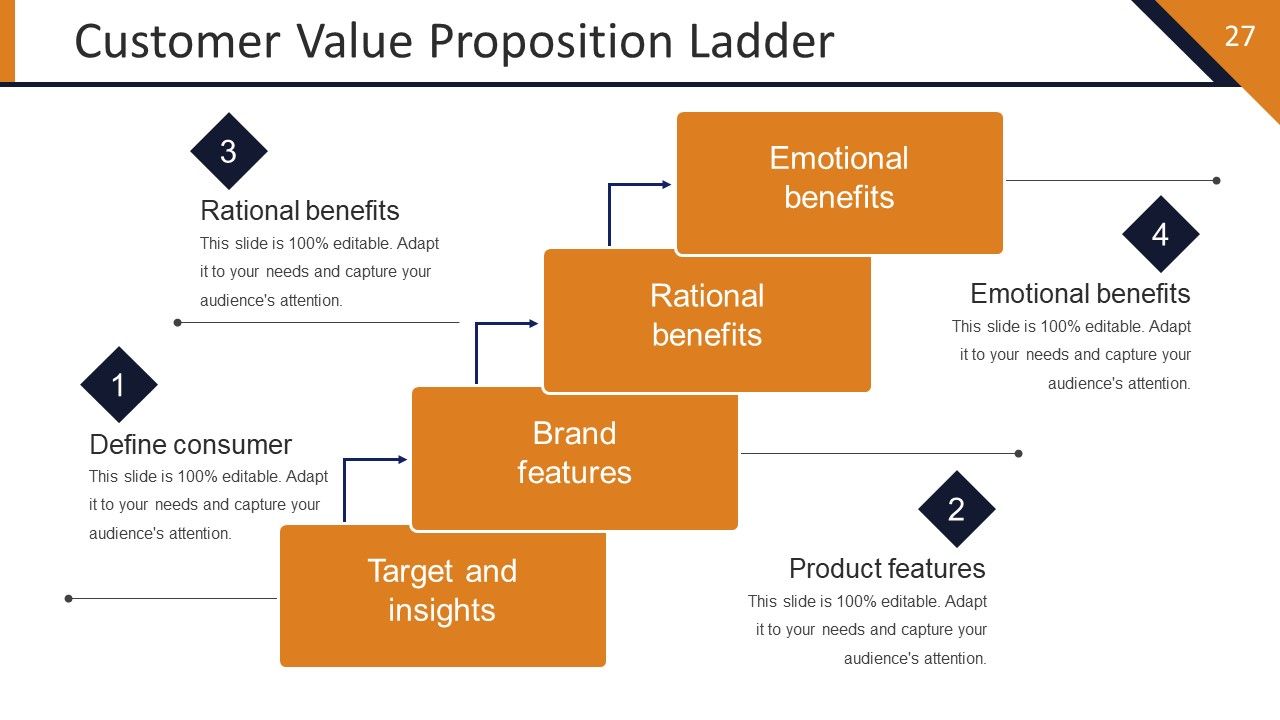
Slide 27: This slide showcases Customer Value Proposition Ladder showing- Emotional benefits, Rational benefits, Target and insights, Brand features with Product features, Rational benefits, Emotional benefits, Define consumer.
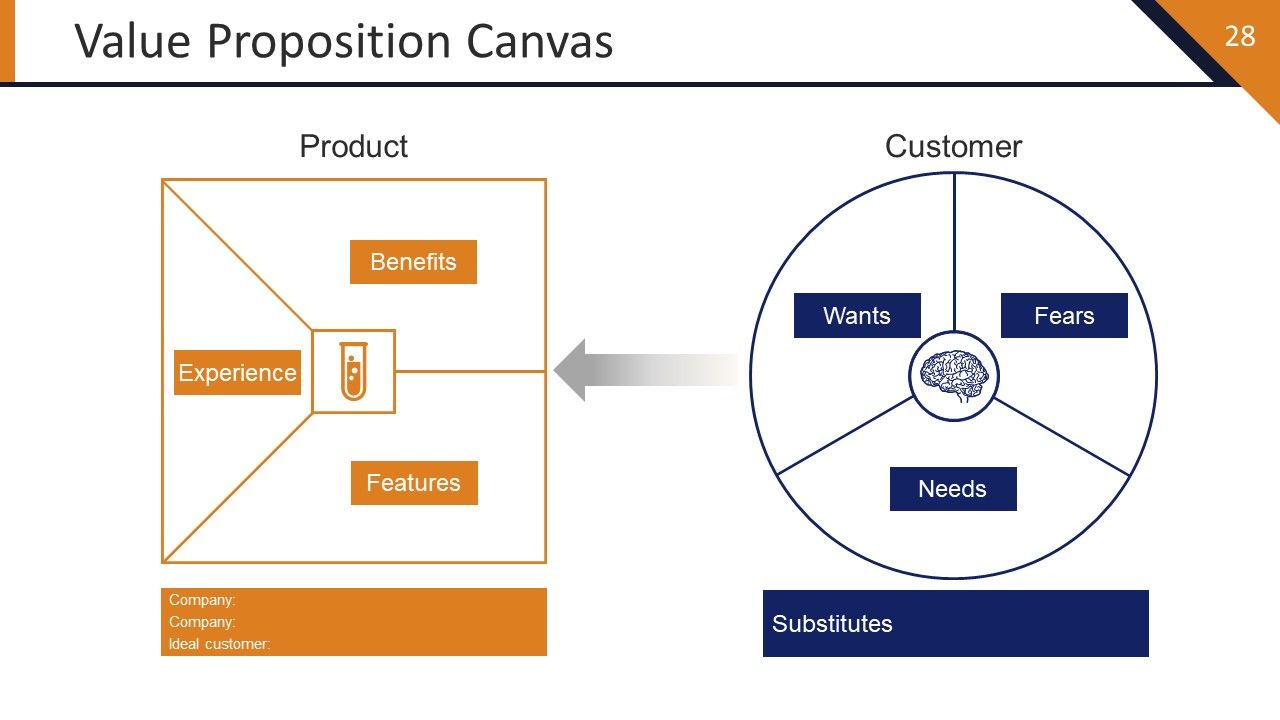
Slide 28: This slide showcases Value Proposition Canvas with- Customer and Product.
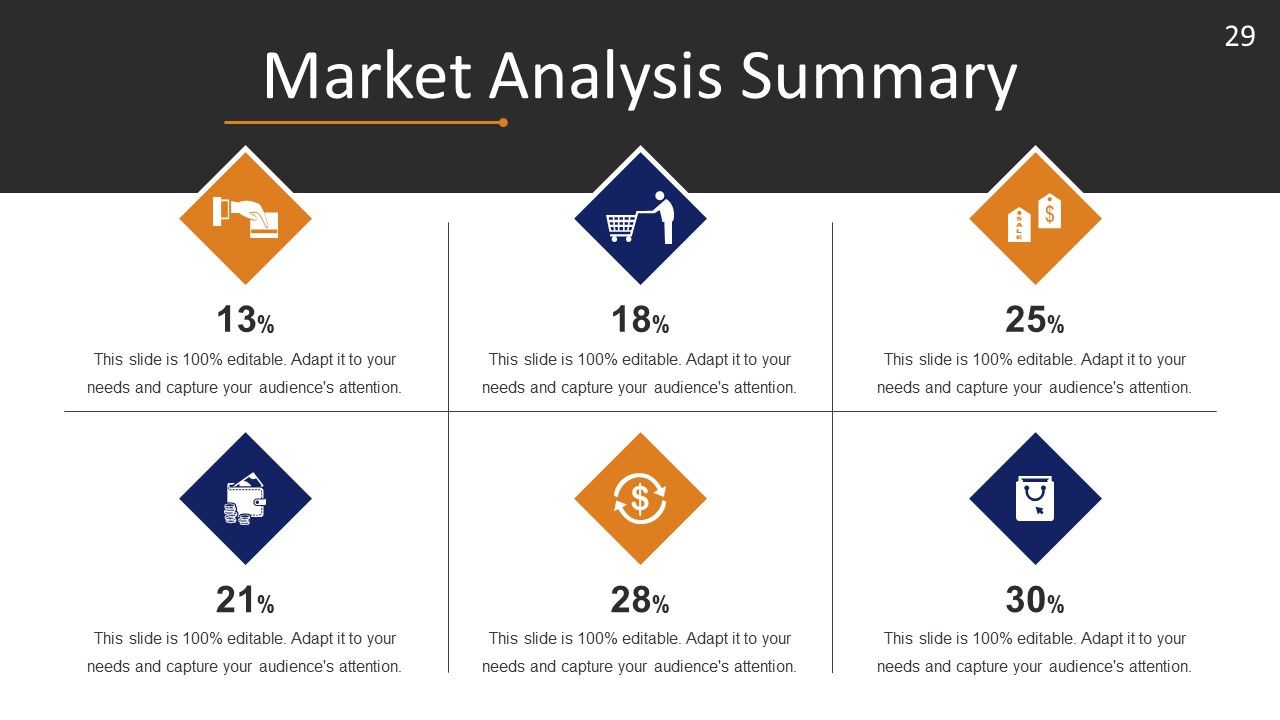
Slide 29: This slide shows Market Analysis Summary. State figures, facts etc. here.
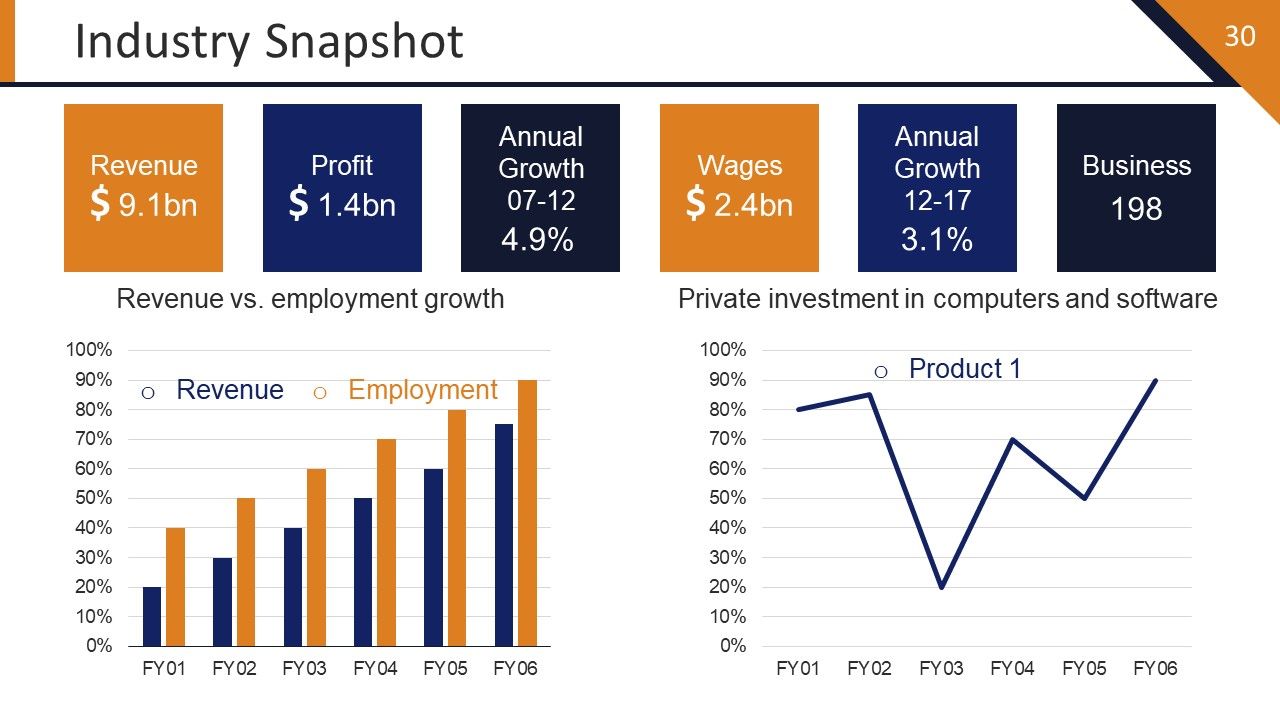
Slide 30: This slide shows Industry Snapshot in graph form showing- Business, Employment, Revenue, Revenue vs. employment growth, Private investment in computers and software.
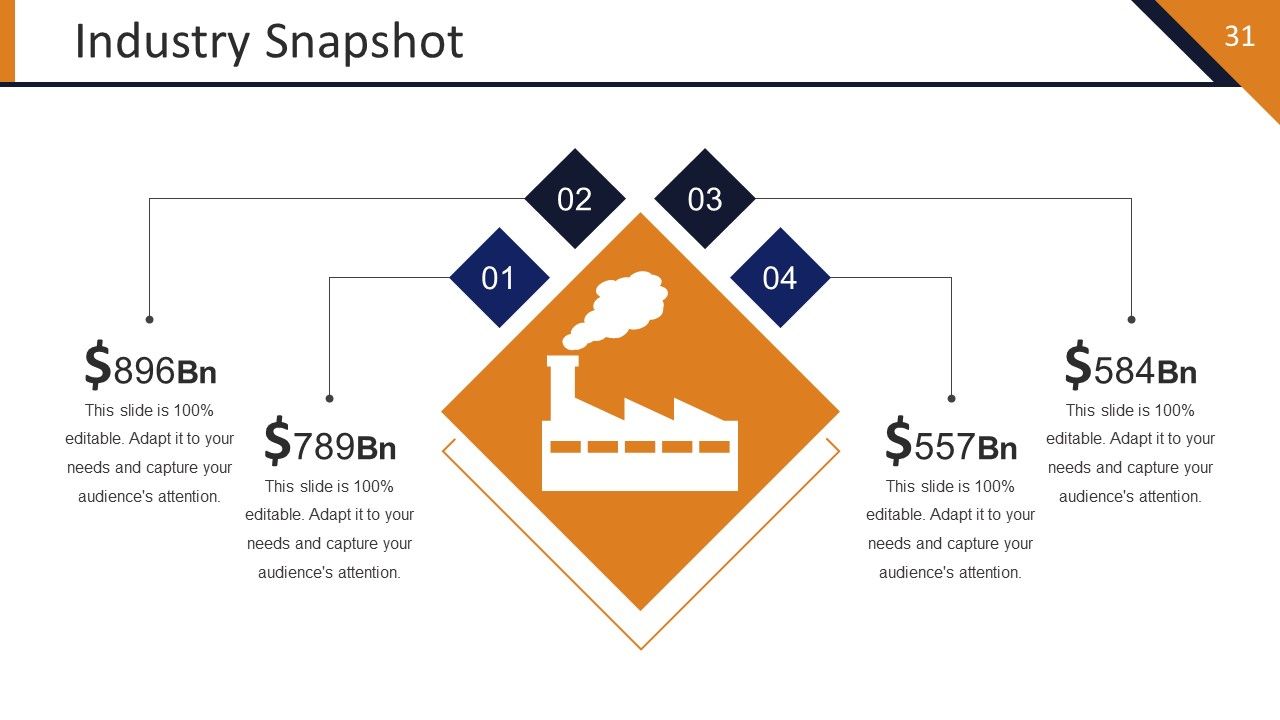
Slide 31: This slide shows Industry Snapshot in box image form. State figures, facts etc. here.
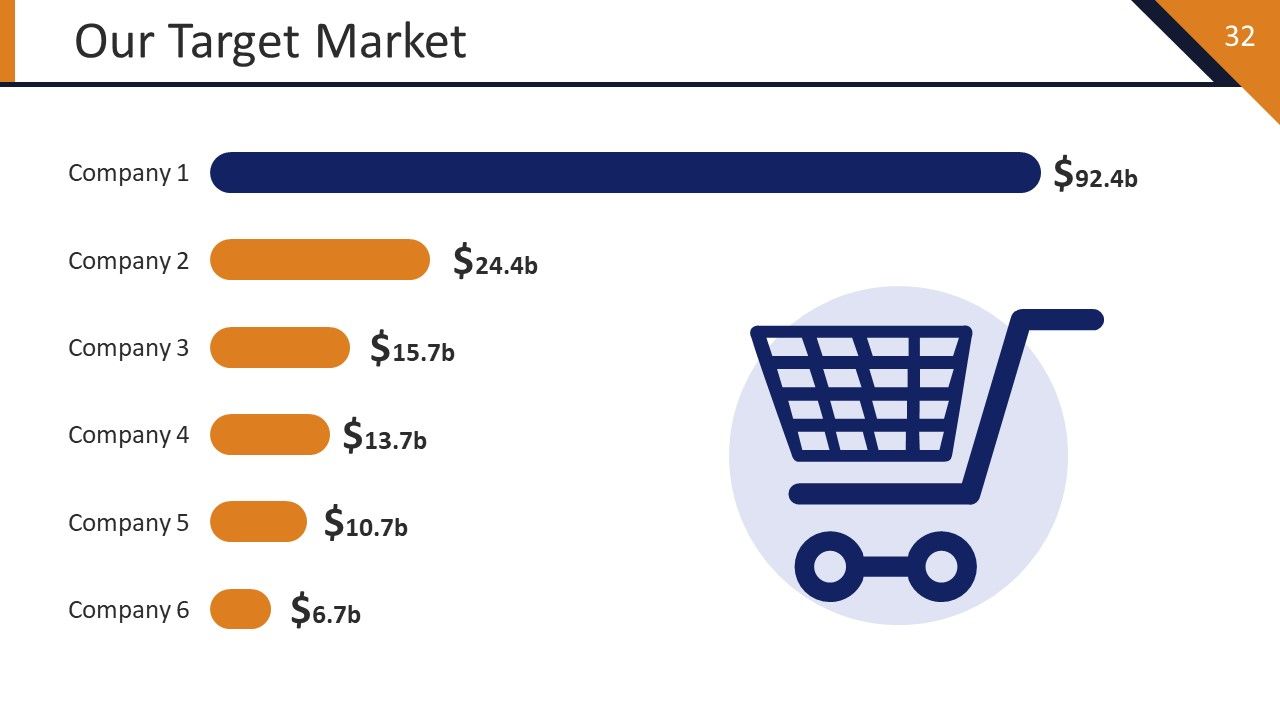
Slide 32: This is Our Target Market slide. State targets, goals etc. here.
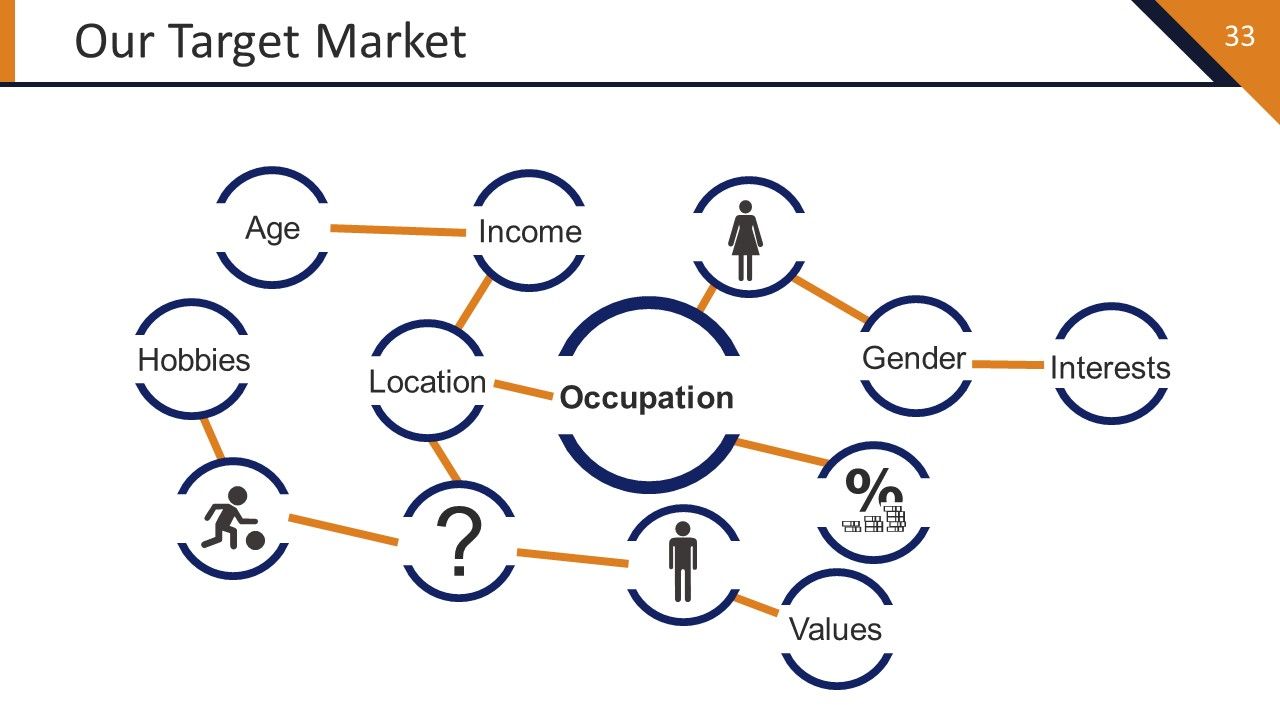
Slide 33: This is Our Target Market slide. State targets, goals etc. here in terms of- Occupation, Location, Income, Age, Hobbies, Gender, Interests, Value..
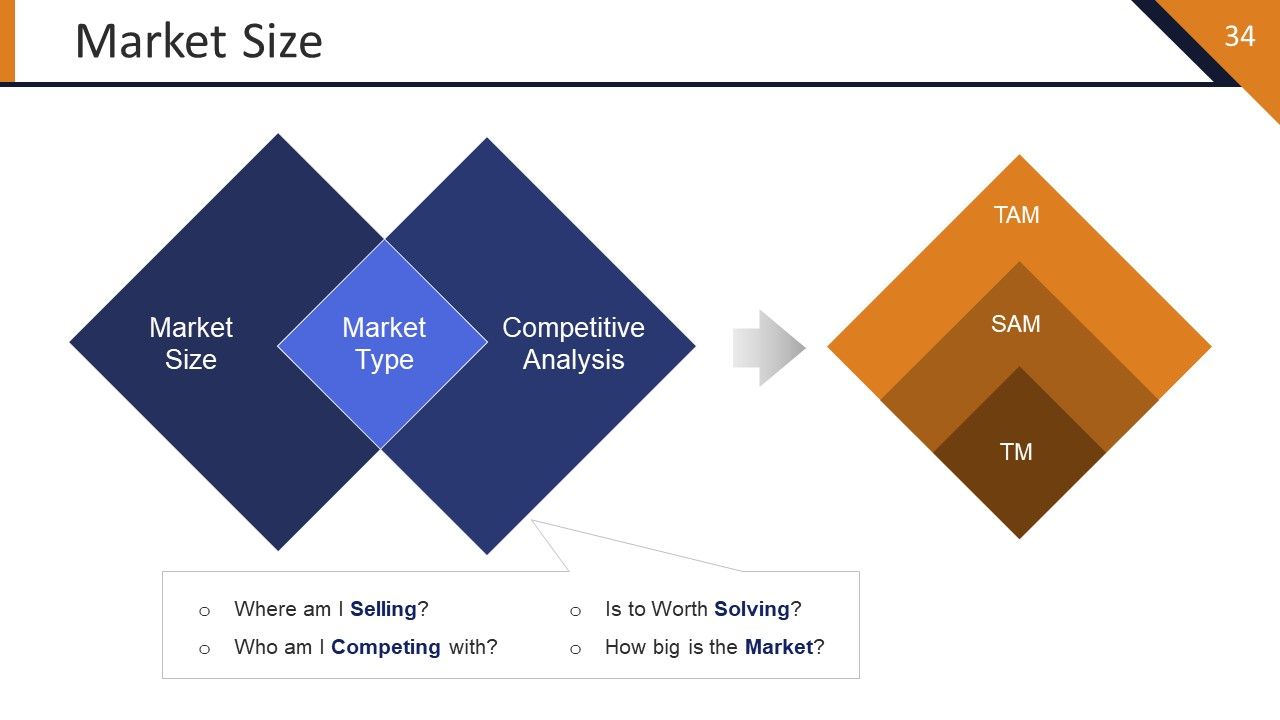
Slide 34: This slide shows Market Size showing- Market type, Market size, Competitive Analysis, TM, SAM, TAM.
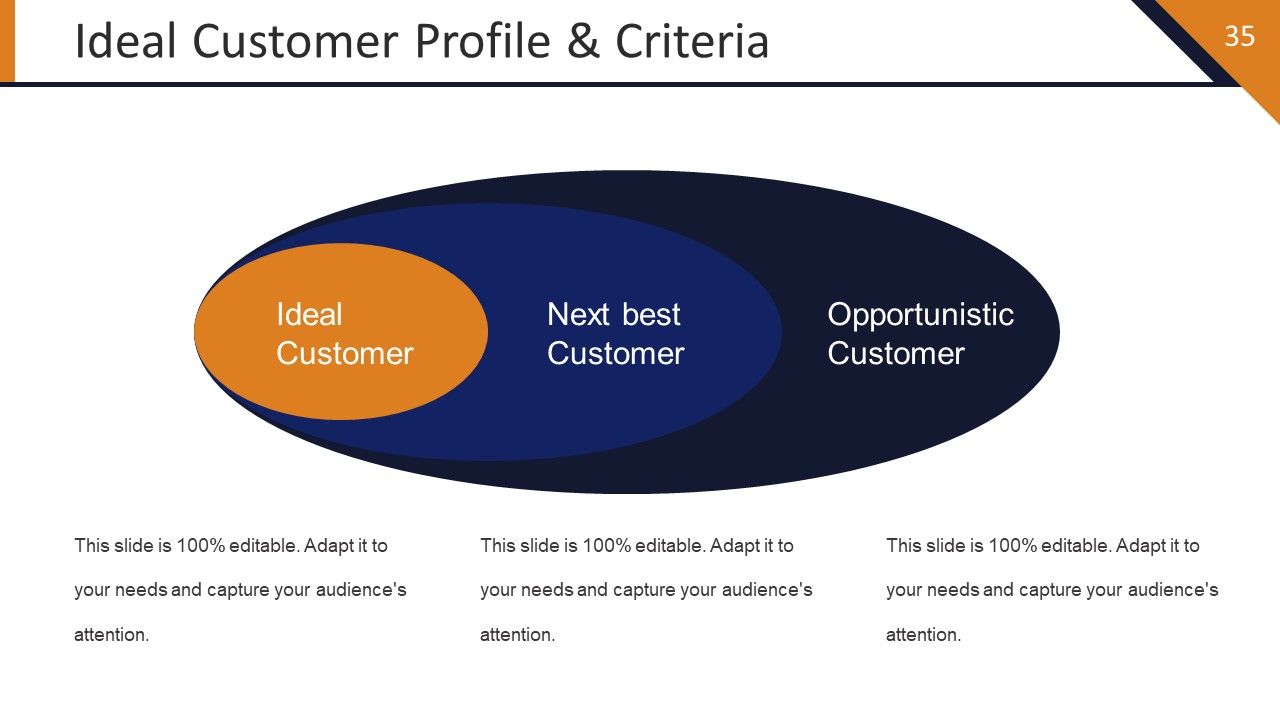
Slide 35: This slide showcases Ideal Customer Profile & Criteria with- Ideal Customer, Next best Customer, Opportunistic Customer.
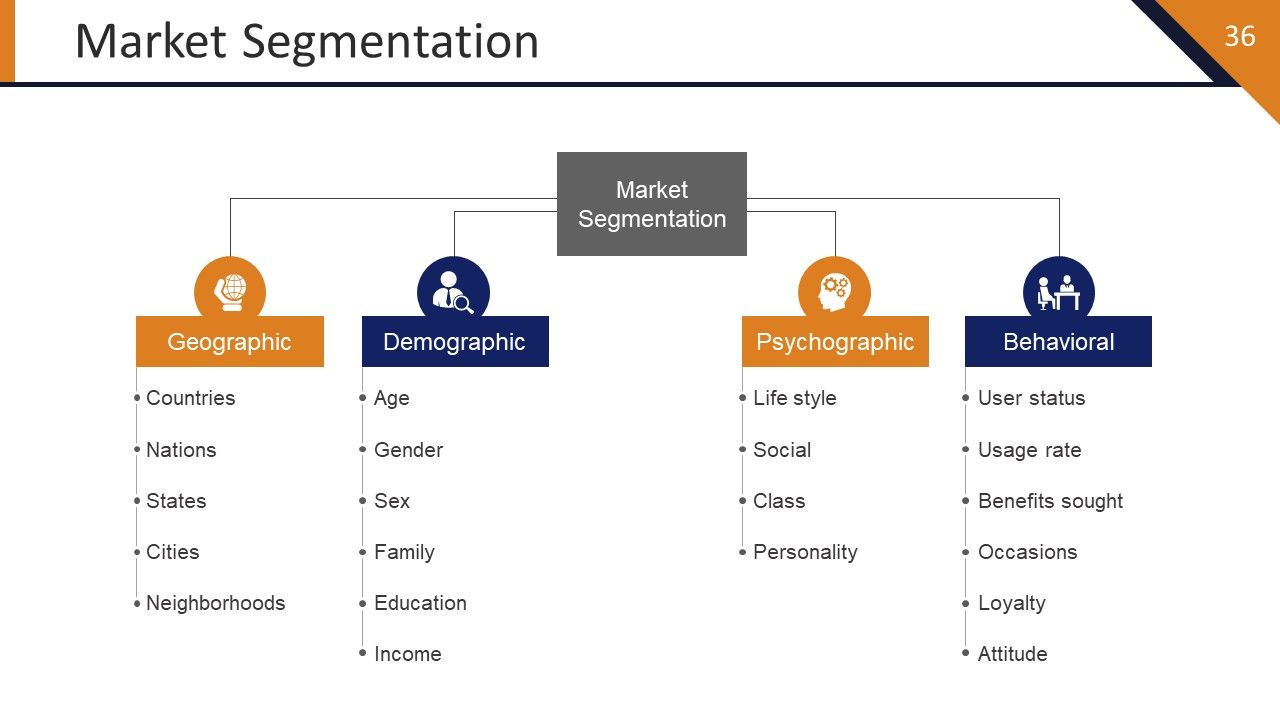
Slide 36: This slide shows Market Segmentation divided into- Geographic, Demographic, Psychographic, Behavioral.
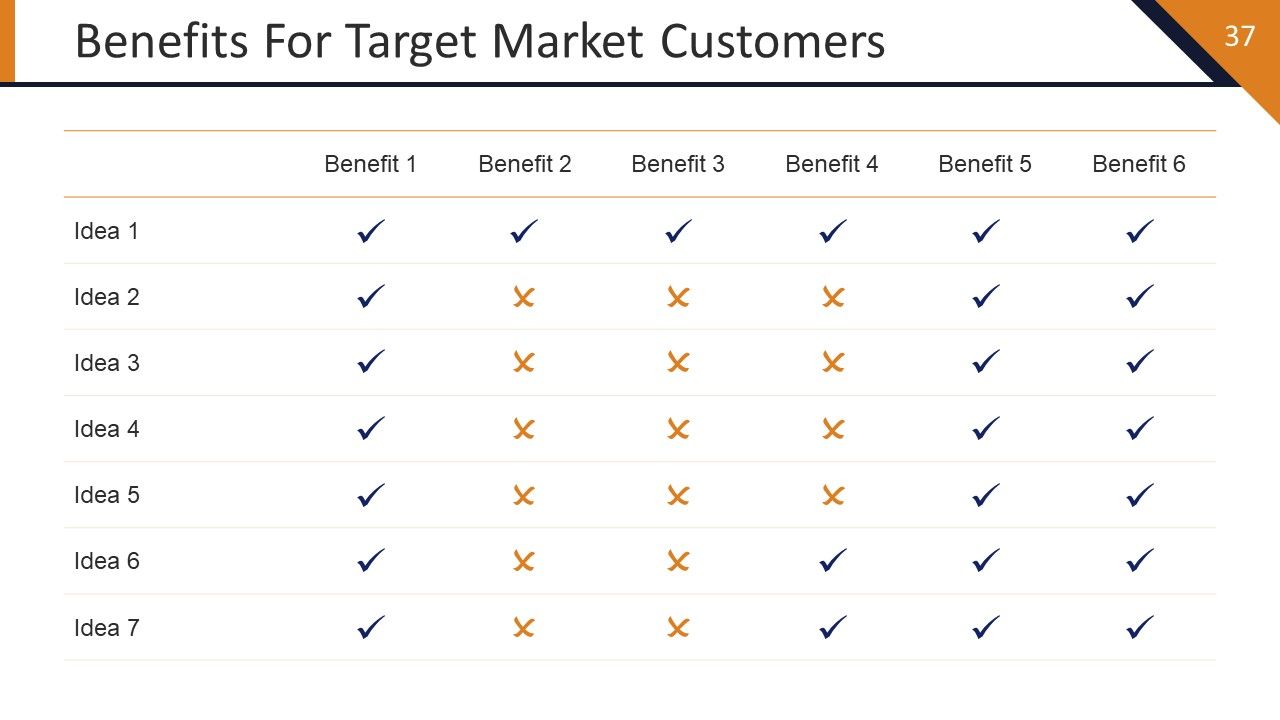
Slide 37: This slide shows Benefits For Target Market Customers in table form.
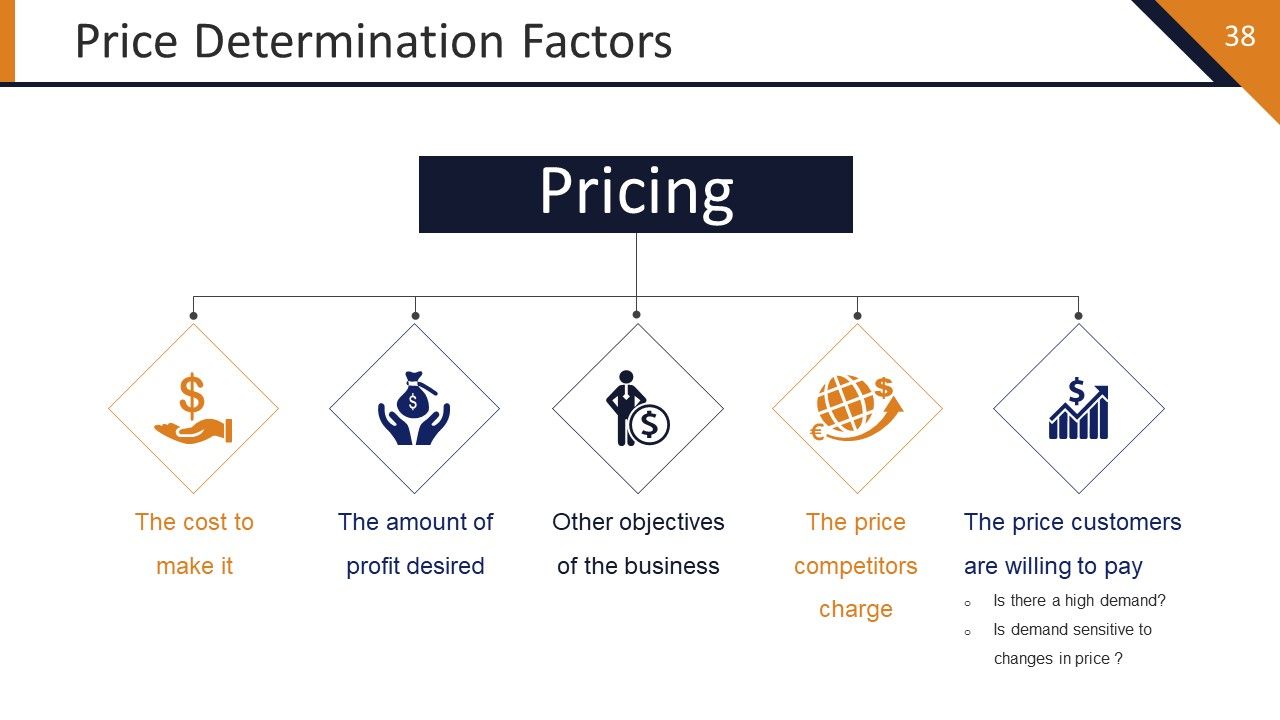
Slide 38: This slide shows Price Determination Factors such as- The cost to make it, The amount of profit desired, Other objectives of the business, The price competitors charge, The price customers are willing to pay, Is there a high demand? Is demand sensitive to changes in price ?
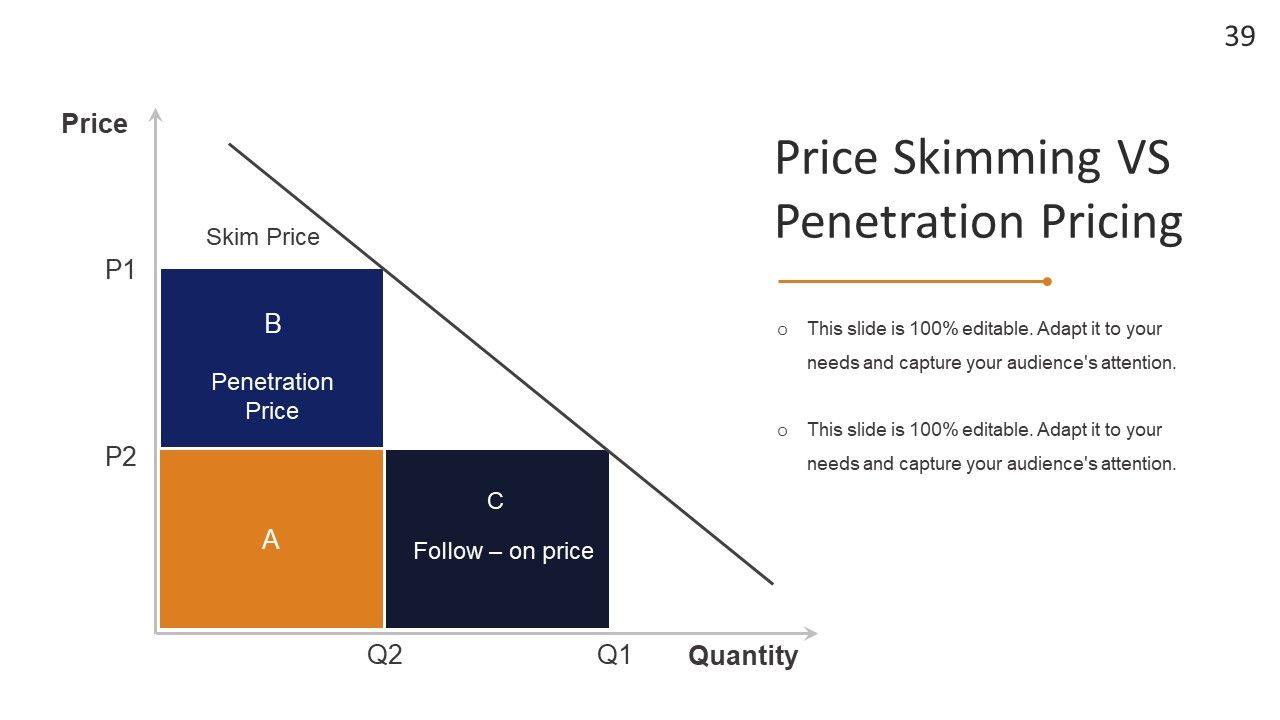
Slide 39: This slide showcases Price Skimming VS Penetration Pricing graph.
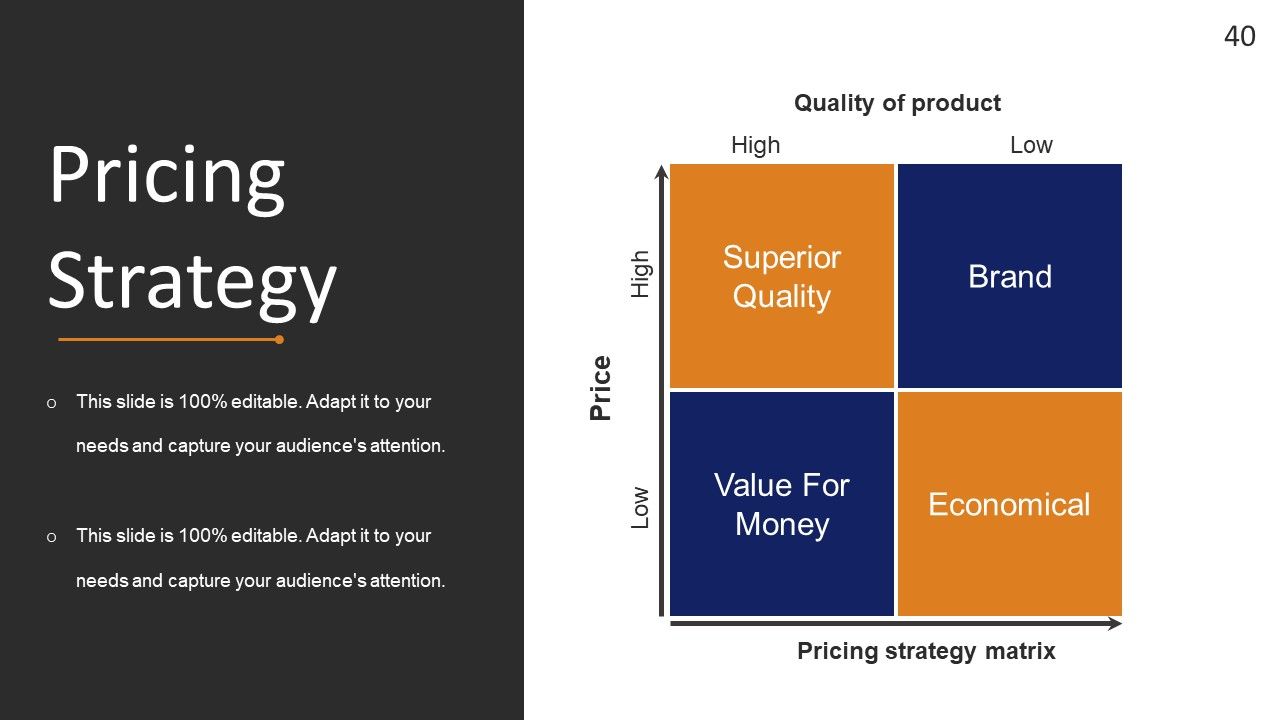
Slide 40: This slide showcases Pricing Strategy matrix showing- Quality of product as: Superior quality, Brand, Value for money, Economical, in terms of Pricing strategy matrix and Price.
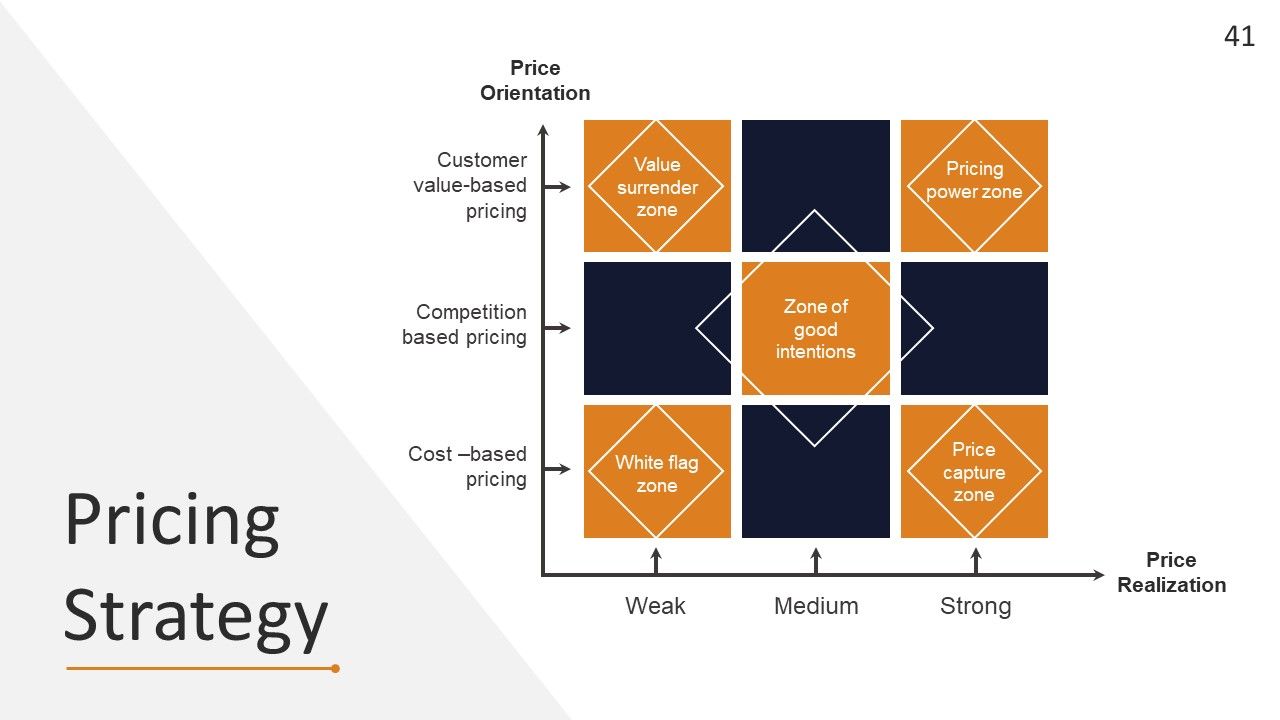
Slide 41: This slide shows Pricing Strategy displaying- Price orientation, Customer value-based pricing, Competition based pricing, Cost –based pricing, Price realization, Value surrender zone, Pricing power zone, Zone of good intentions, White flag zone, Price capture zone.
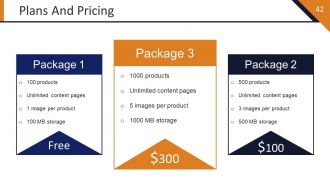
Slide 42: This slide showcases Plans And Pricing table.
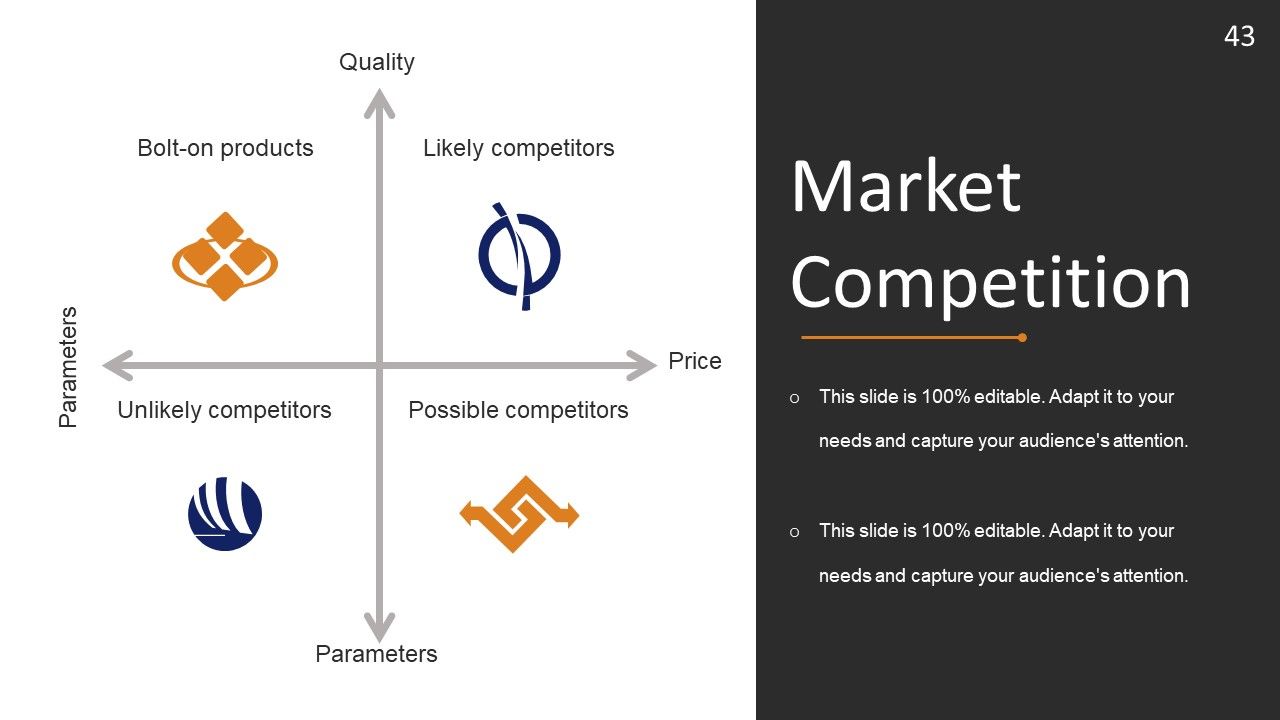
Slide 43: This slide shows Market Competition matrix with- Likely competitors, Unlikely competitors, Bolt-on products, Possible competitors.
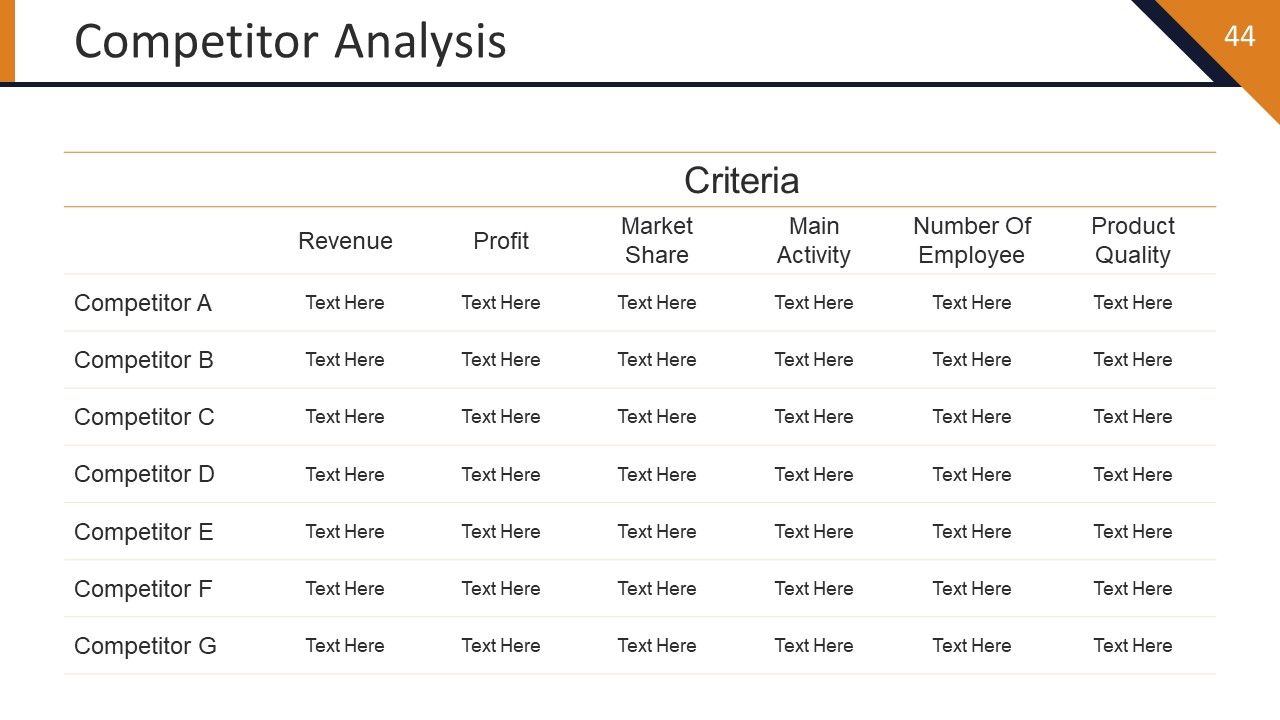
Slide 44: This slide presents a Competitor Analysis table.
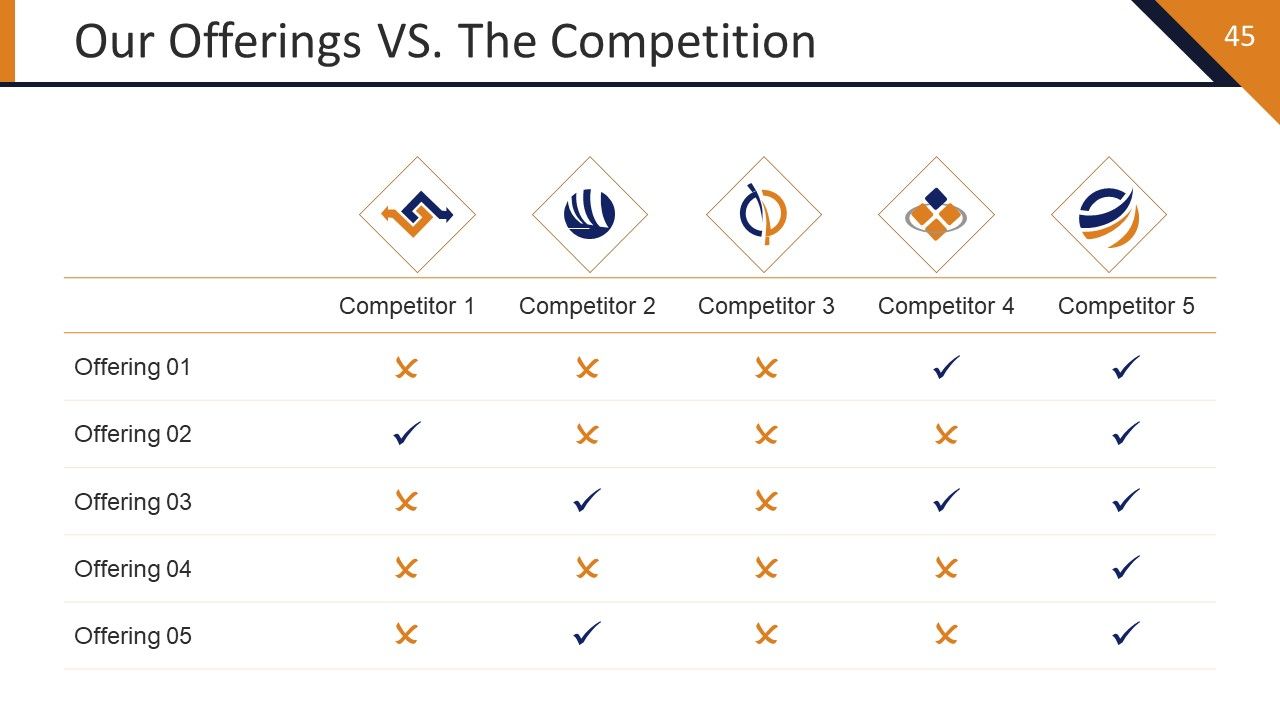
Slide 45: This slide presents Our Offerings VS. The Competition.
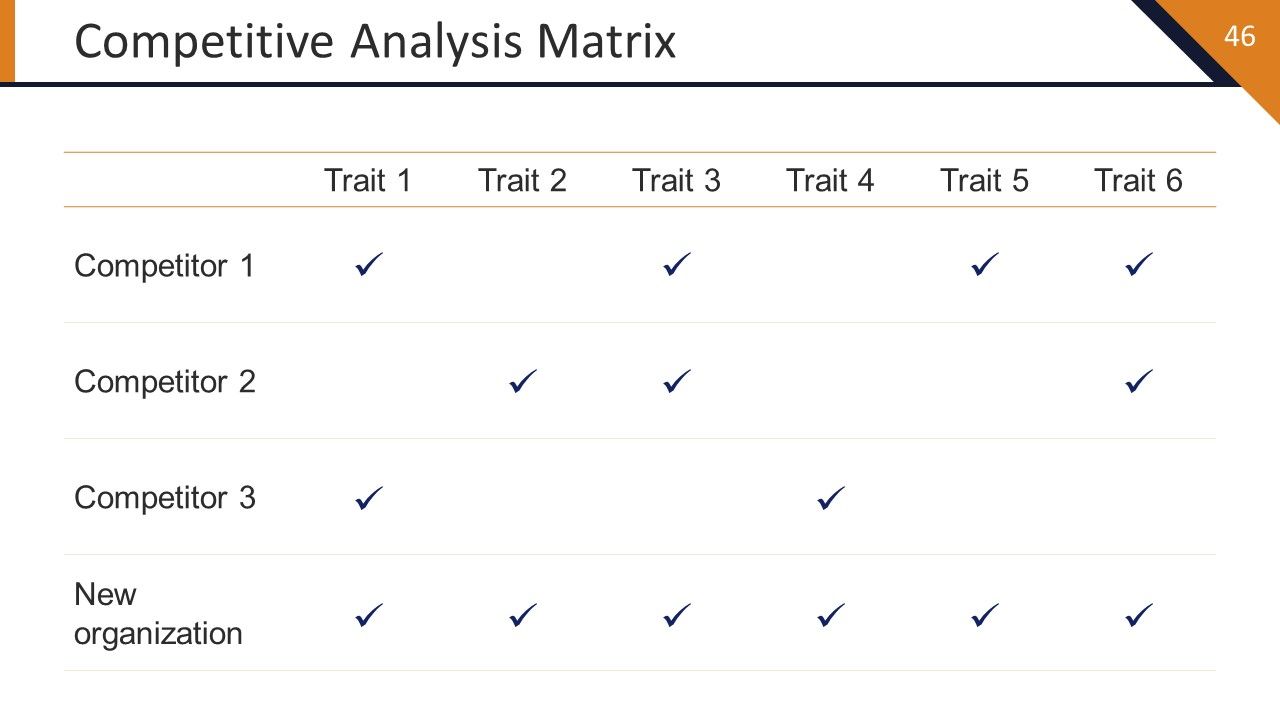
Slide 46: This is a Competitive Analysis Matrix slide.
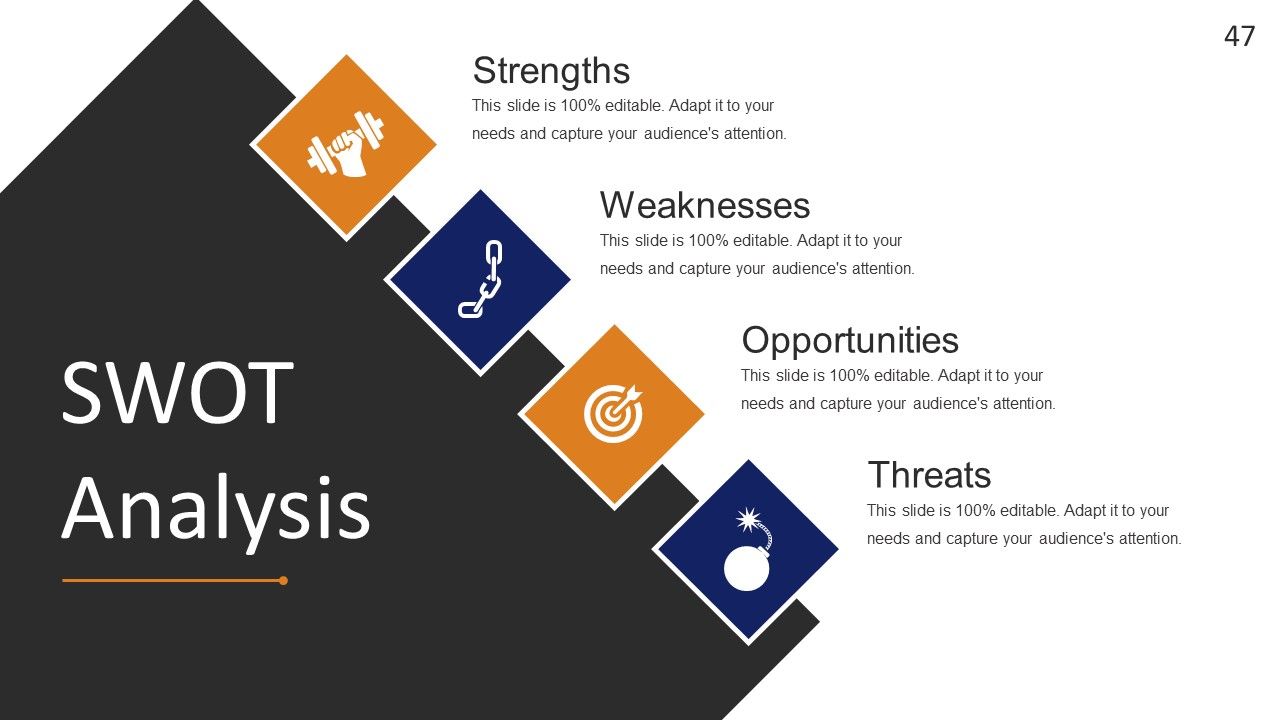
Slide 47: This is a SWOT Analysis slide.
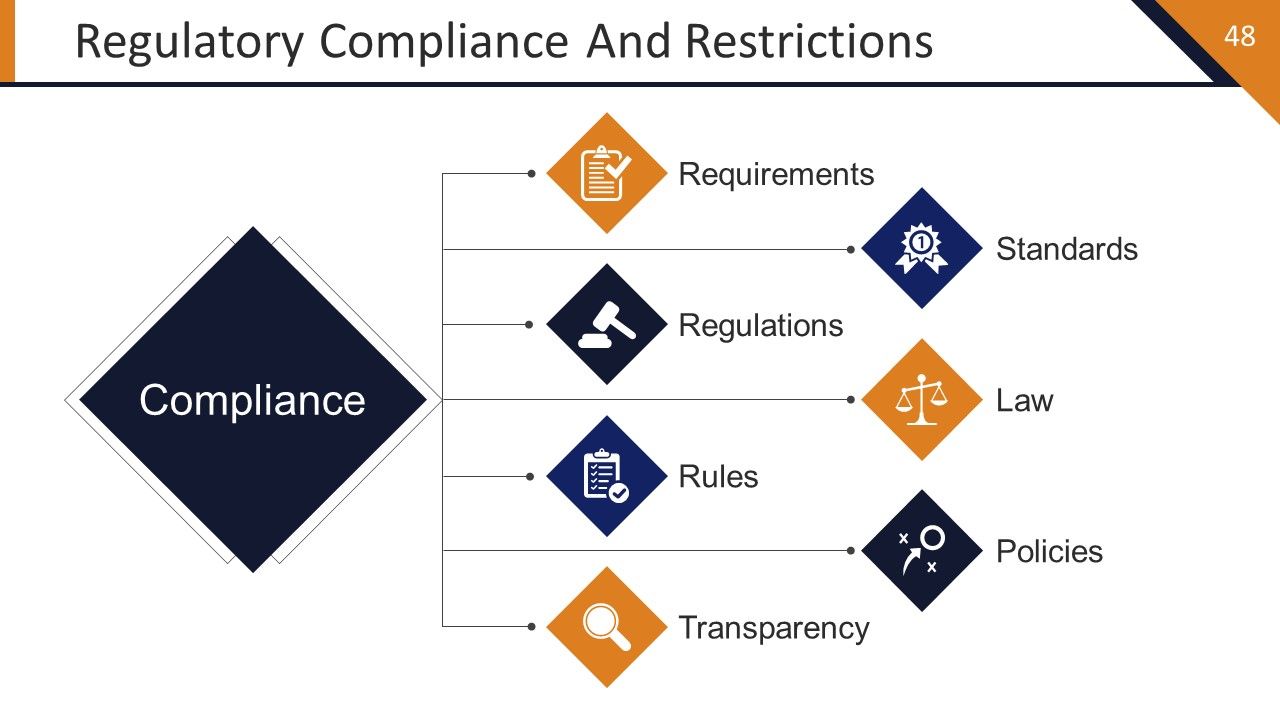
Slide 48: This slide shows Regulatory Compliance And Restrictions such as- Compliance, Requirements, Transparency, Standards, Rules, Law, Regulations, Policies.
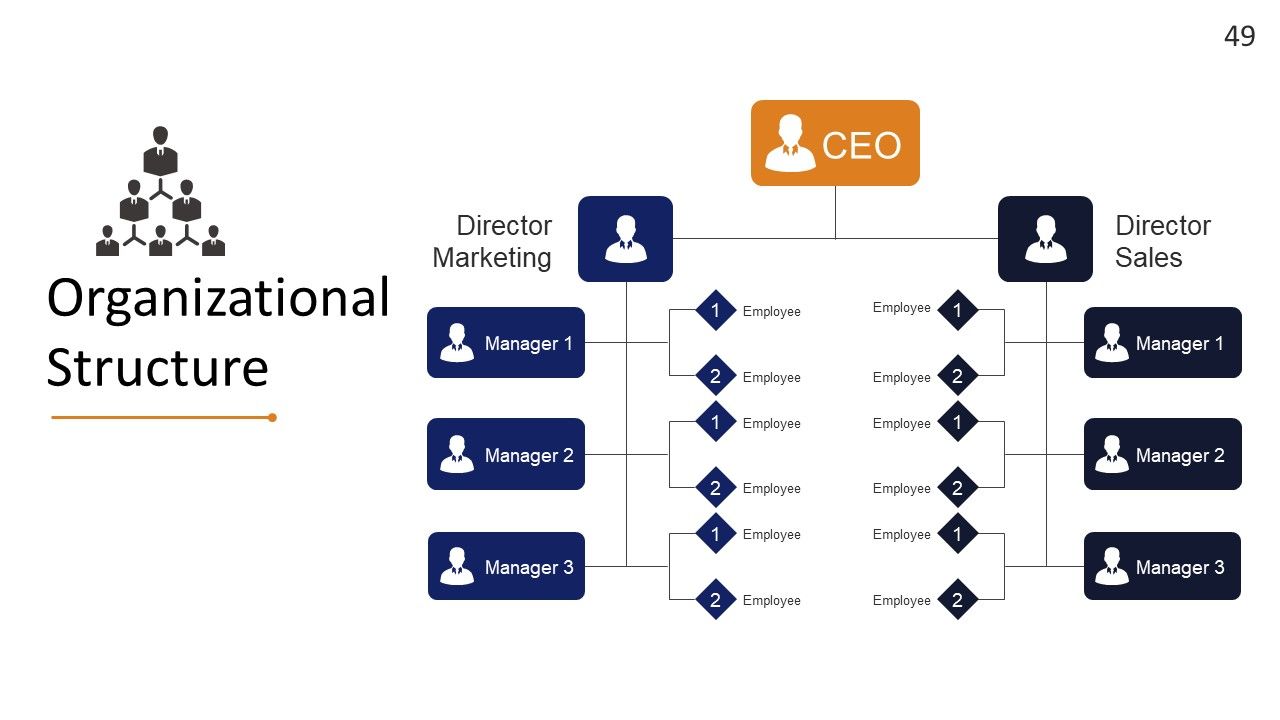
Slide 49: This slide showcases Organizational Structure in org chart form.
Slide 50: This slide presents Ownership And Management with image and text boxes to present information etc.
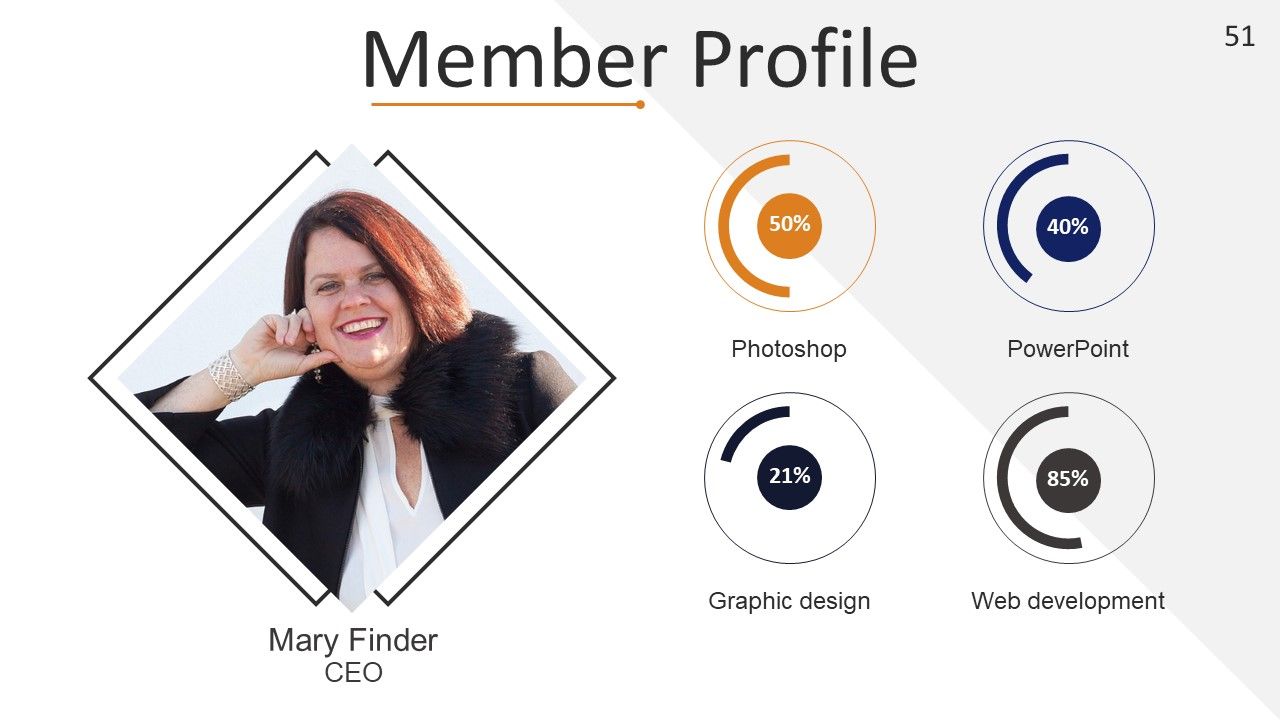
Slide 51: This slide presents Member Profile. State members' specifications, information here.
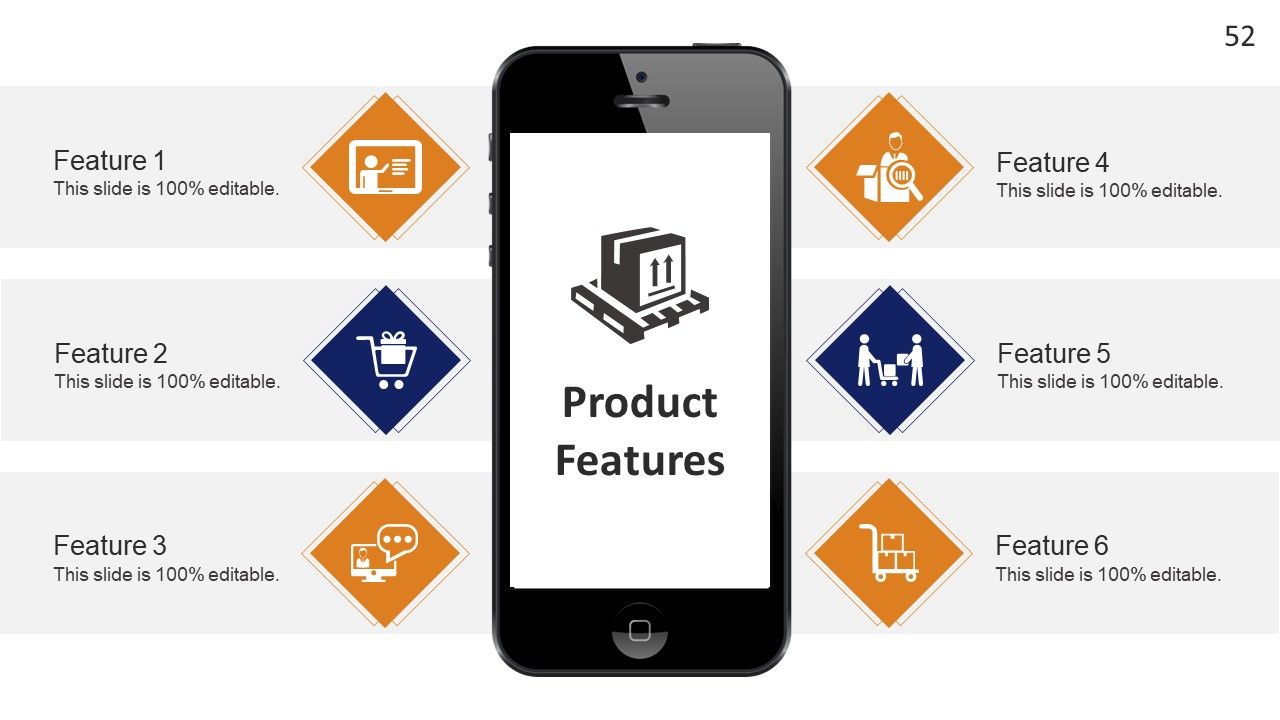
Slide 52: This slide shows Product Features with monitor imagery. State features, etc. here.
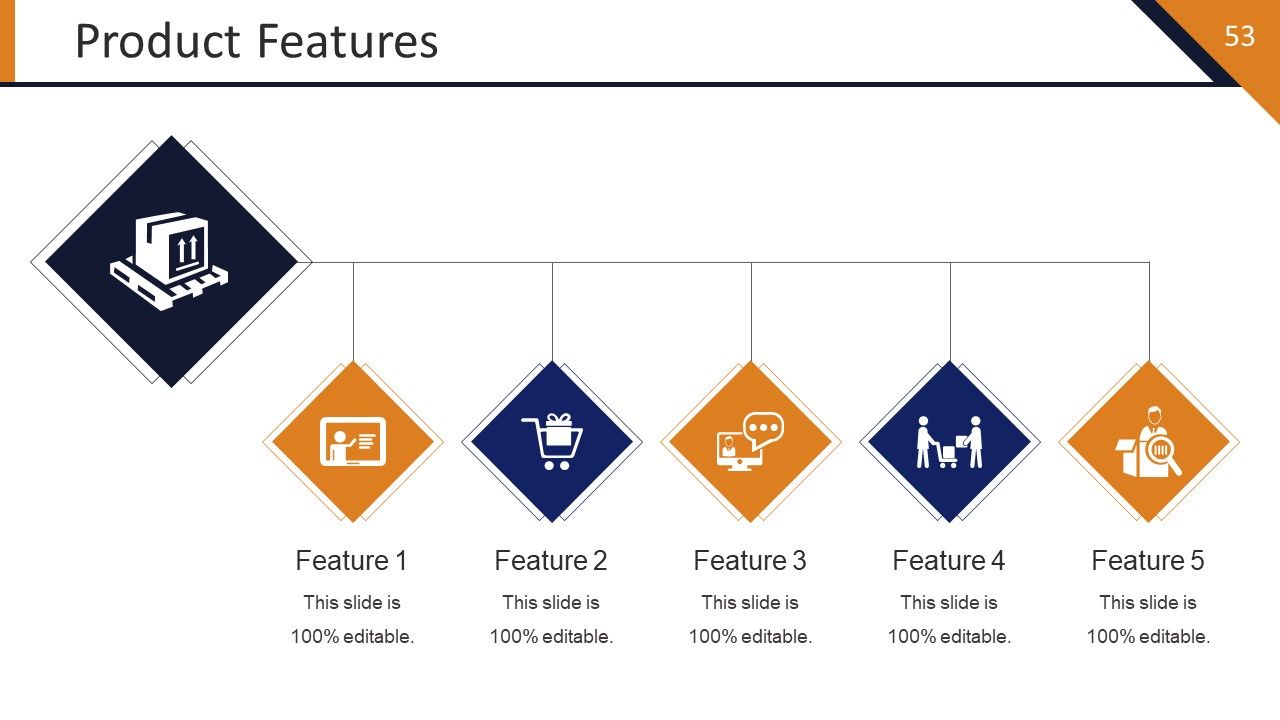
Slide 53: This slide shows Product Features to be displayed. State features, etc. here.
Slide 54: This is a Case Study slide. State its aspects here.
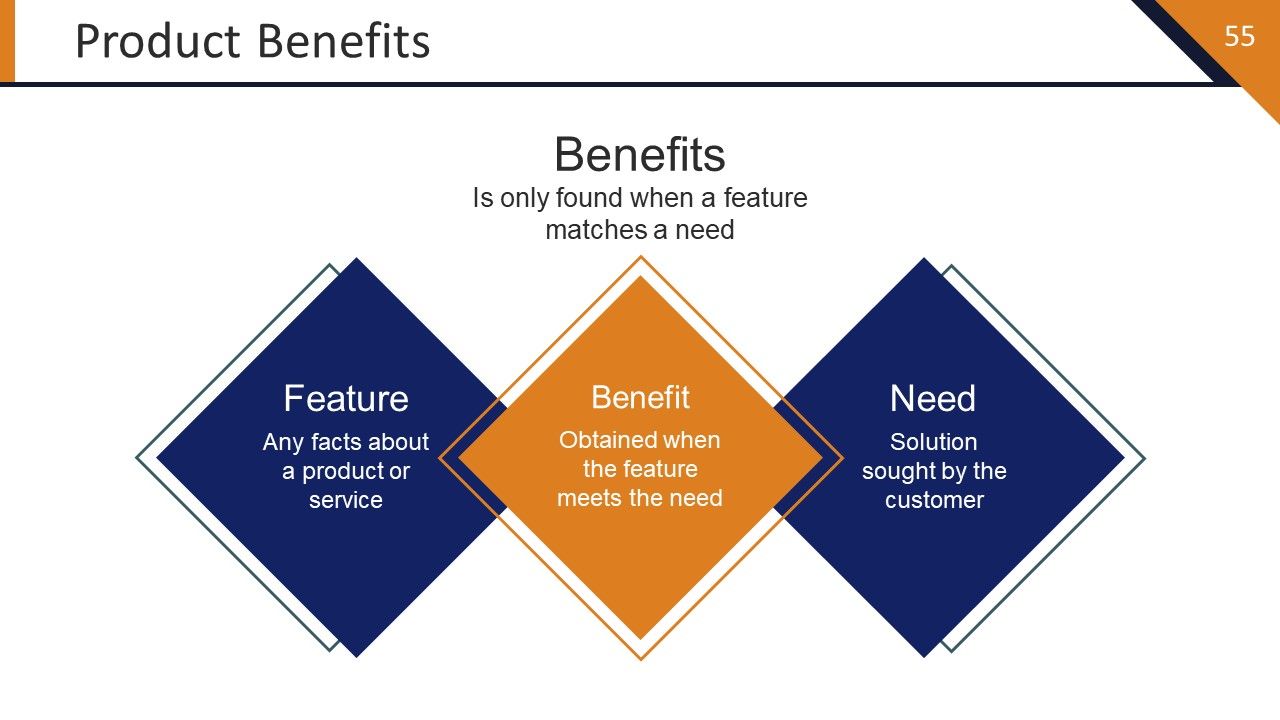
Slide 55: This slide shows Product Benefits displaying Feature, Benefit, Need.
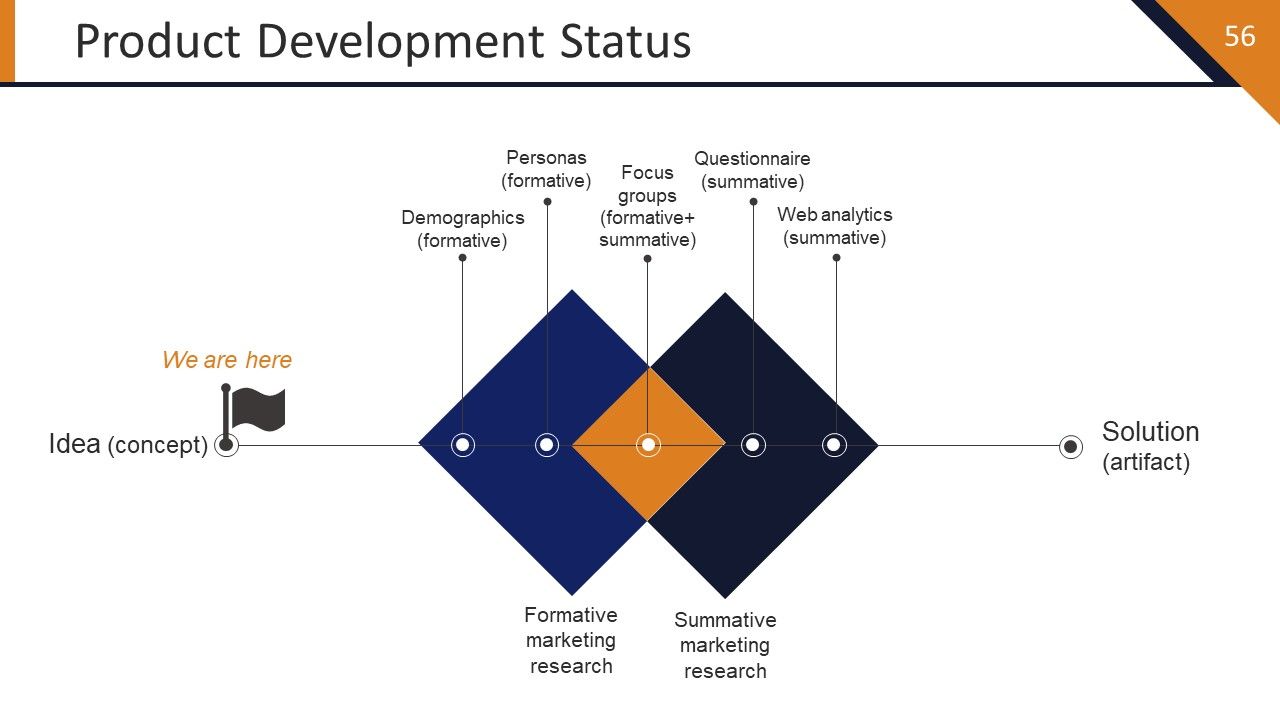
Slide 56: This slide showcases Product Development Status showing- Idea (concept) Solution (artifact) Demographics (formative) Personas (formative) Focus groups (formative+ summative) Questionnaire (summative) Web analytics (summative) Formative marketing research, Summative marketing research.
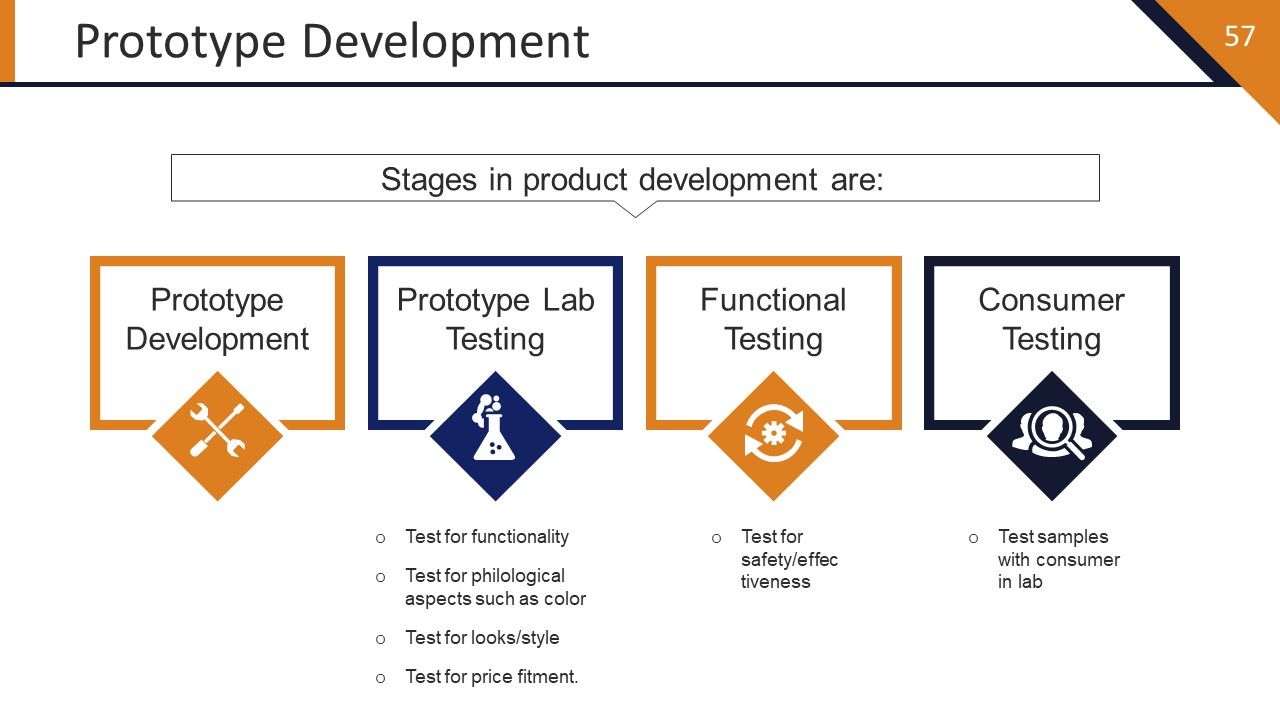
Slide 57: This slide presents Prototype Development with- Stages in product development: Prototype Development, Functional Testing- Test for safety/effectiveness Consumer Testing- Test samples with consumer in lab. Prototype Lab Testing- Test for functionality. Test for looks/style. Test for price fitment. Test for philological aspects such as color.
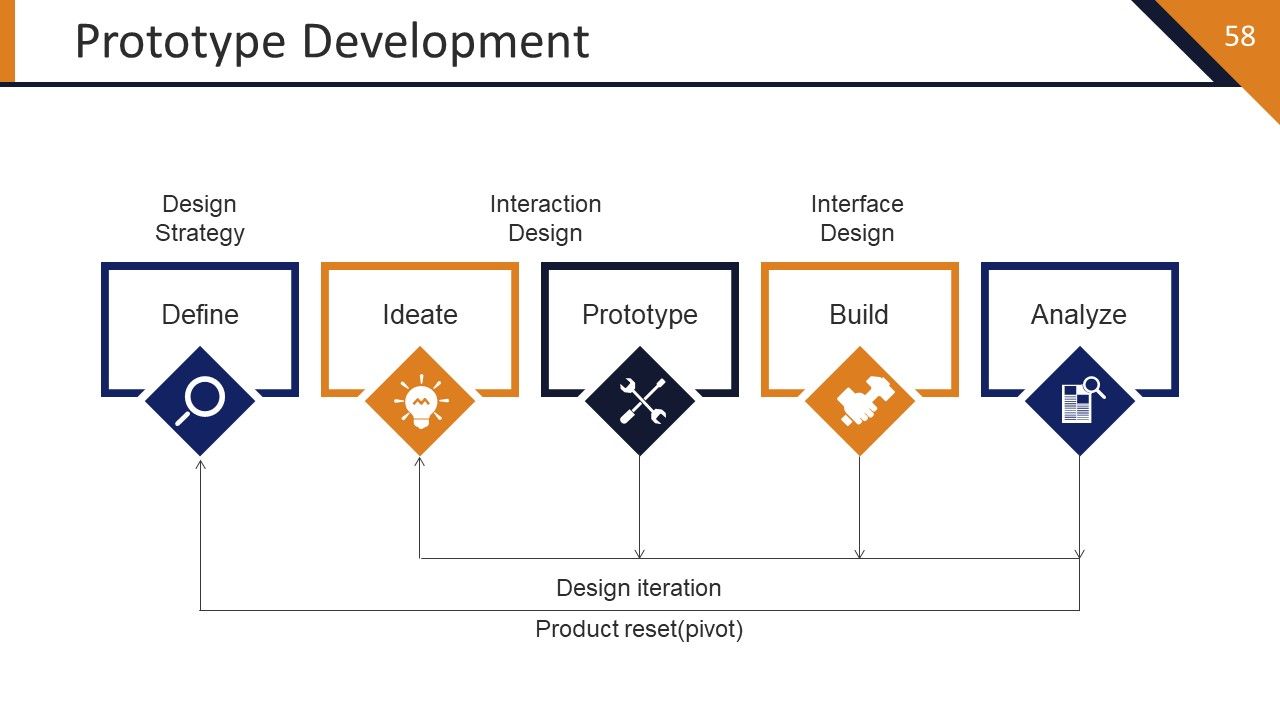
Slide 58: This slide shows Prototype Development showing- Design Strategy, Interaction Design, Interface Design, Design iteration, Product reset(pivot) as Define, Ideate, Prototype, Build, Analyze.
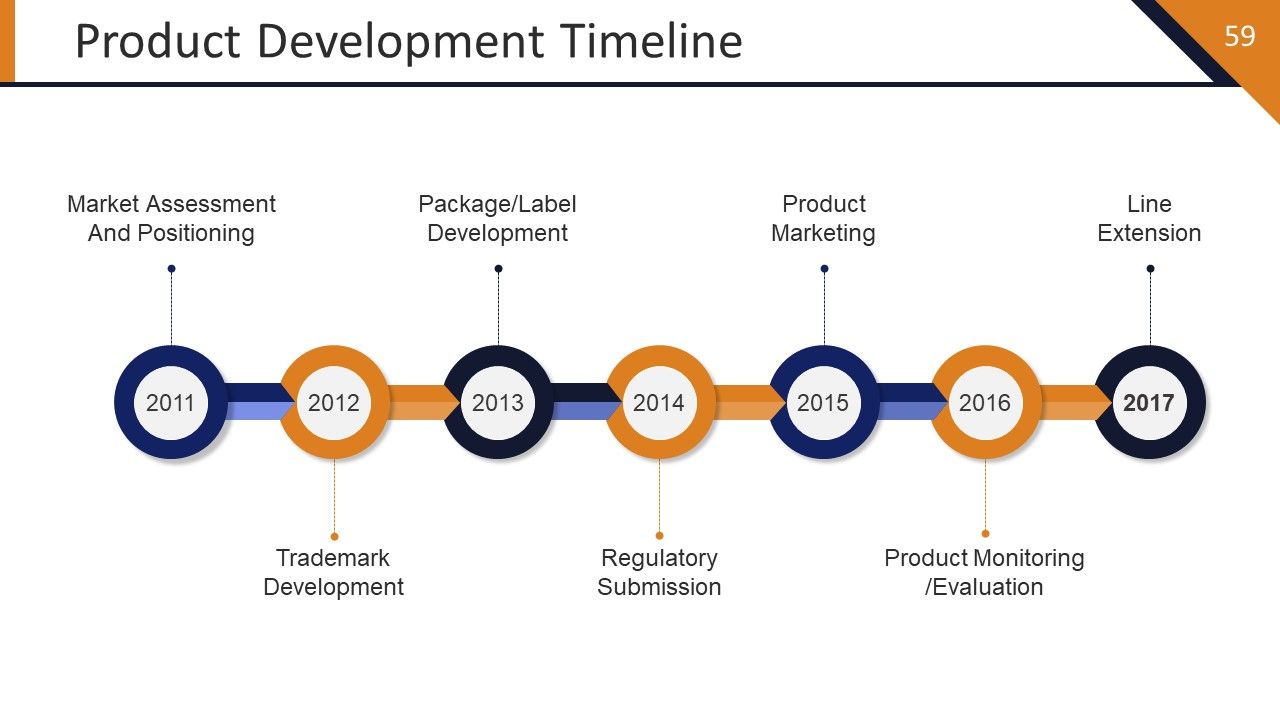
Slide 59: This slide shows Product Development Timeline stating- Market assessment and positioning, Trademark development, Package/label development, Regulatory submission, Product marketing, Product monitoring /evaluation, Line extension.
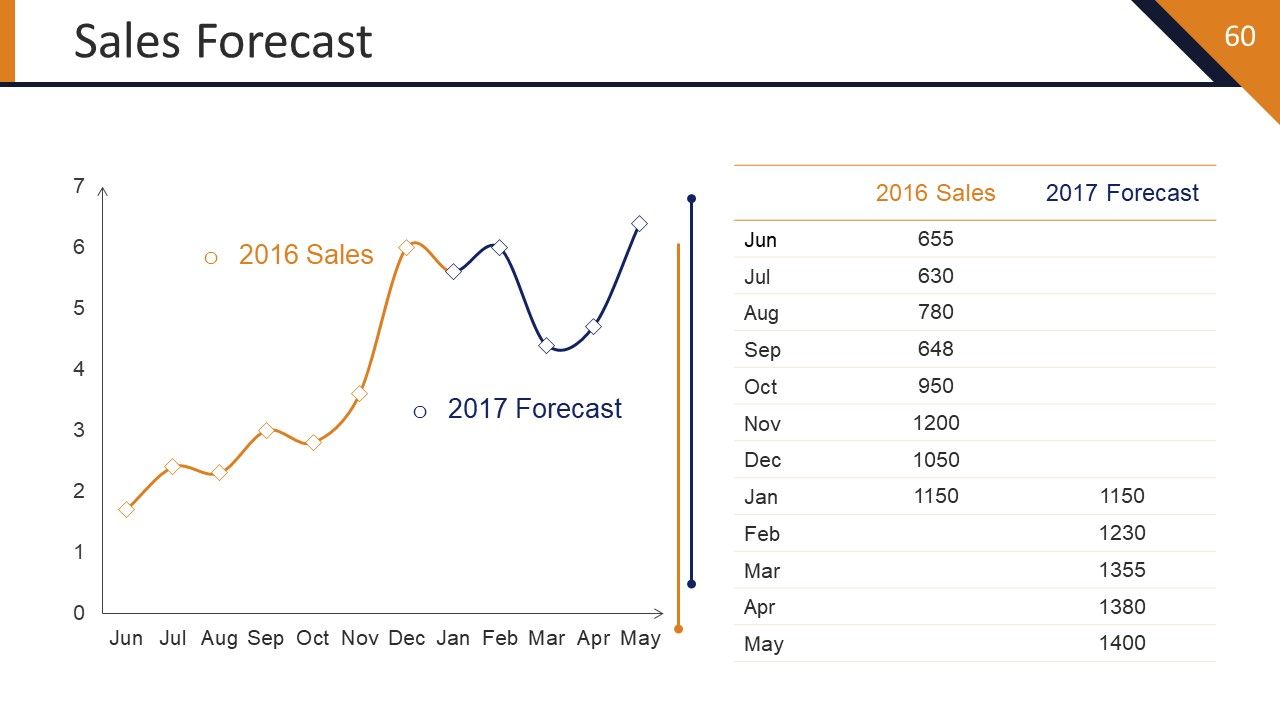
Slide 60: This is a Sales Forecast graph slide.
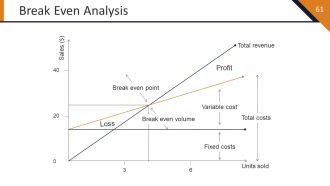
Slide 61: This slide shows a Break Even Analysis displaying- Sales ($), Units sold, Total revenue, Total costs, Break even point, Break even volume, Fixed costs, Variable cost.
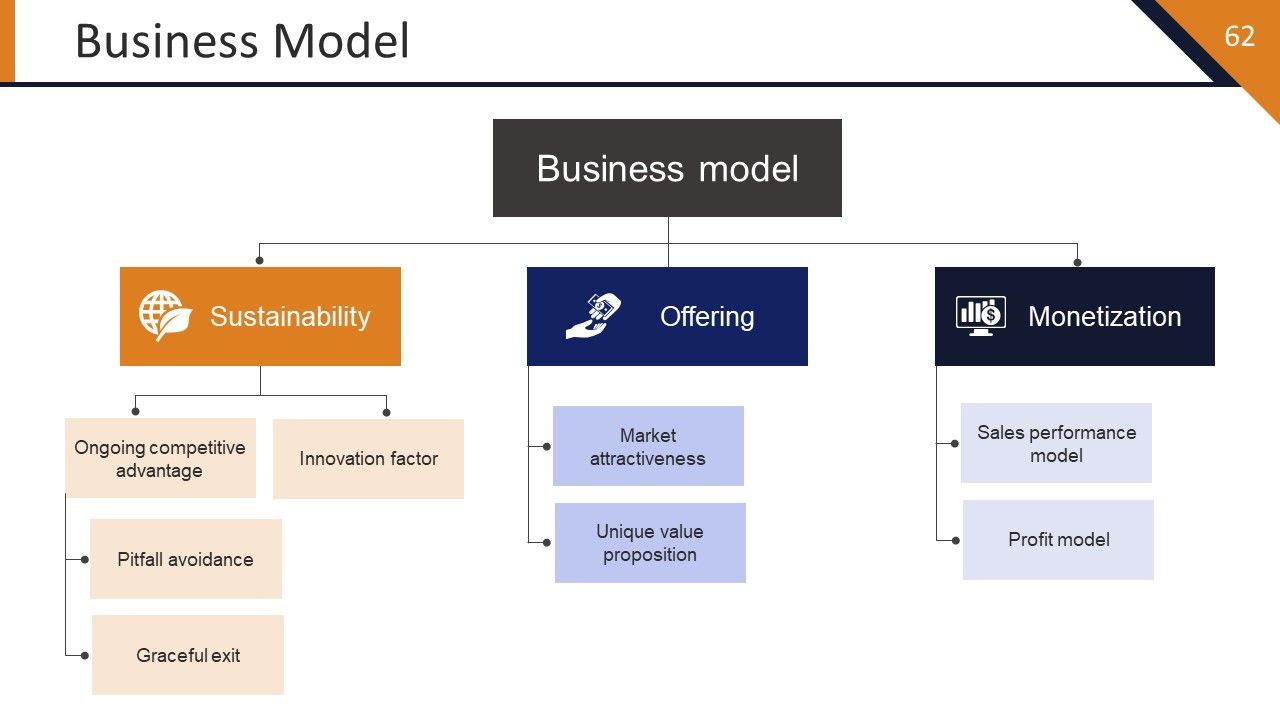
Slide 62: This slide shows a Business Model showcasing- Offering: Market attractiveness, Unique value proposition. Monetization: Profit model, Sales performance model. Sustainability: Ongoing competitive advantage, Innovation factor, Pitfall avoidance, Graceful exit.
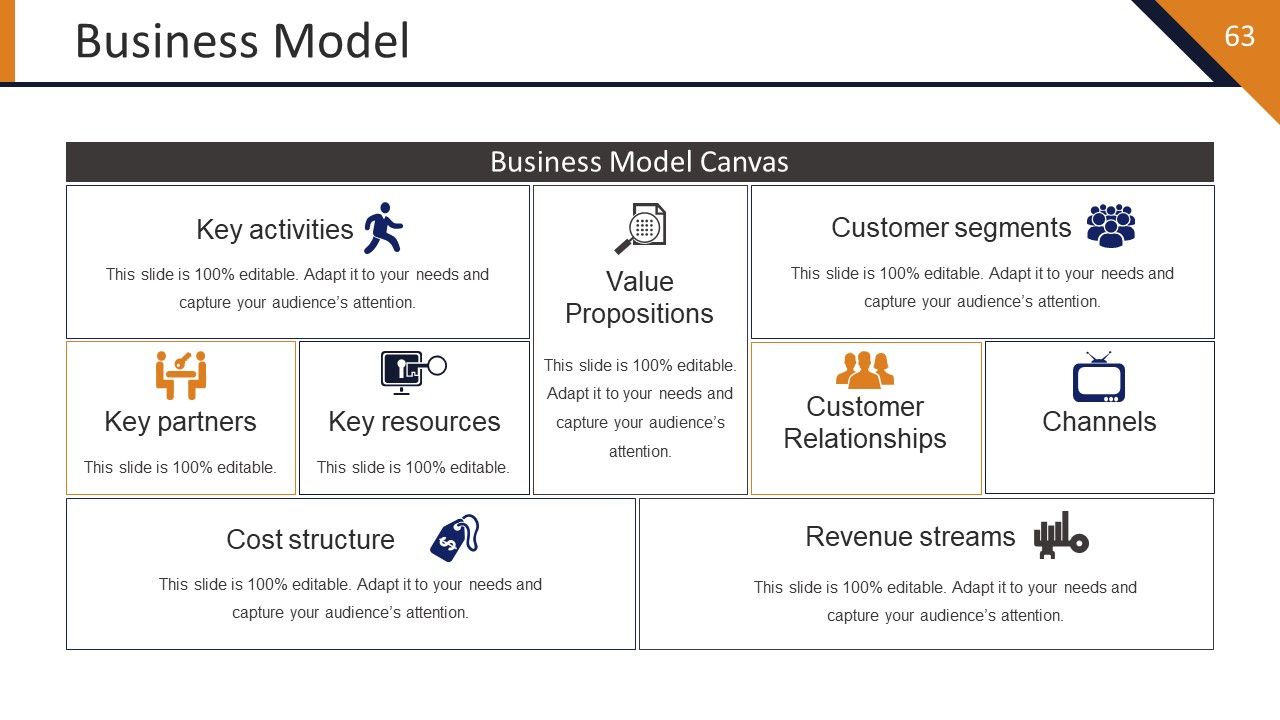
Slide 63: This slide presents a Business Model with Business Model Canvas showcasing- Channels, Key partners, Value Propositions, Key activities, Customer segments, Customer Relationships, Key resources, Cost structure, Revenue streams.
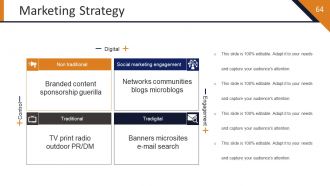
Slide 64: This slide presents Marketing Strategy in matrix form displaying- Digital, Control, Engagement, with Networks communities blogs microblogs, Branded content sponsorship guerilla, Banners microsites e-mail search, TV print radio outdoor PR/DM.
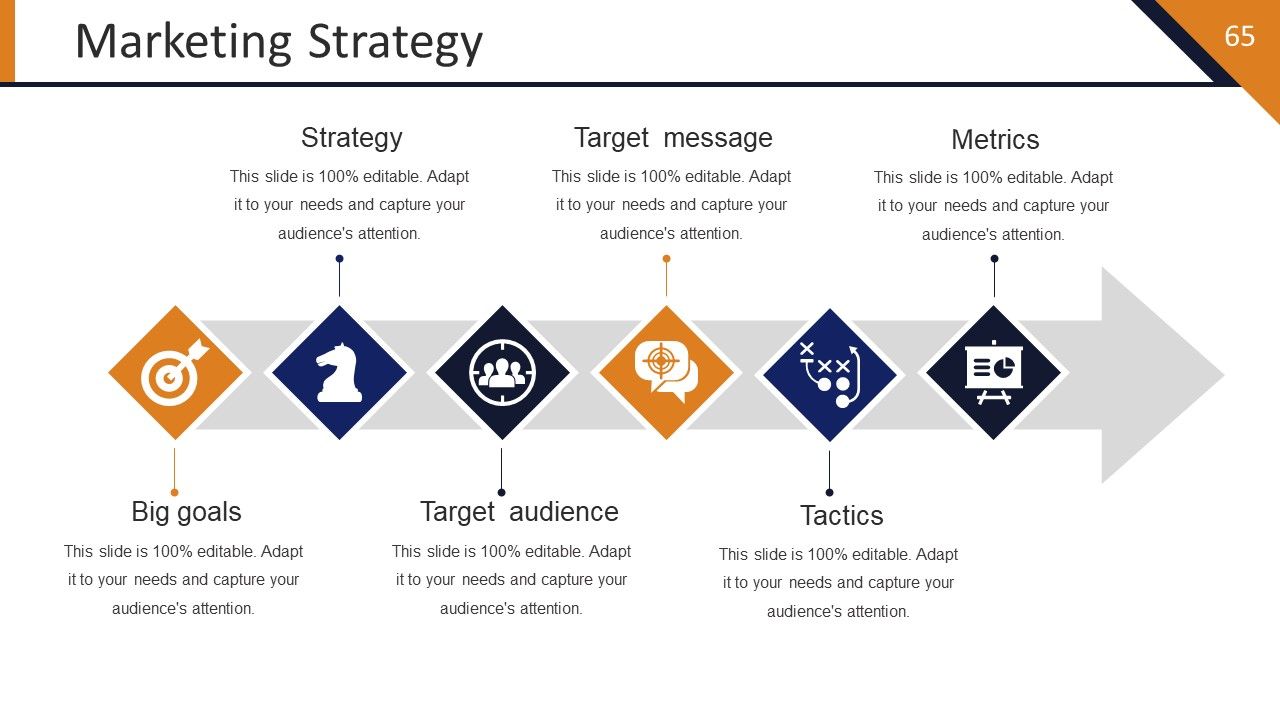
Slide 65: This slide shows Marketing Strategy stating- Big goals, Strategy, Target Audience, Target Message, Tactics, Metrics.
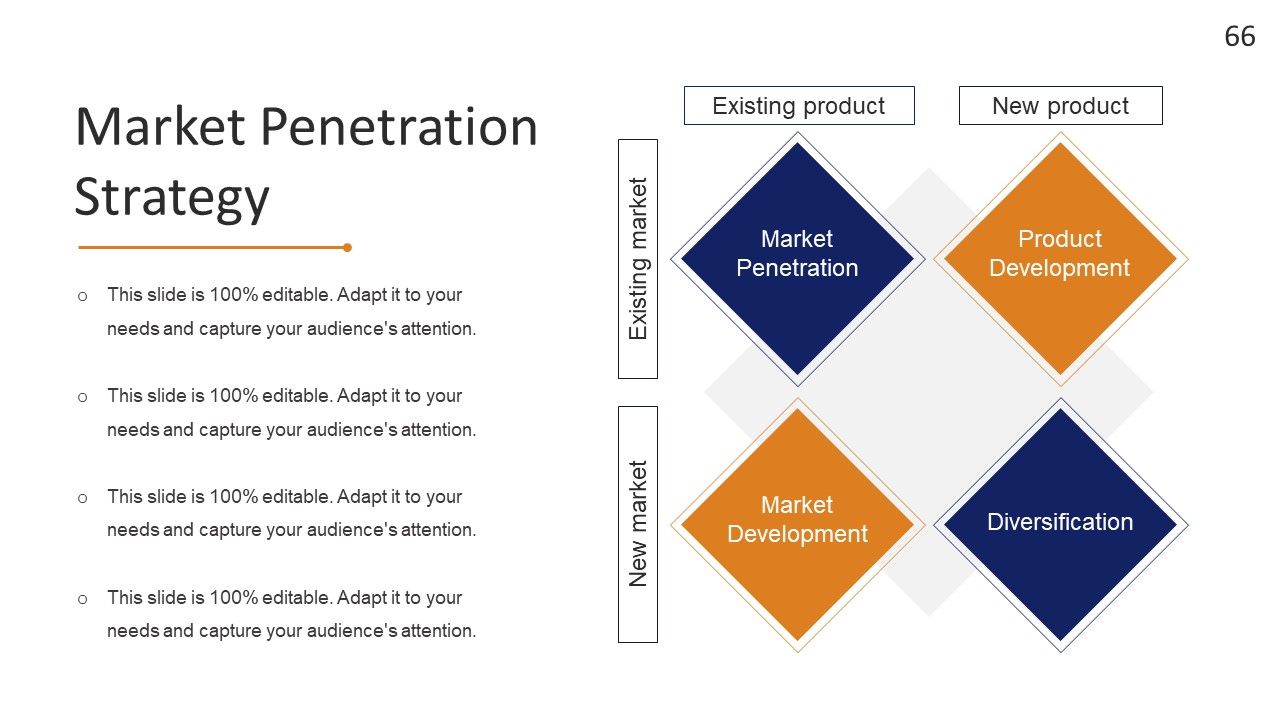
Slide 66: This slide presents Market Penetration Strategy showing- Diversification, Product Development, Market Penetration, Existing market, Market Development.
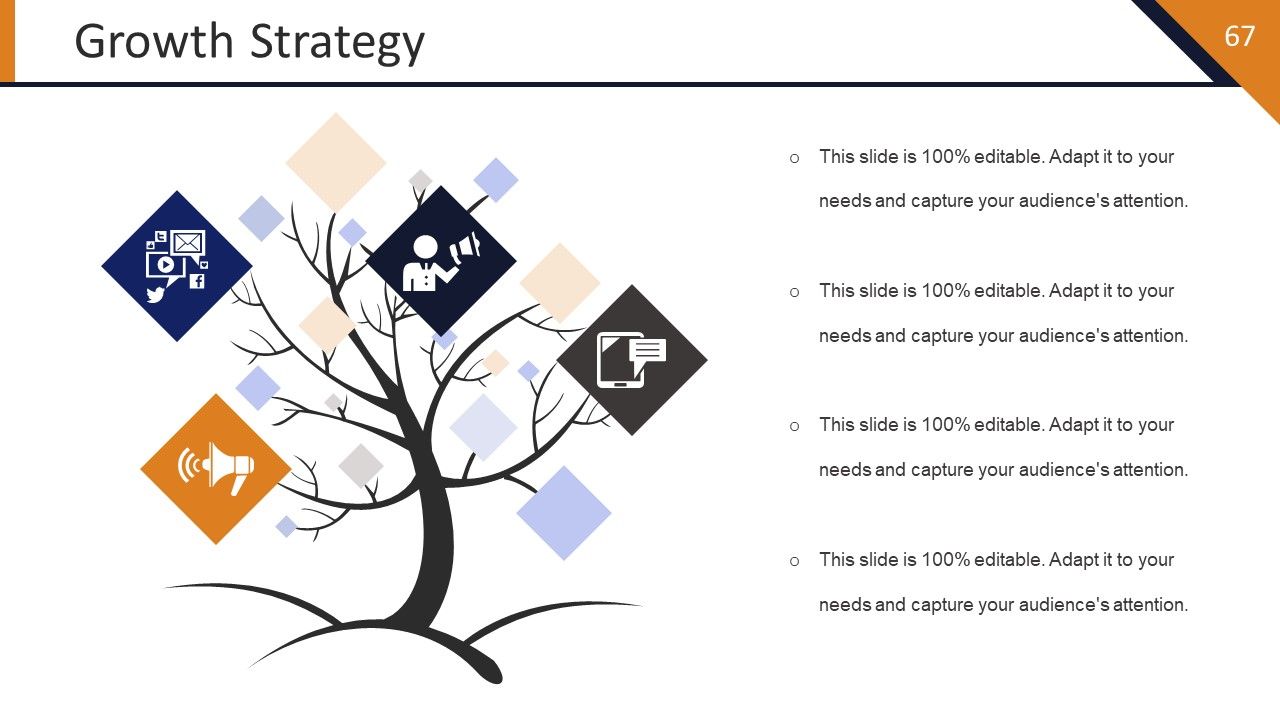
Slide 67: This slide shows Growth Strategy with tree imagery to go with. State growth factors, points, strategies etc. here.
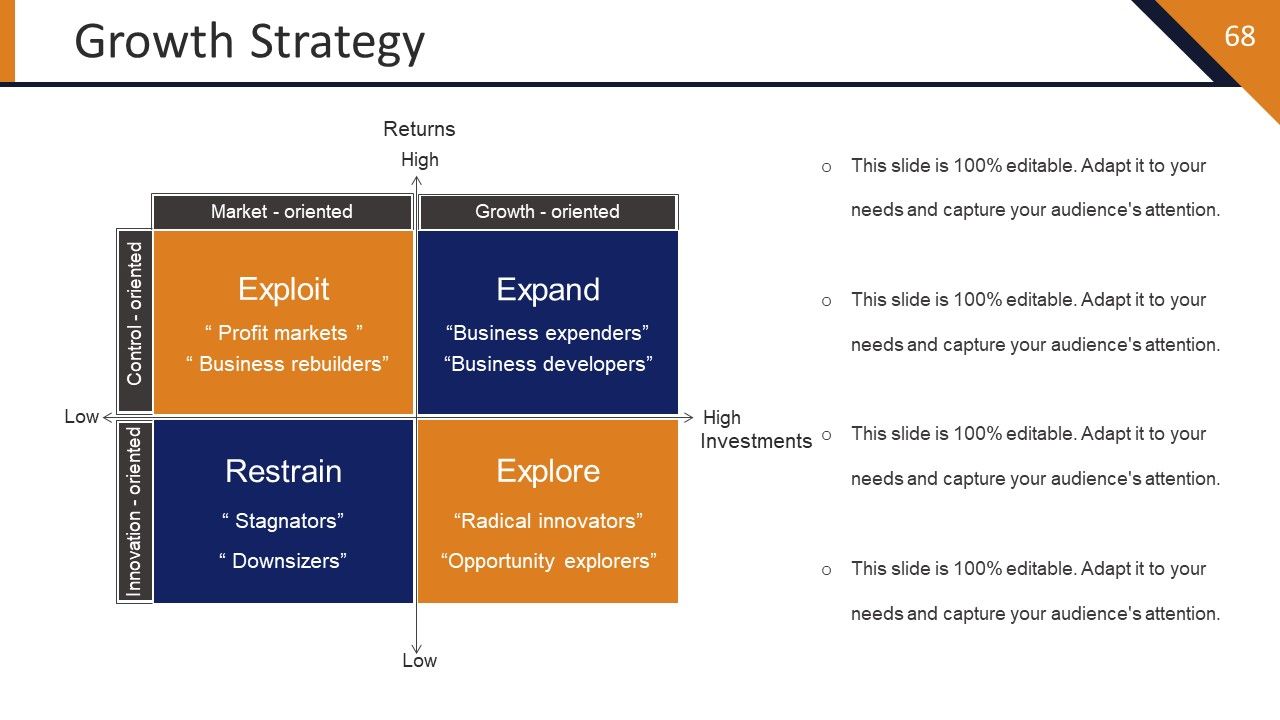
Slide 68: This is a Growth Strategy matrix slide showcasing- Growth - oriented, Market - oriented, Control- oriented, Innovation - oriented entities as Exploit: “ Profit markets ” “ Business rebuilders” Restrain: “ Downsizers” “ Stagnators” Explore: “Opportunity explorers” “Radical innovators” Expand: “Business expenders” “Business developers”.
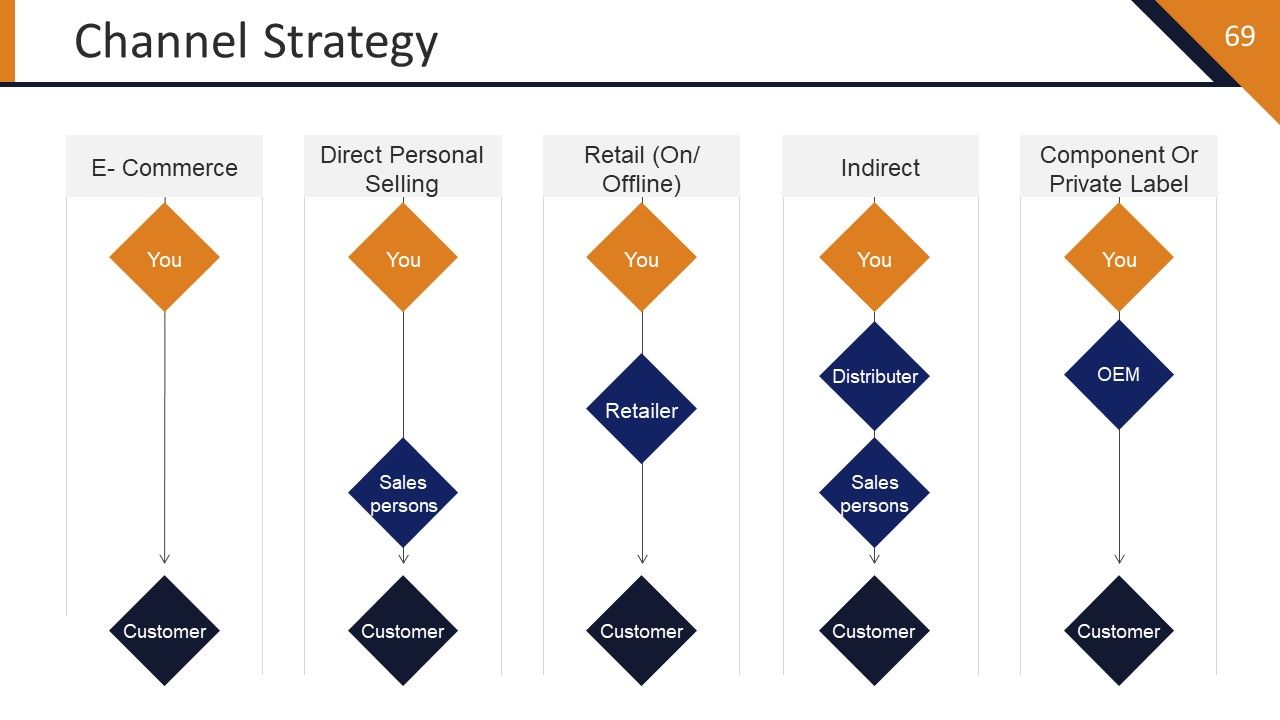
Slide 69: This slide shows a Channel Strategy with- Customer, Sales Person, Retailer, Distributor, OEM, You, E- commerce, Direct personal selling, Retail (on/ offline), Indirect, Component or private label.
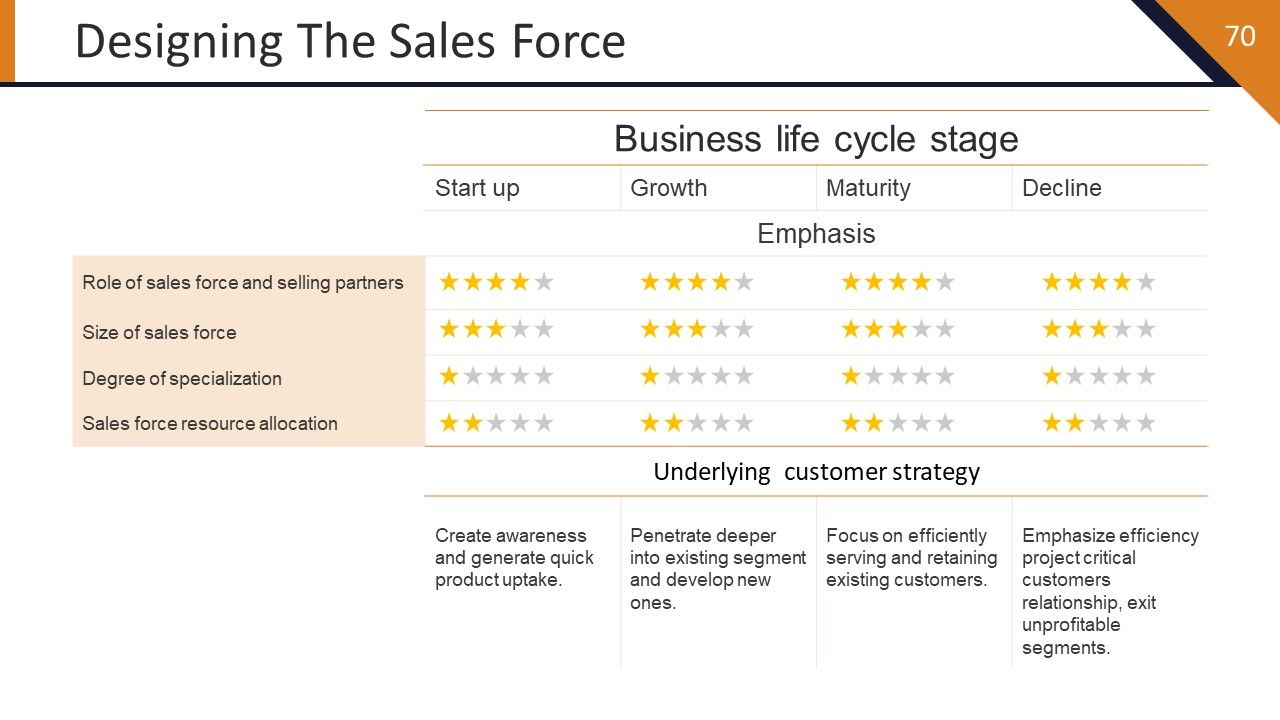
Slide 70: This slide presents Designing The Sales Force in tabular form.
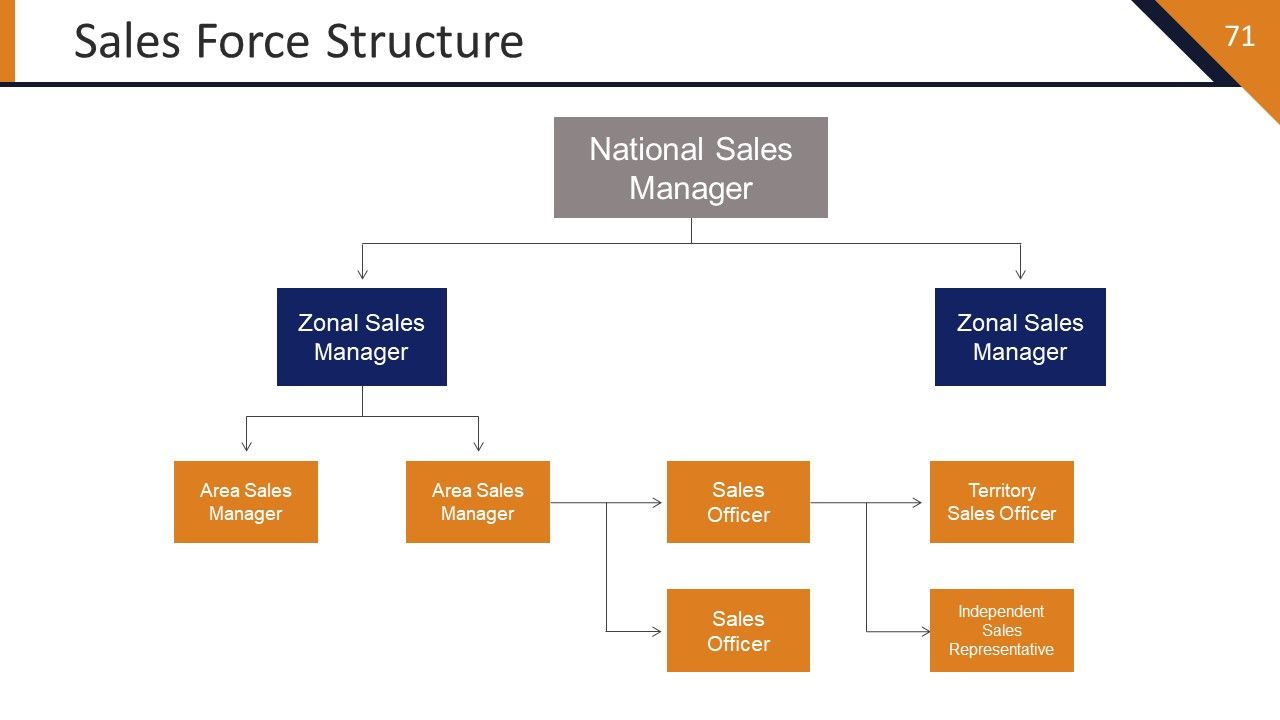
Slide 71: This slide shows Sales Force Structure showing- National sales manager, Zonal sales manager, Area sales manager, Sales officer, Territory sales officer, Independent sales representative, Area sales manager, Sales officer, Zonal sales manager.
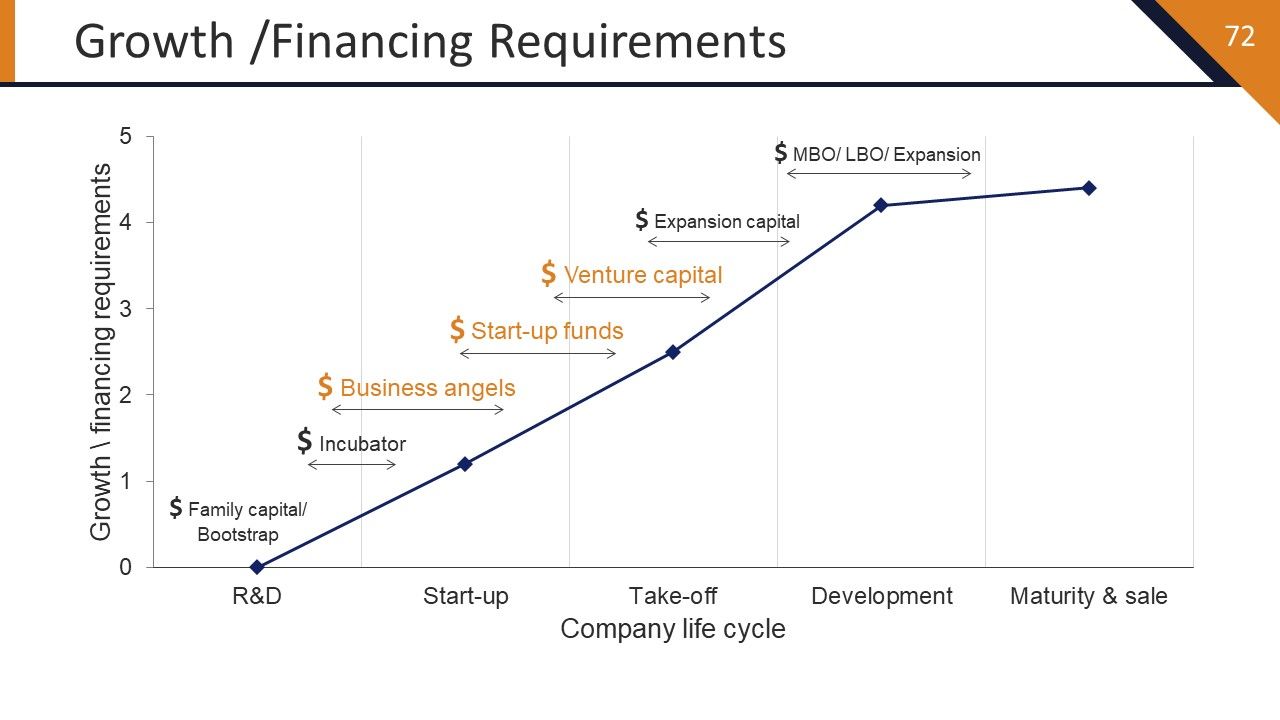
Slide 72: This slide shows Growth /Financing Requirements in graph form showing- Family capital/ Bootstrap, Incubator, Business angels, Start-up funds, Venture capital, Expansion capital MBO/ LBO/ Expansion.
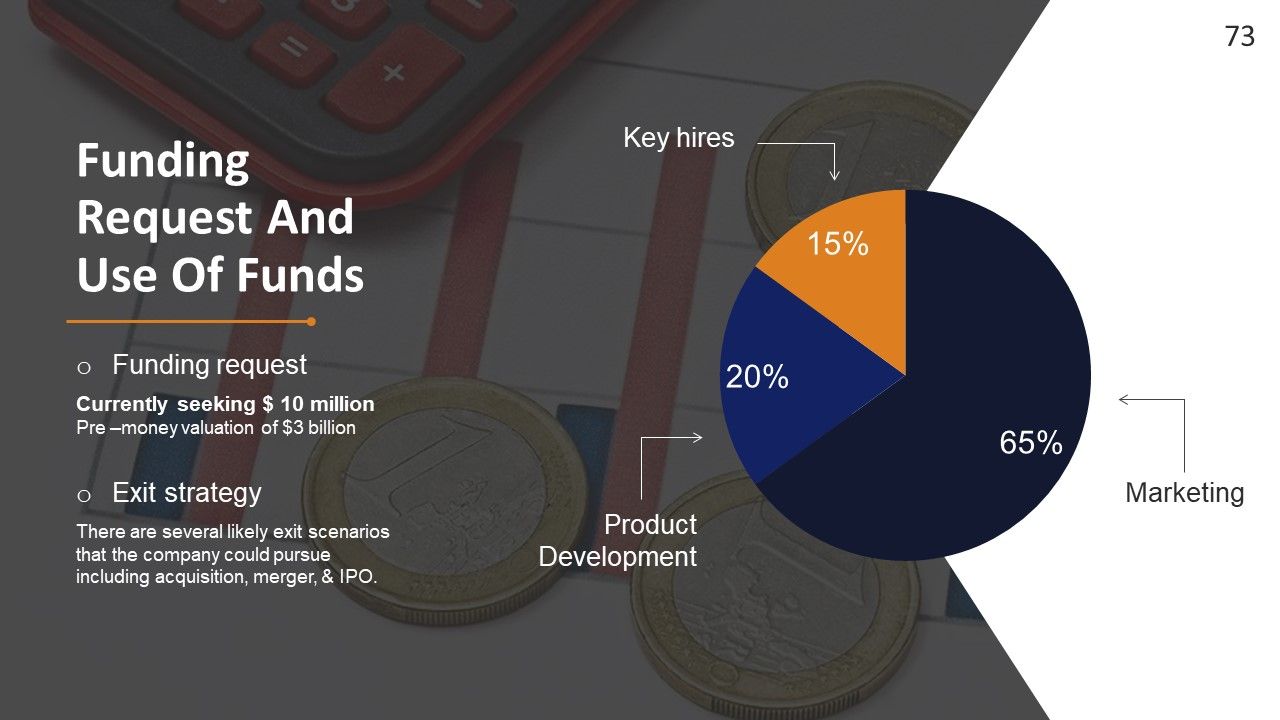
Slide 73: This slide shows Funding Request And Use Of Funds with- Exit strategy, Funding request, Key hires, Product development, Marketing.
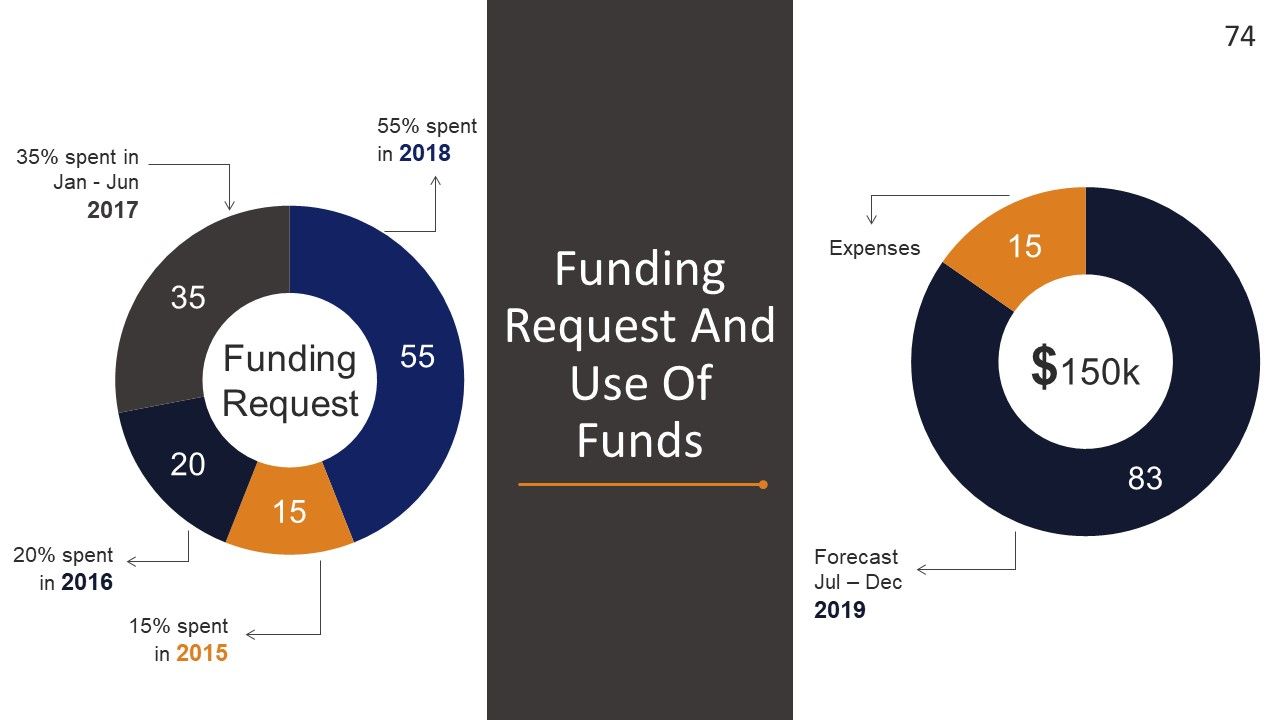
Slide 74: This slide shows Funding Request And Use Of Funds with- Funding Request, Forecast, Expenses.
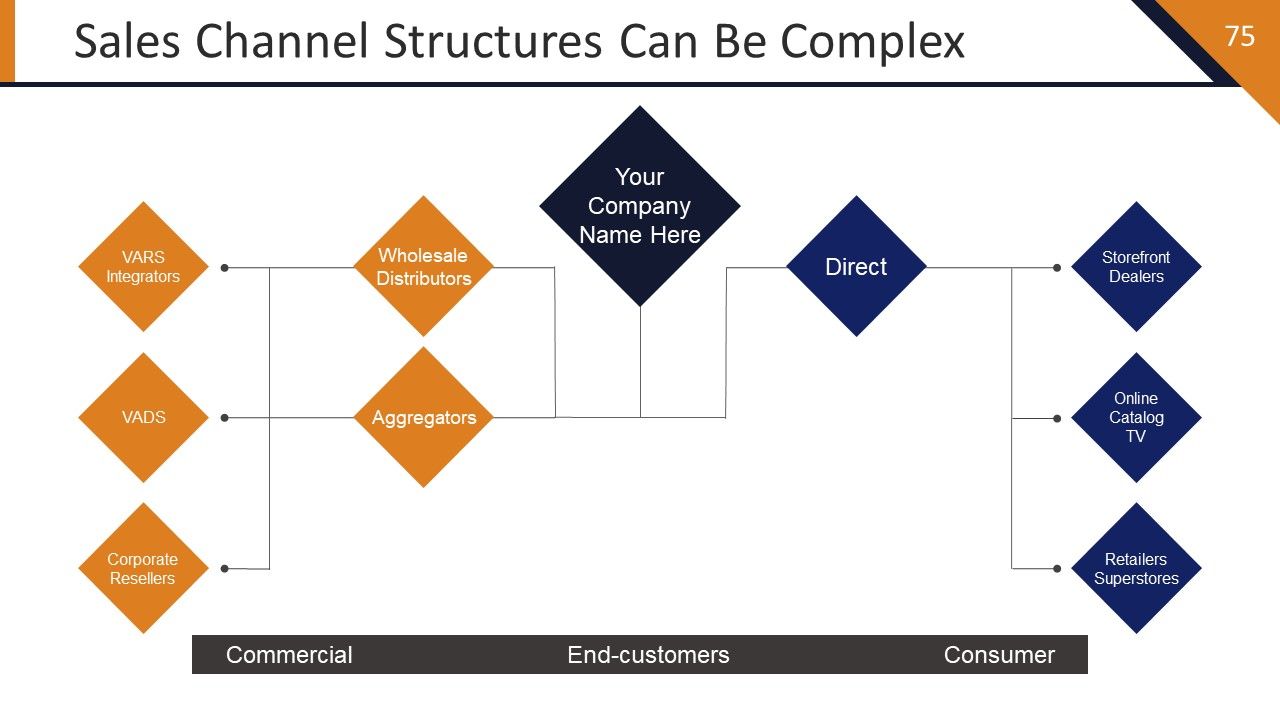
Slide 75: This slide shows Sales Channel Structures Can Be Complex showing- Wholesale Distributors, Retailers superstores Aggregators, Integrators, Storefront dealers, Corporate resellers.
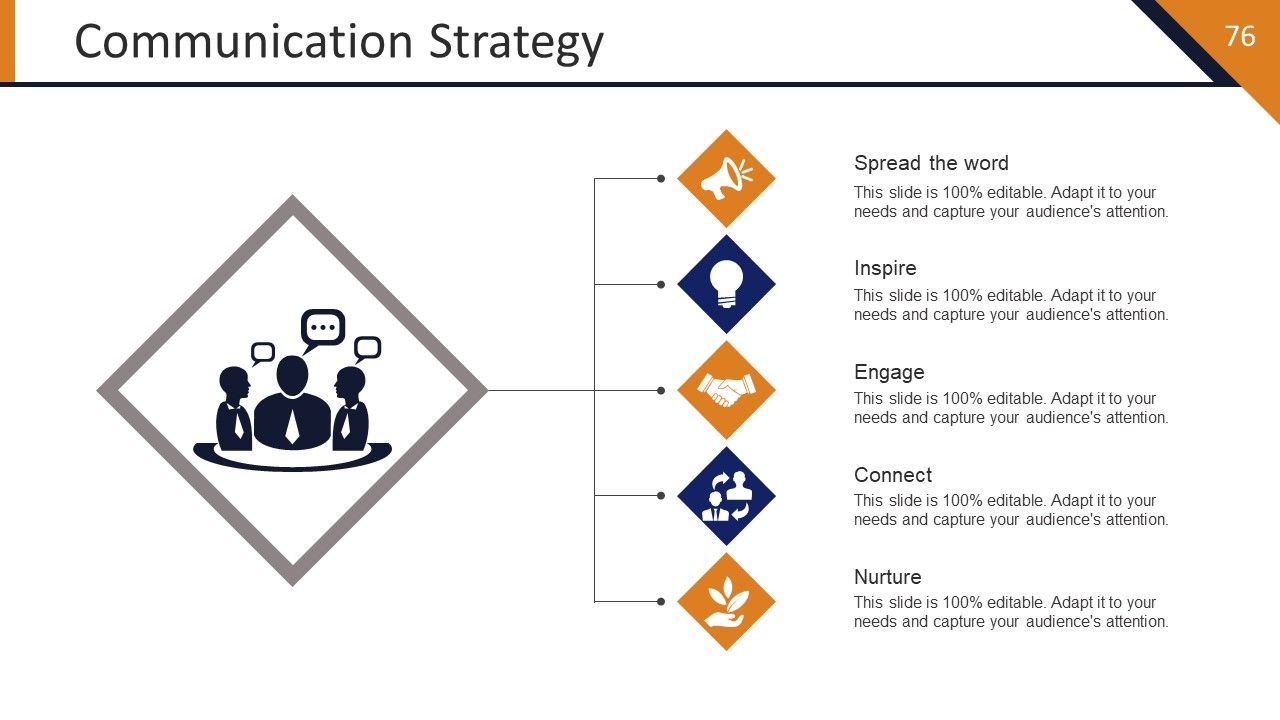
Slide 76: This slide presents the Communication Strategy with the following content- Spread the word, Inspire, Engage, Connect, Nurture.
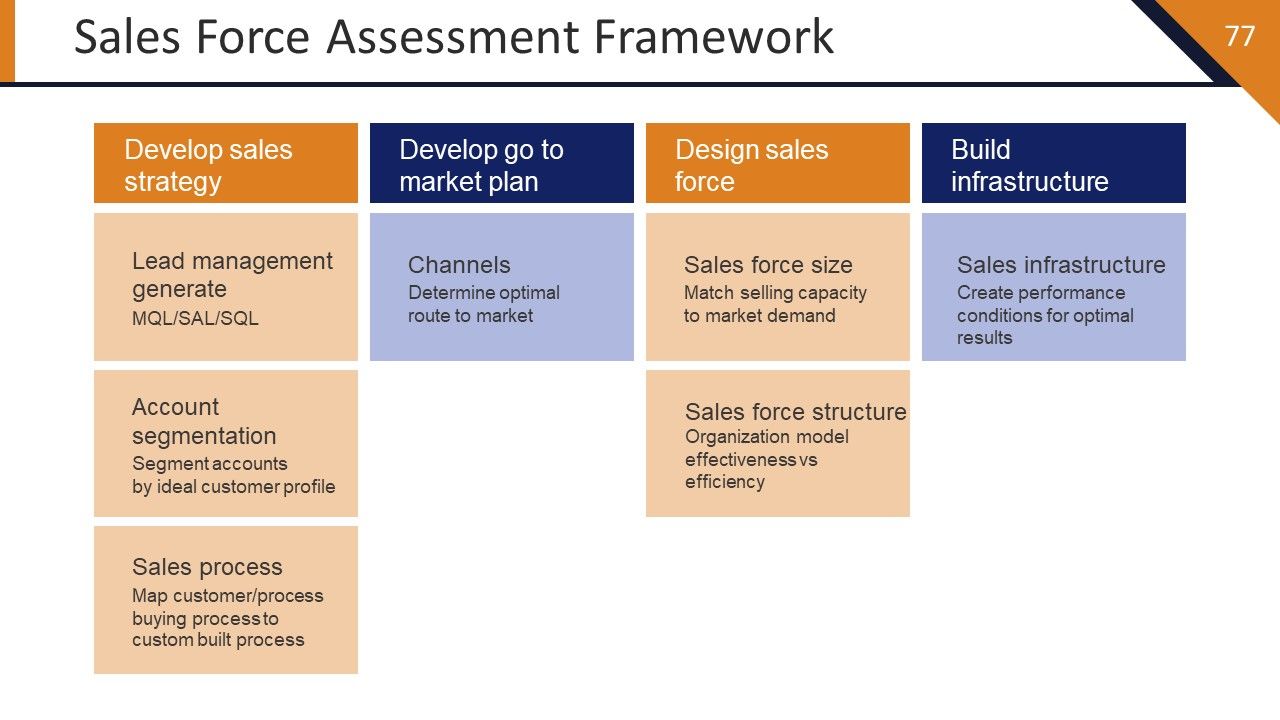
Slide 77: This slide shows Sales Force Assessment Framework displaying- Develop sales strategy, Lead management generate, MQL/SAL/SQL, Design sales force, Build infrastructure, Develop, go to market plan, Account segmentation, Segment accounts by ideal customer profile, Sales process, Map customer/process buying process to custom built sales process, Channels, Determine optimal route to market, Sales infrastructure, Create performance conditions for optimal results, Sales force size, Match selling capacity to market demand, Sales force structure, Organization model effectiveness vs efficiency.
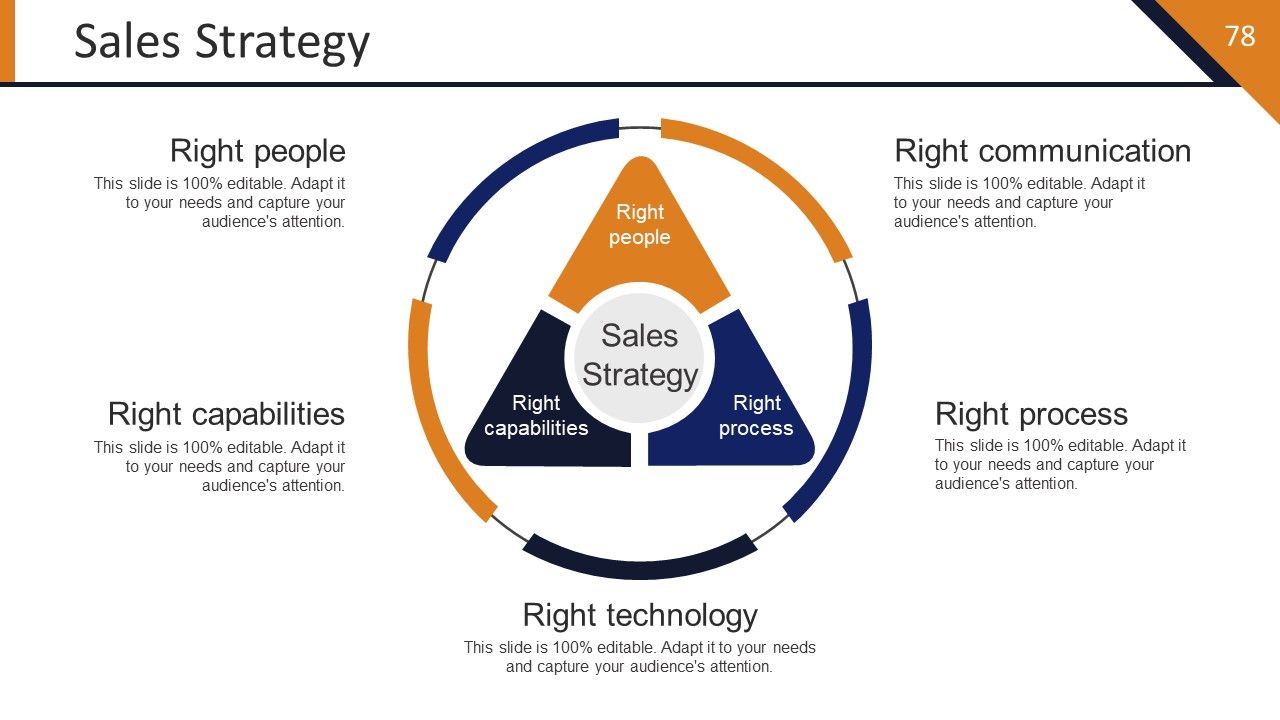
Slide 78: This slide shows Sales Strategy showcasing- Right people, Right communication, Right capabilities, Right process, Right technology, Right capabilities, Right people, Right process.
Slide 79: This is a Thank You slide with Address# street number, city, state, Contact Numbers, Email Address.
Startup Strategy Framework Powerpoint Presentation Slides with all 79 slides:
Get the data in your hands with our Startup Strategy Framework Powerpoint Presentation Slides. Everything becomes easily available.
FAQs
A Startup Strategy Framework typically includes an Executive Summary, Market Insights, Key Financials, Objectives, Strategic Positioning, Product and Services, Understanding of the Marketplace and Consumer Needs, Customer Value Proposition, Value Proposition Canvas, Market Analysis Summary, Industry Snapshot, Target Market, and Market Size.
Market Insights is a section in the Startup Strategy Framework that provides information about the market, including market share, target market, serviceable available market (SAM), total available market (TAM), your target market, and your market share. It is usually presented in graph form.
The Startup Strategy Framework includes Projected Key Financials in bar and line graph forms, showing sales, net profit, and gross profit. It also showcases financial predictions such as monthly break-even, aggregate break-even, revenue, expenses, and aggregate net income.
The Customer Value Proposition Ladder is a tool used to identify and communicate the value of a product or service to the customer. It is presented in the Startup Strategy Framework as a ladder diagram that shows emotional benefits, rational benefits, target and insights, brand features with product features, rational benefits, emotional benefits, and defines the consumer.
The Industry Snapshot section of the Startup Strategy Framework includes information about the business, employment, revenue, revenue vs. employment growth, and private investment in computers and software. It is presented in both graph and box image forms.
-
Unique design & color.
-
Great designs, really helpful.


