Company Operations Powerpoint Presentation Slides
Understand the processes of the organization by utilizing this Company Operations Powerpoint Presentation Slides. Mention the seven steps of operation management by utilizing this readily available business plan PPT slideshow. Showcase the strategic functions of the organization by taking the aid of operational plan PPT layouts. Generate a quality cost report in order to maintain production and output quality with the help of this business operations PPT slideshow. Elaborate the strategies for forward and backward integration such as raw materials, intermediate goods, manufacturing, marketing sales, etc with the help of the business operations management PowerPoint slides. Showcase the elements of operational management strategy using these corporate operations PPT visuals. Determine the production capacity needed by an organization to meet changing demands for its products with the help of operation management PPT templates. Thus understand the functions that are important to the stability and profitability of any business by downloading this operation plan PPT presentation.
Understand the processes of the organization by utilizing this Company Operations Powerpoint Presentation Slides. Mentio..
- Google Slides is a new FREE Presentation software from Google.
- All our content is 100% compatible with Google Slides.
- Just download our designs, and upload them to Google Slides and they will work automatically.
- Amaze your audience with SlideTeam and Google Slides.
-
Want Changes to This PPT Slide? Check out our Presentation Design Services
- WideScreen Aspect ratio is becoming a very popular format. When you download this product, the downloaded ZIP will contain this product in both standard and widescreen format.
-

- Some older products that we have may only be in standard format, but they can easily be converted to widescreen.
- To do this, please open the SlideTeam product in Powerpoint, and go to
- Design ( On the top bar) -> Page Setup -> and select "On-screen Show (16:9)” in the drop down for "Slides Sized for".
- The slide or theme will change to widescreen, and all graphics will adjust automatically. You can similarly convert our content to any other desired screen aspect ratio.
Compatible With Google Slides

Get This In WideScreen
You must be logged in to download this presentation.
PowerPoint presentation slides
This PPT deck displays eighty slides with in-depth research. Our topic oriented Company Operations Powerpoint Presentation Slides presentation deck is a helpful tool to plan, prepare, document and analyze the topic with a clear approach. This PPT can be saved in multiple image formats such as JPEG, PNG, and PDF. It is compatible with Google Slides which makes it accessible at once Professionals, managers, individuals and teams involved in any company organization from any field can use them as per requirement.
People who downloaded this PowerPoint presentation also viewed the following :
Content of this Powerpoint Presentation
Slide 1: This slide introduces Company Operations. State your company name and begin.
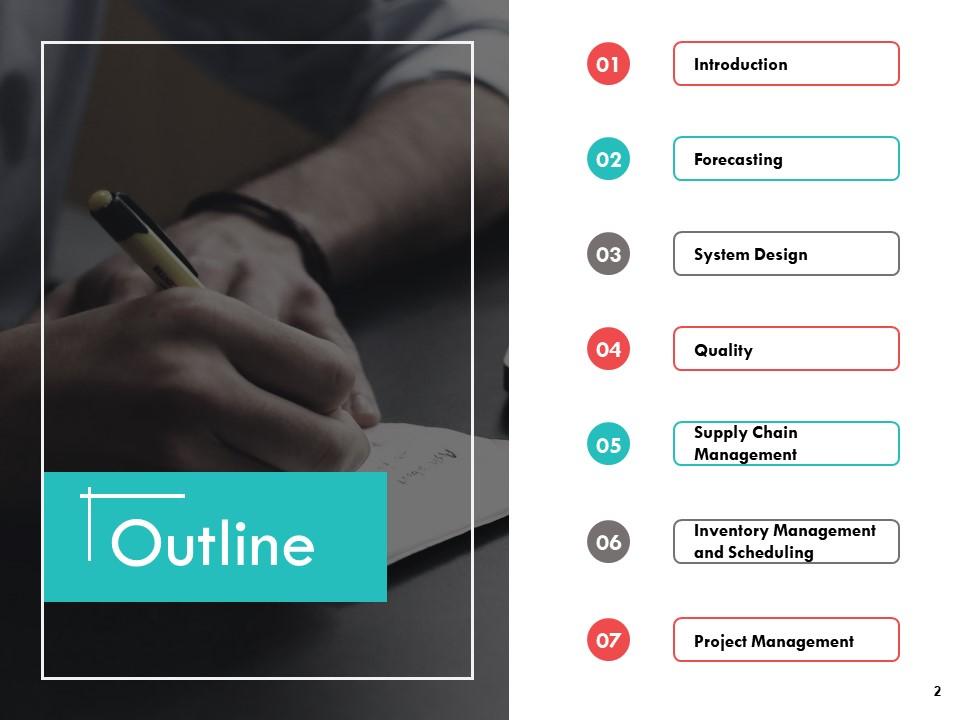
Slide 2: This slide displays the Outline of the presentation.
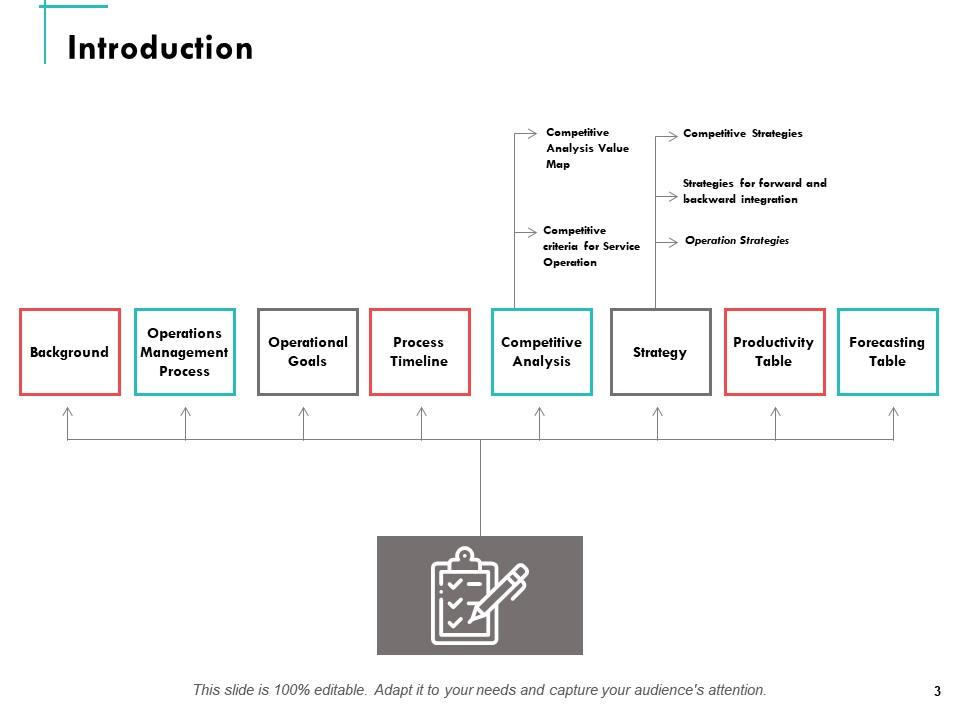
Slide 3: This slide displays the Introduction.
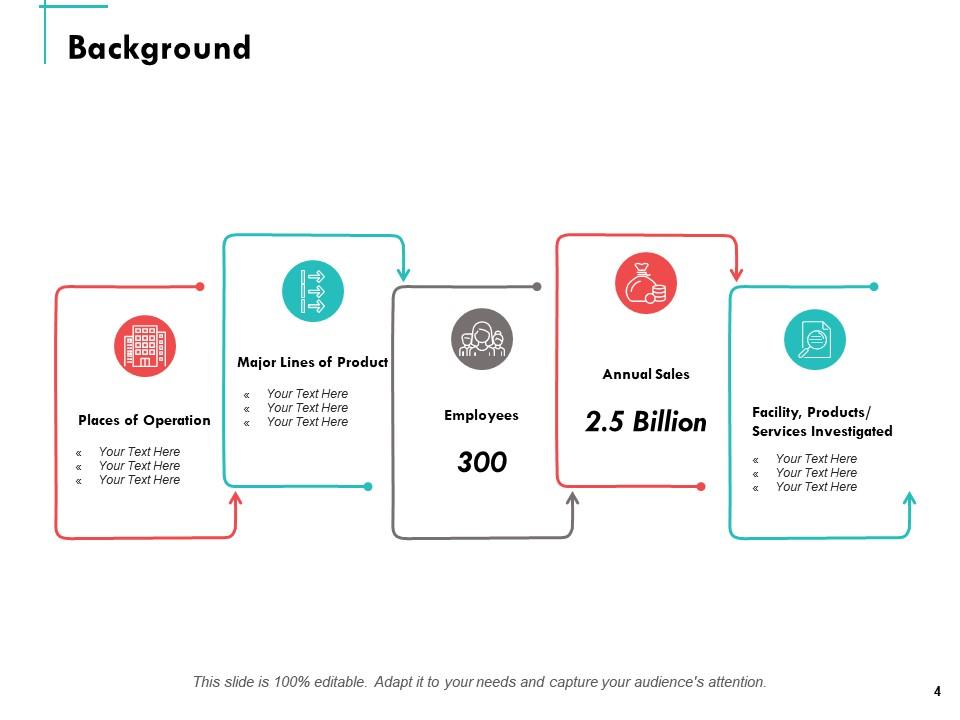
Slide 4: This slide showcases the Background with- Places of Operation, Major Lines of Product, Employees, Annual Sales, 2.5 Billion, Facility, Products/ Services Investigated.
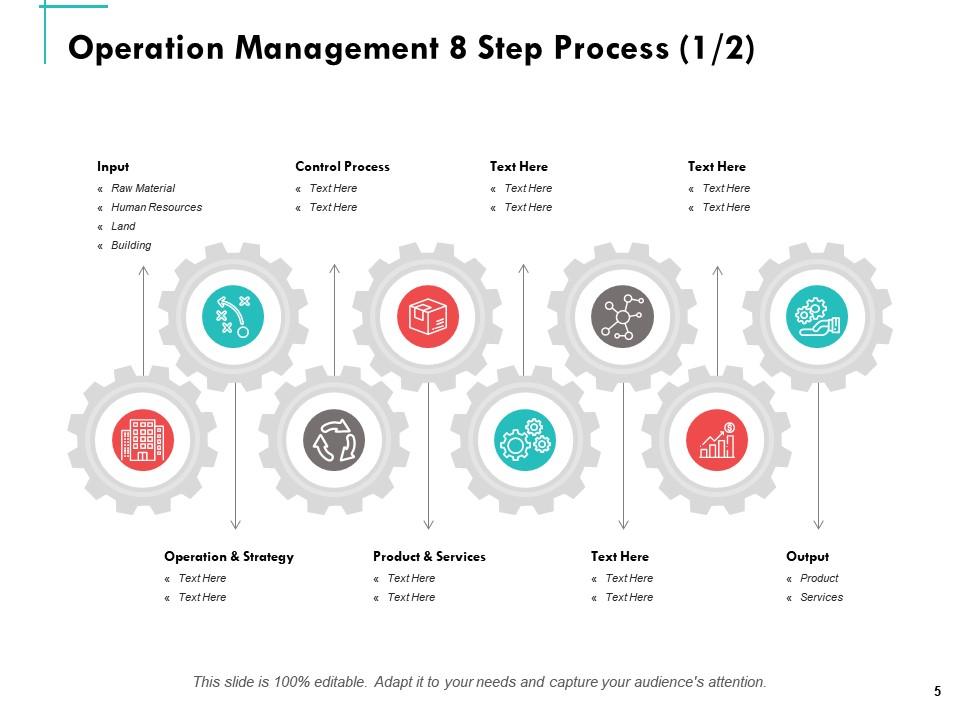
Slide 5: This slide showcases Operation Management with 8 Step Process. This slide is 100% editable. Adapt it to your needs and capture your audience's attention.
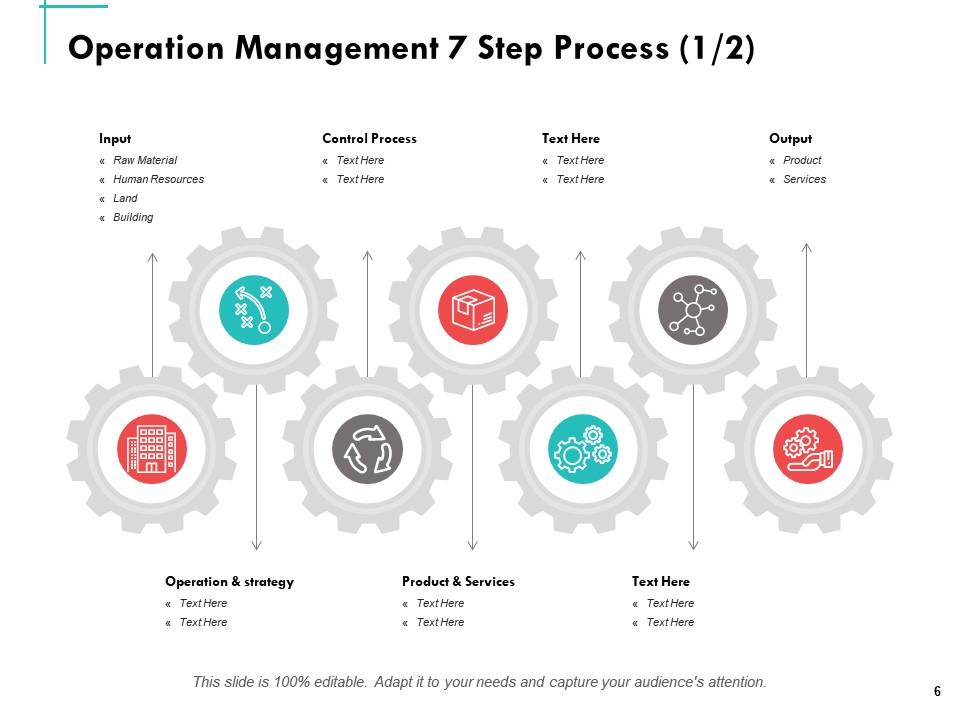
Slide 6: This slide depicts Operation Management with 7 Step Process.
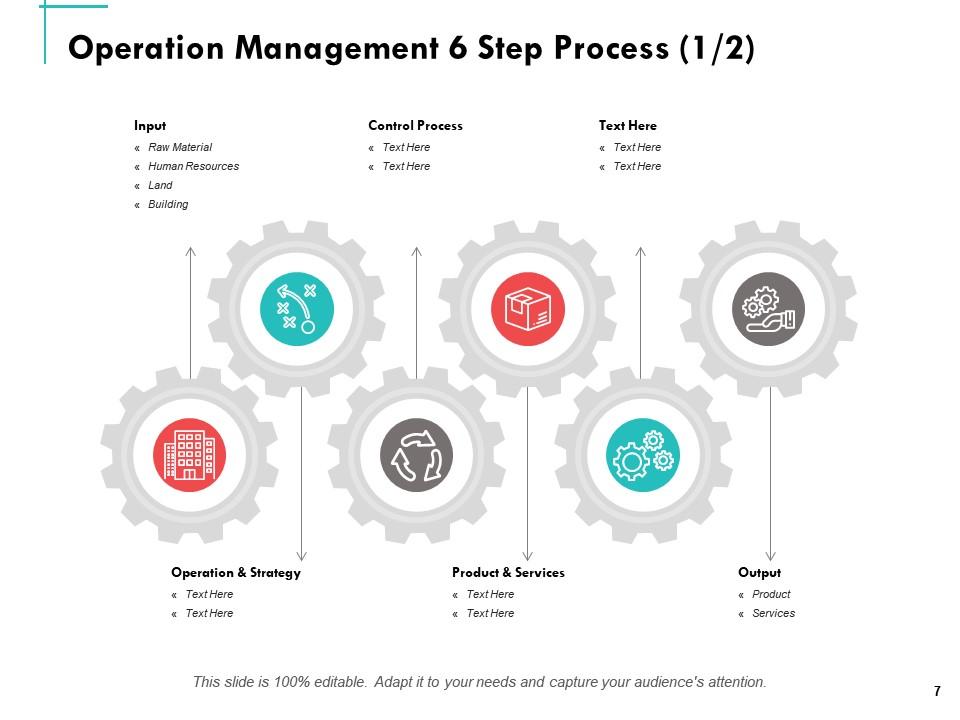
Slide 7: This slide showcases Operation Management with 6 Step Process containing- Input, Raw Material, Human Resources, Land, Building, Operation & Strategy.
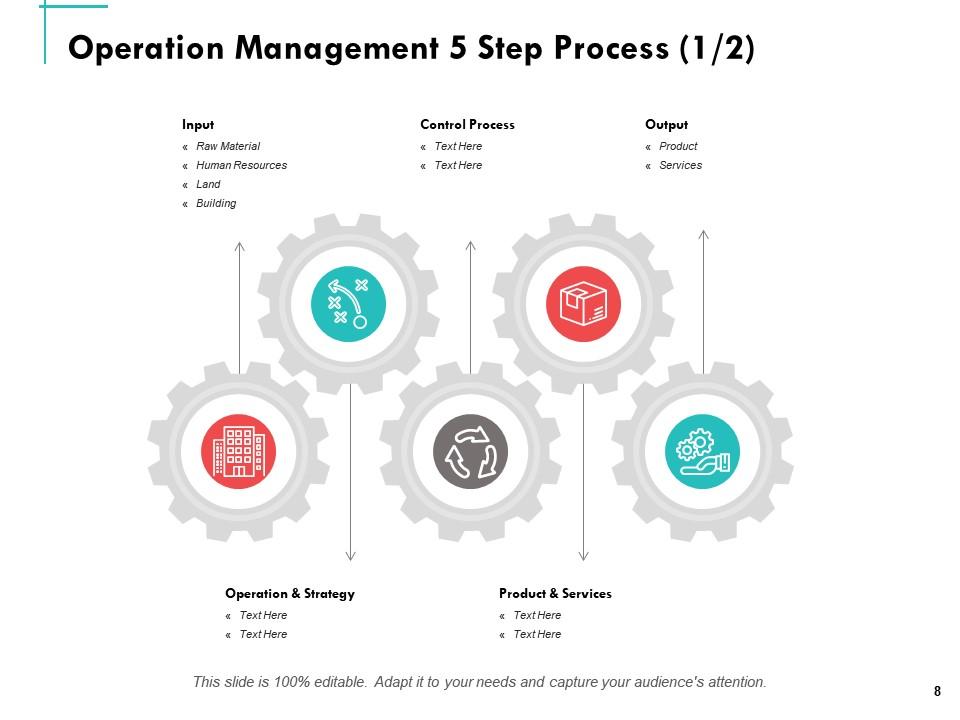
Slide 8: This slide depicts Operation Management 5 Step Process.
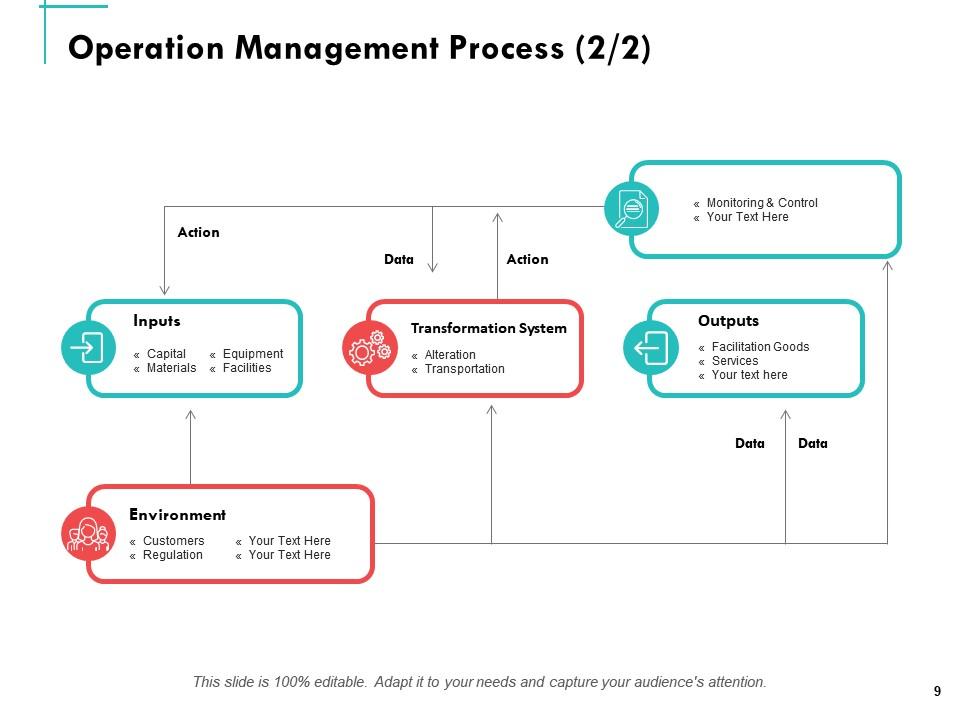
Slide 9: This slide displays the Operation Management Process.
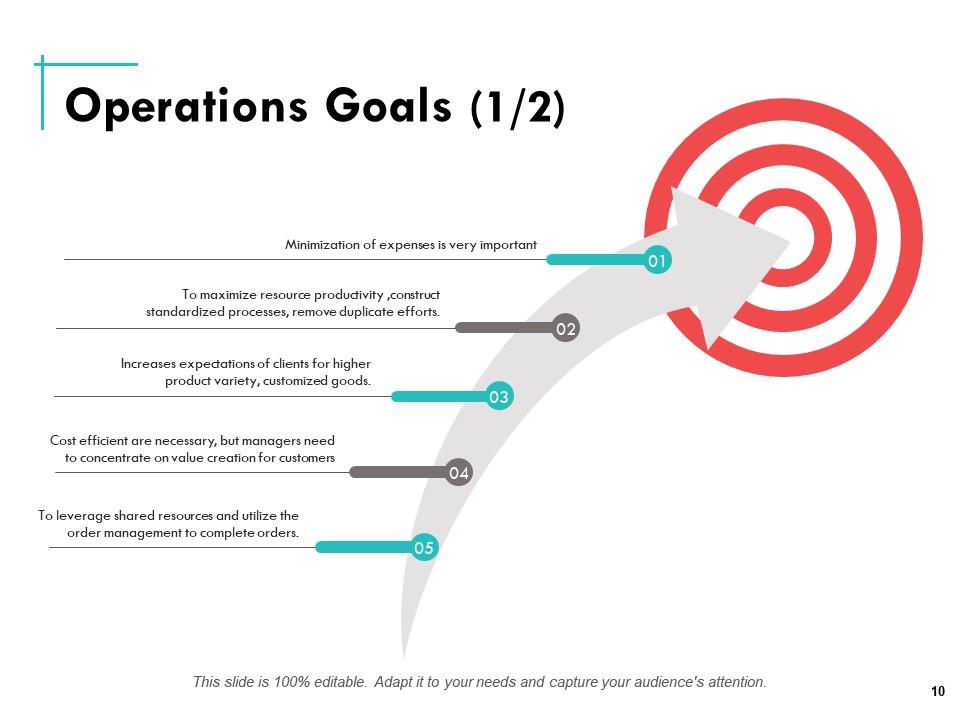
Slide 10: This slide showcases Operations Goals.
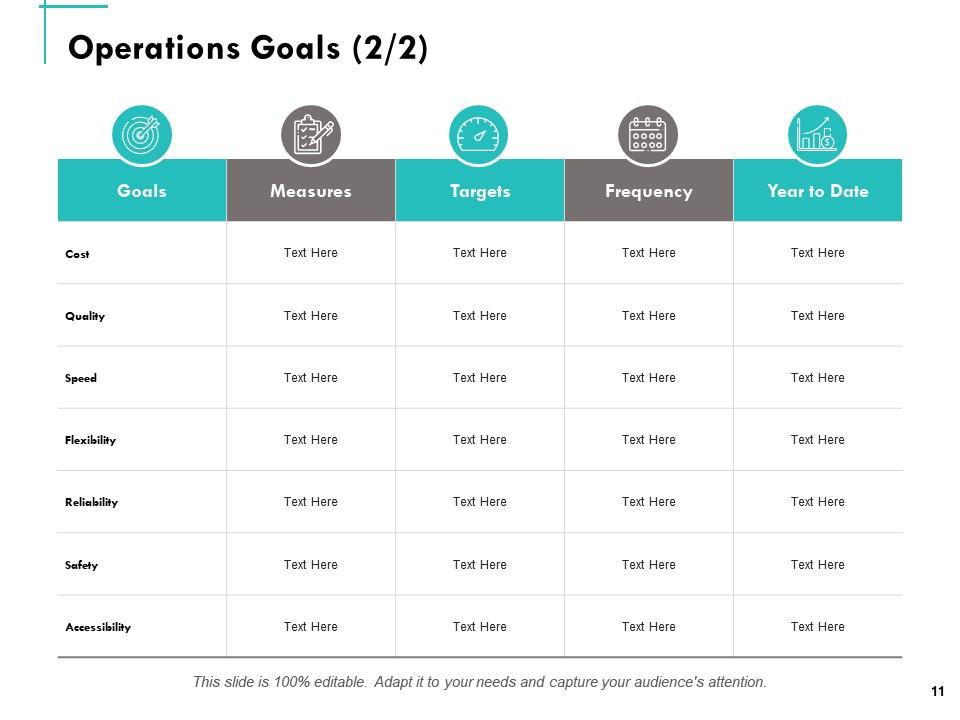
Slide 11: This is another slide showcasing Operations Goals.
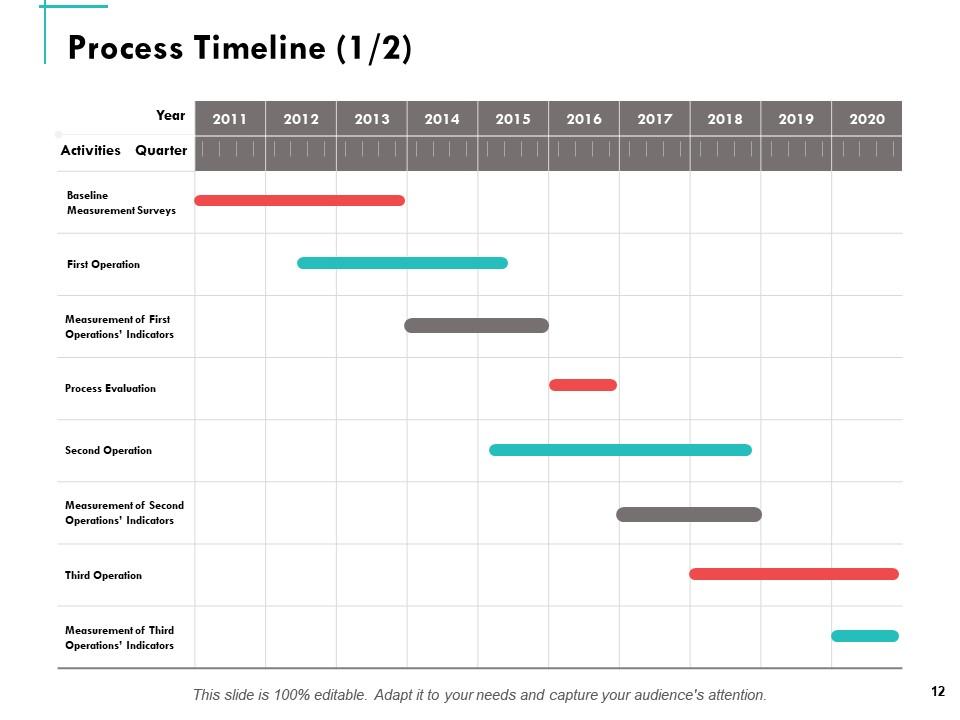
Slide 12: This is Process Timeline slide.
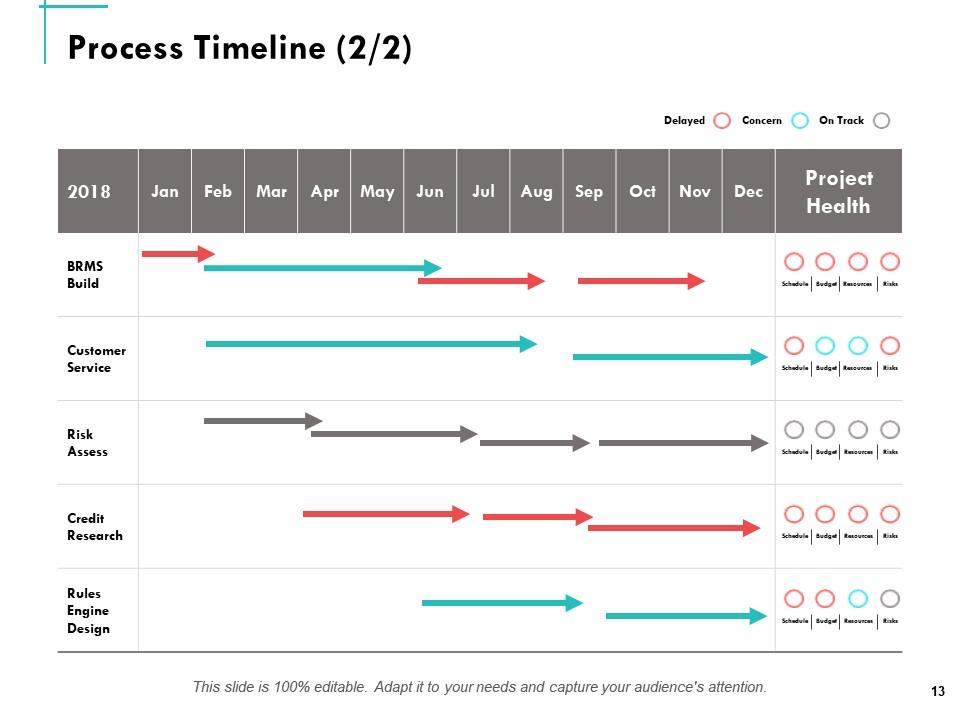
Slide 13: This slide displays Process Timeline.
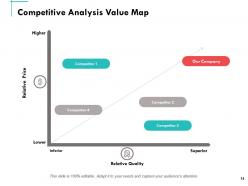
Slide 14: This slide showcases Competitive Analysis Value Map.
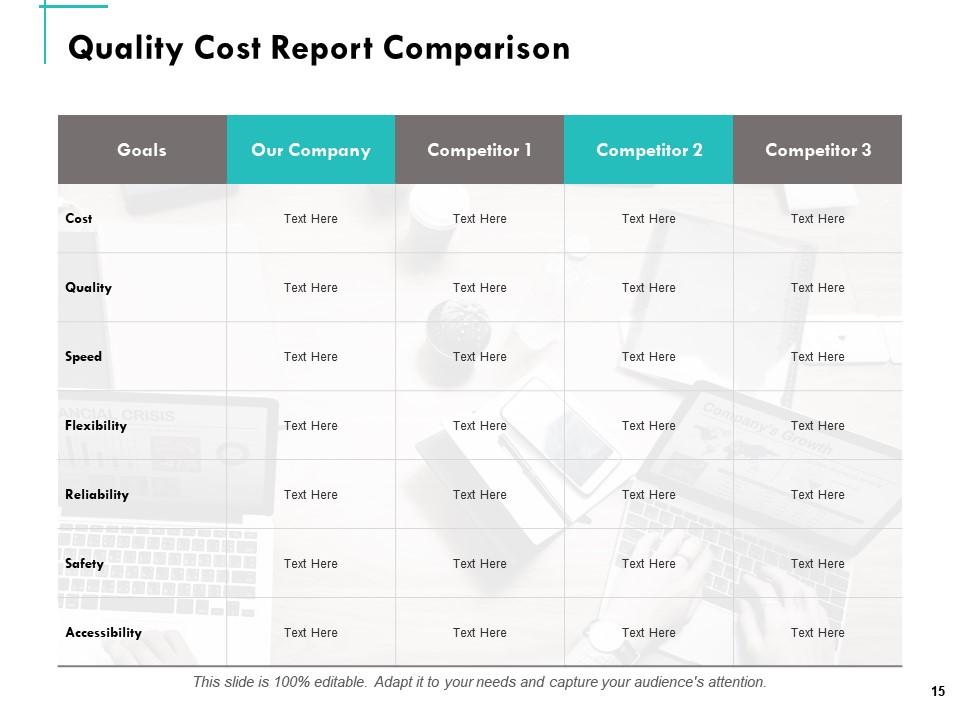
Slide 15: This slide depicts Quality Cost Report Comparison.
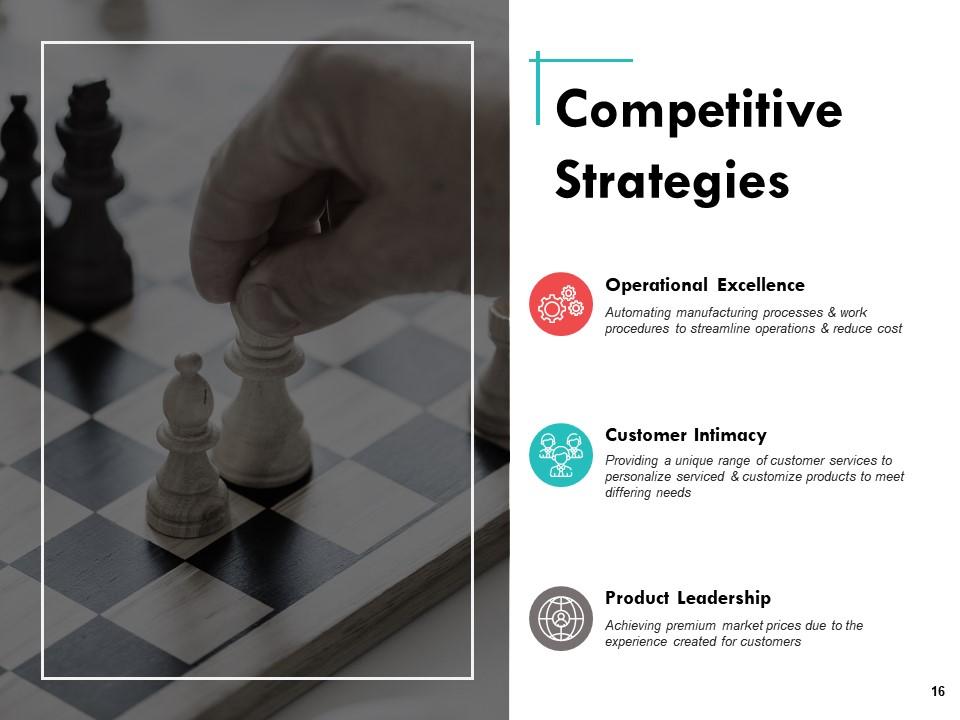
Slide 16: This slide depicts Competitive Strategies.
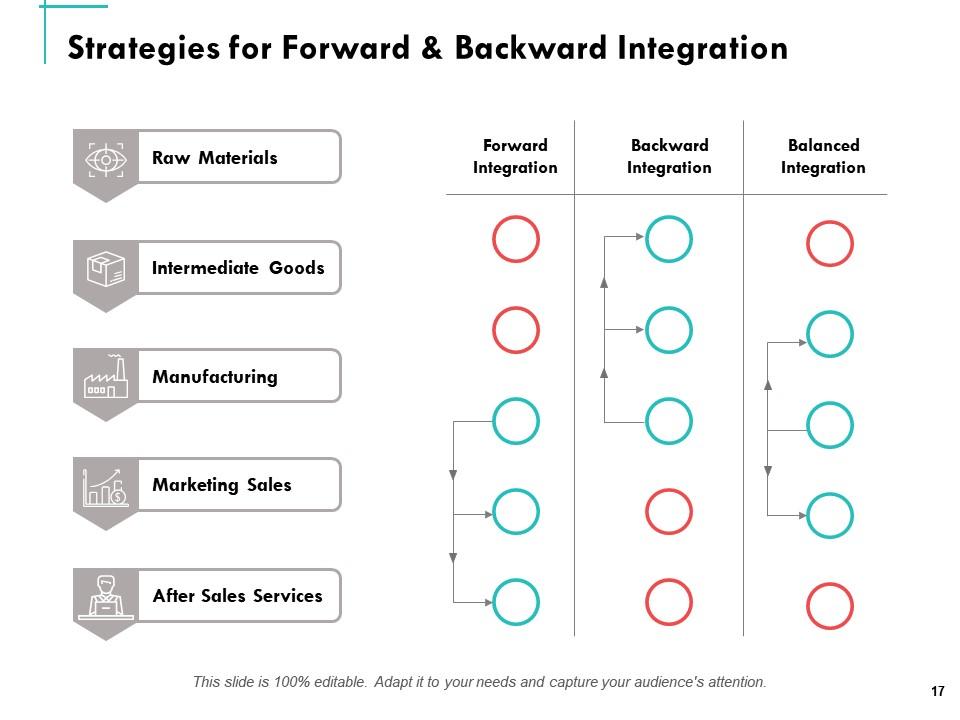
Slide 17: This slide showcases Strategies for Forward & Backward Integration.
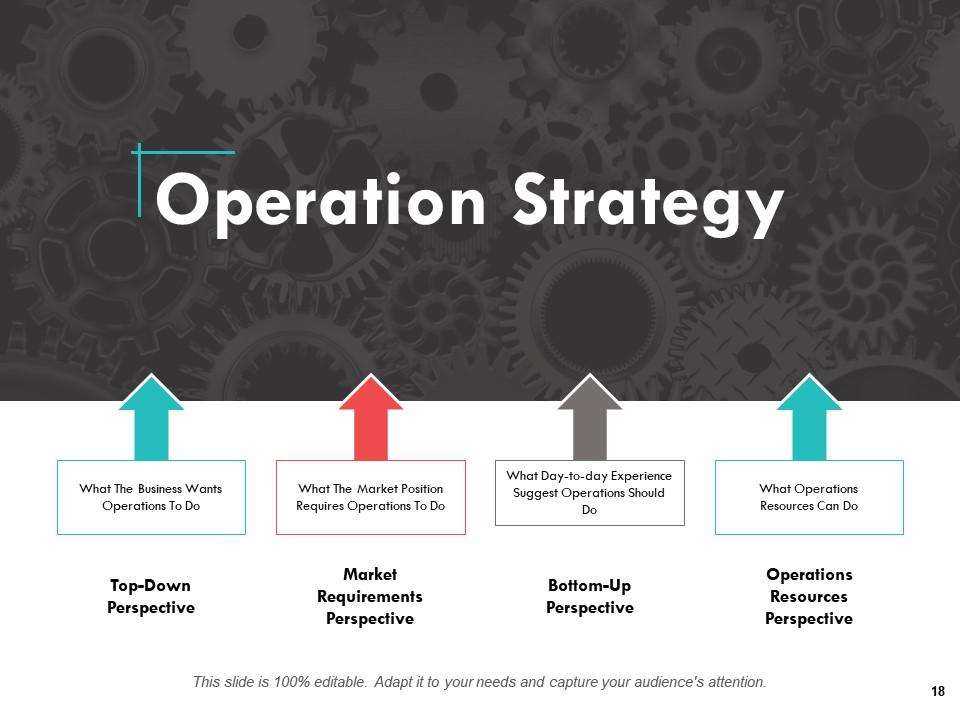
Slide 18: This slide describes the Operation Strategy containing- What The Market Position Requires Operations To Do, Market Requirements Perspective, etc.
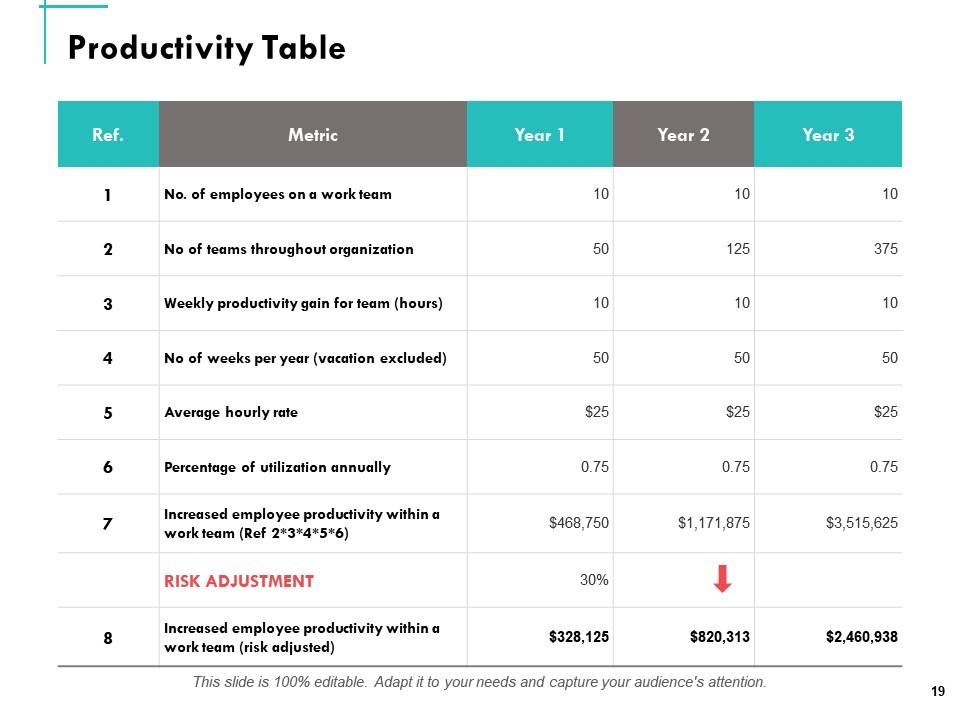
Slide 19: This slide represents Productivity Table.
Slide 20: This slide showcases Forecasting Table.
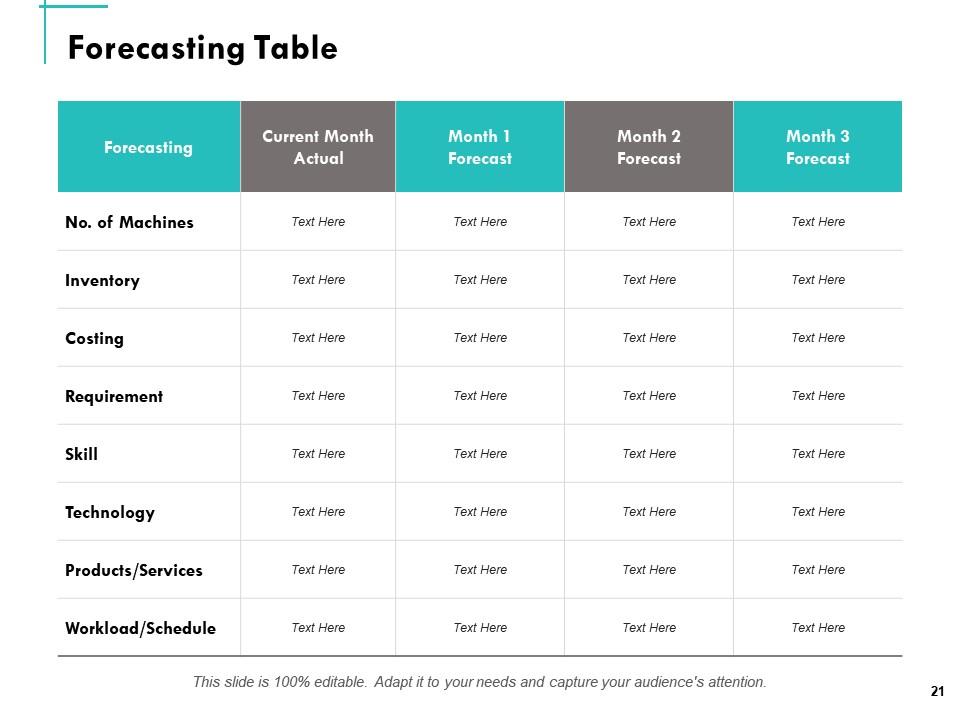
Slide 21: This slide also presents Forecasting Table.
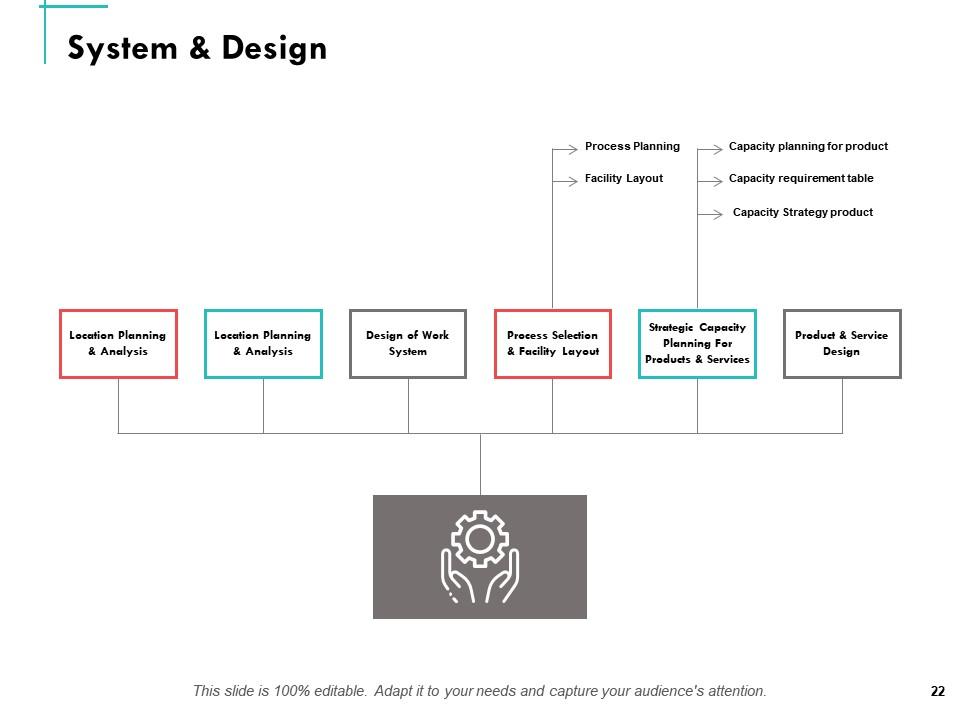
Slide 22: This slide depicts System & Design with- Capacity Strategy product, Capacity requirement table, Capacity planning for product, Facility Layout, Process Planning, Location Planning & Analysis, Location Planning & Analysis, Design of Work System, etc.
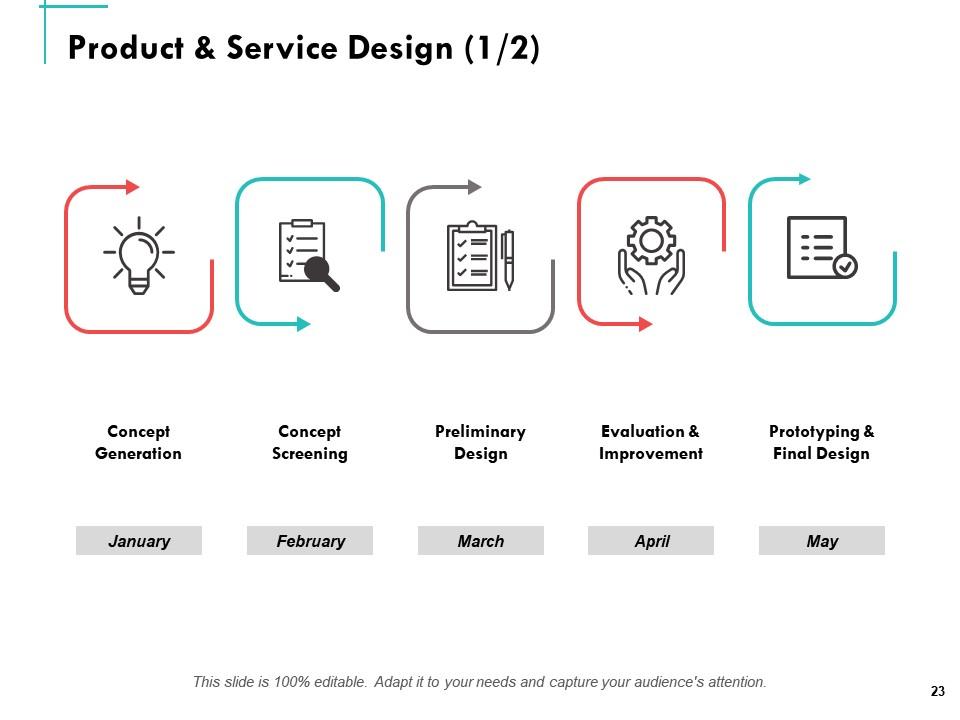
Slide 23: This slide displays Product & Service Design.
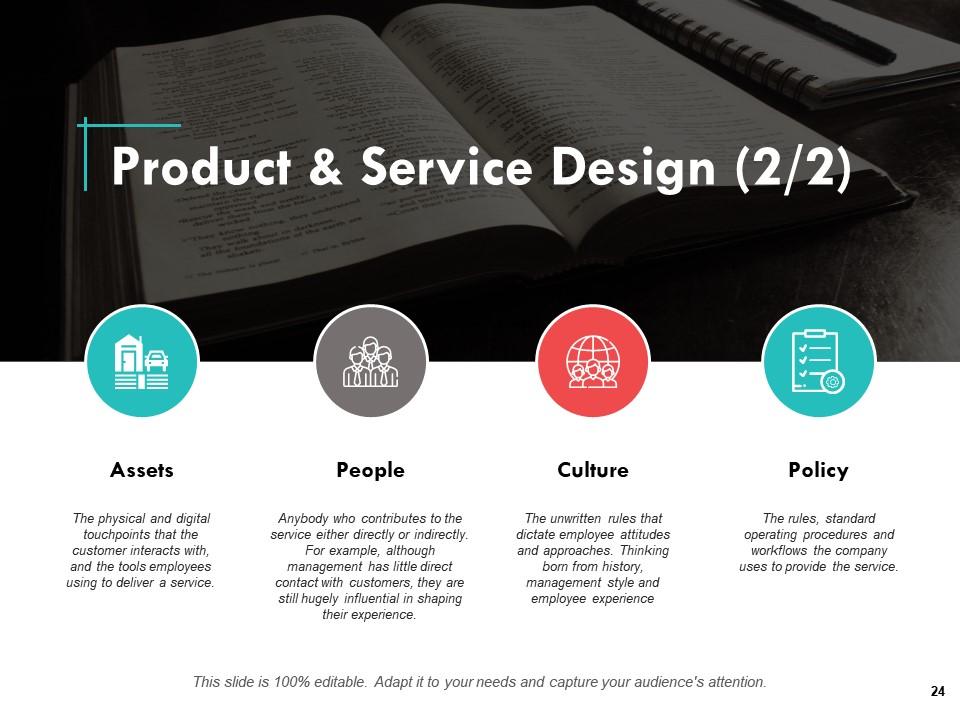
Slide 24: This slide depicts Product & Service Design containing- people, culture, policy and assets.
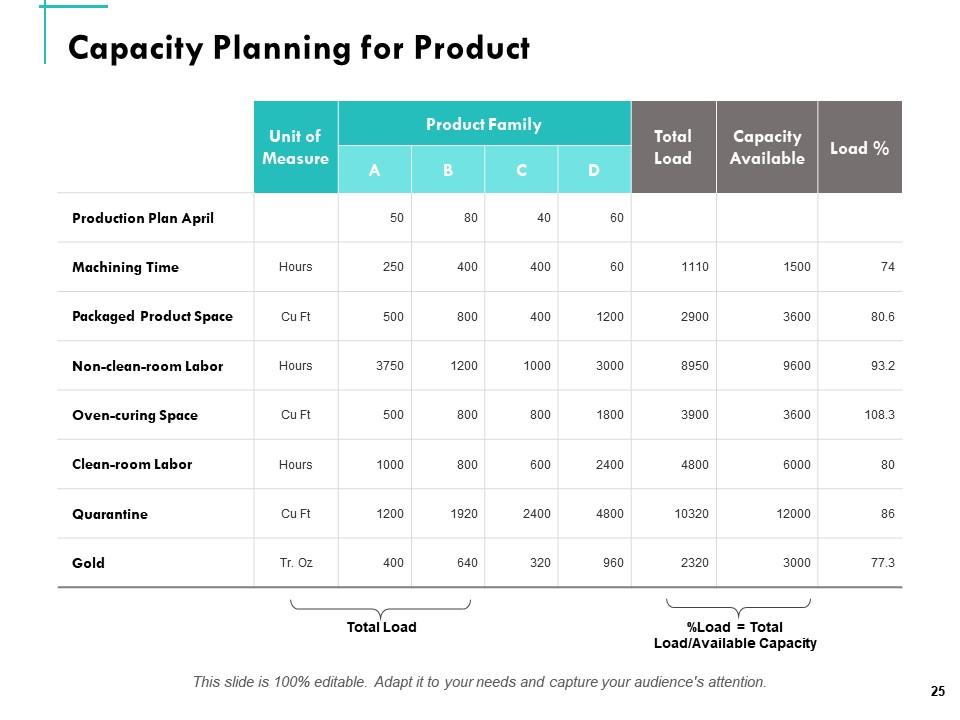
Slide 25: This slide showcases Capacity Planning for Product.
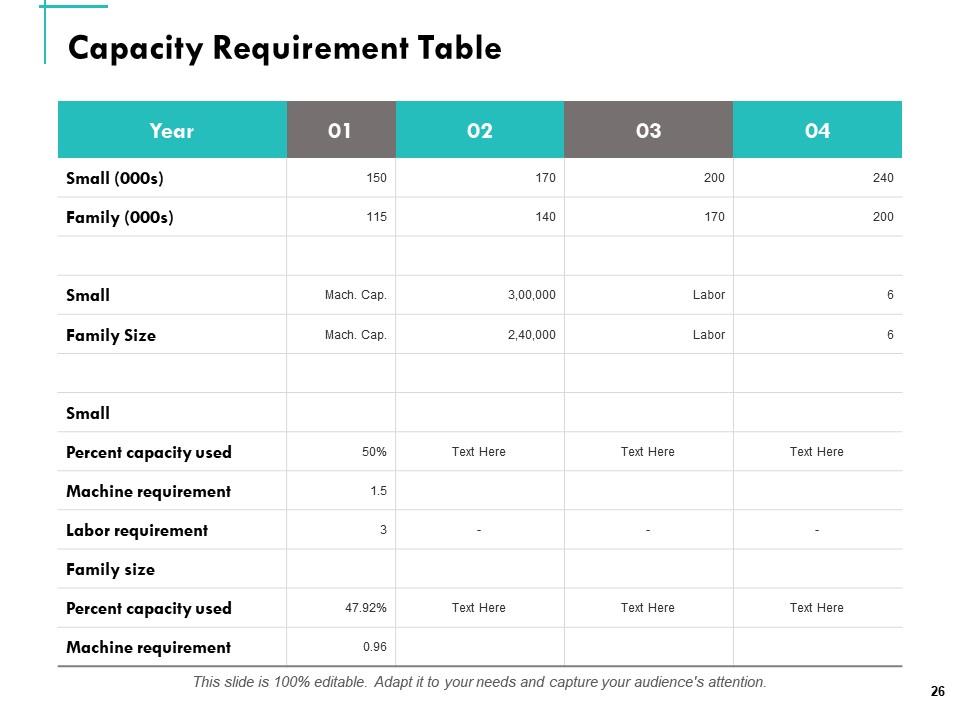
Slide 26: This slide showcases Capacity Requirement Table.
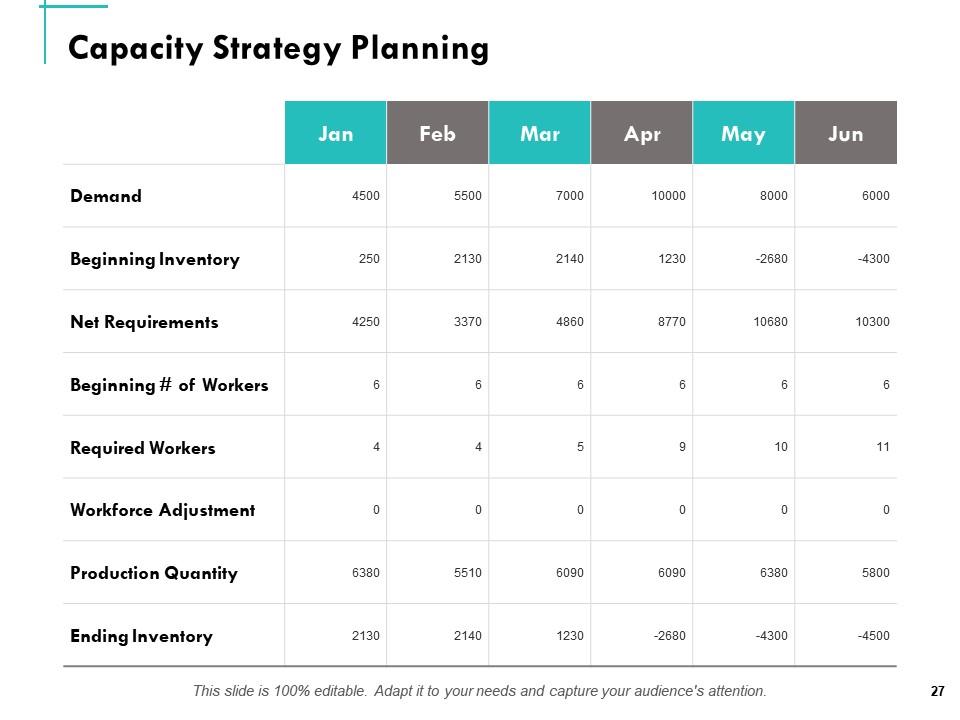
Slide 27: This slide displays Capacity Strategy Planning.
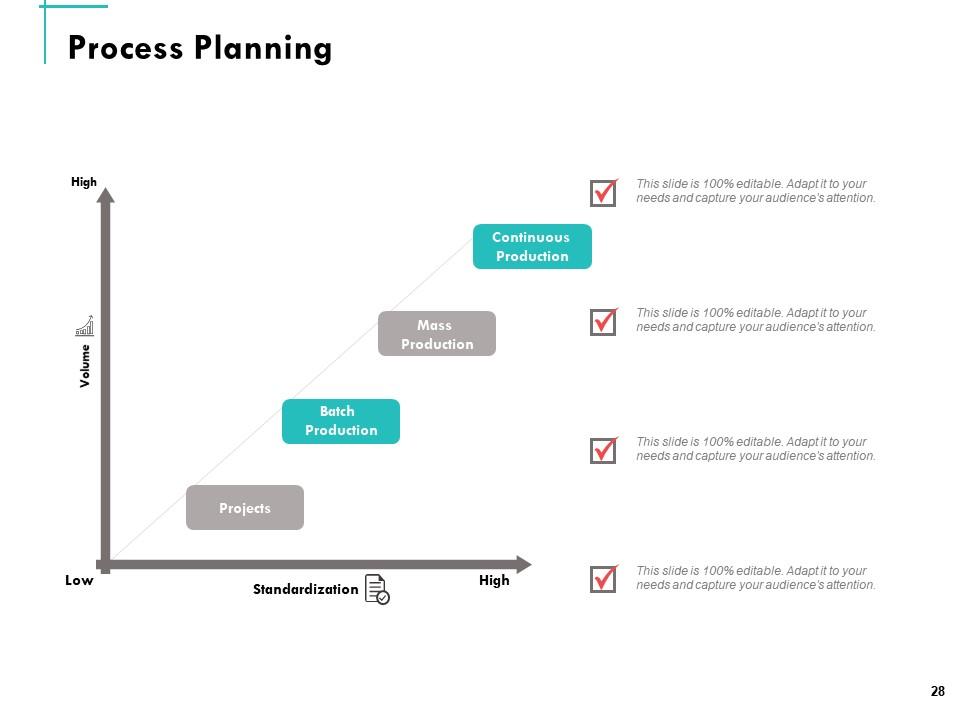
Slide 28: This slide showcases Process Planning with Projects, Batch production, Mass production, Continuous Production.
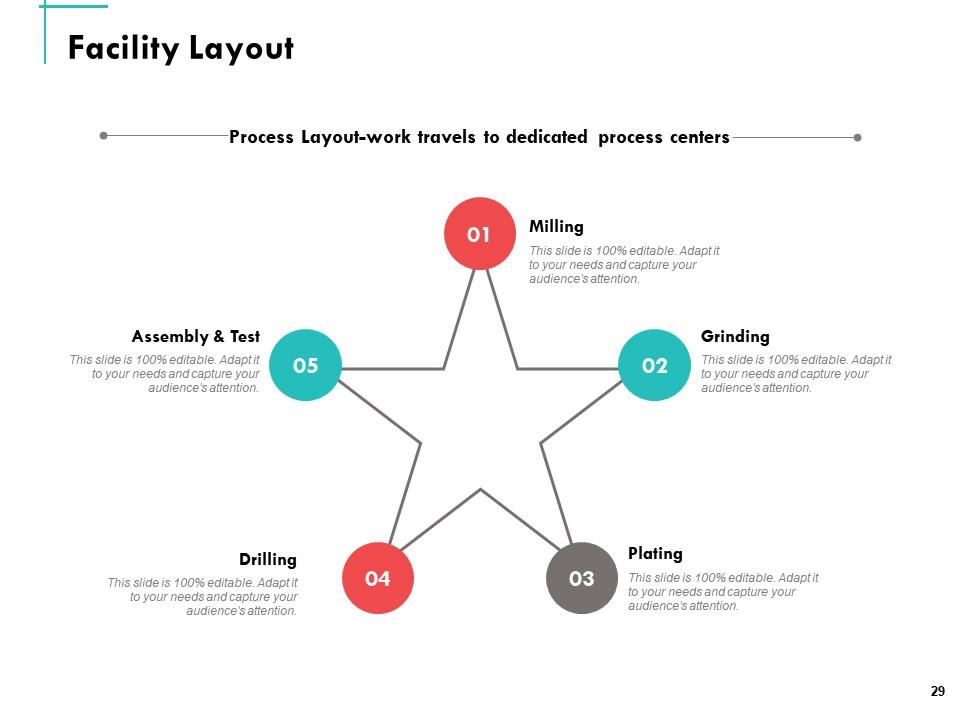
Slide 29: This slide depicts Facility Layout displaying- Milling, Plating, Drilling, Grinding, Assembly & Test.
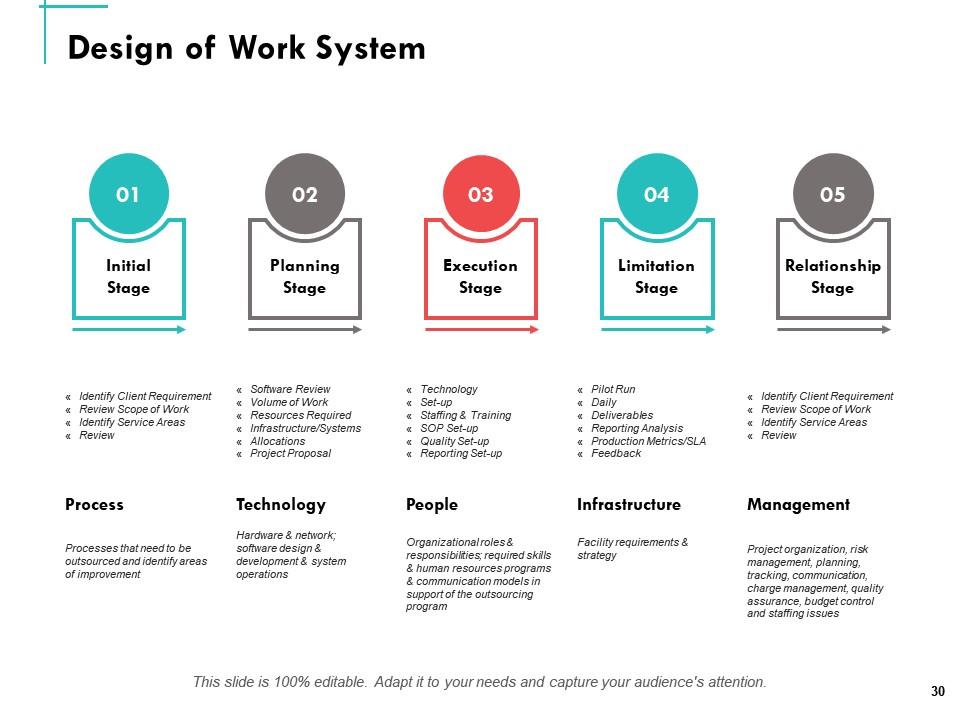
Slide 30: This slide showcases Design of Work System.
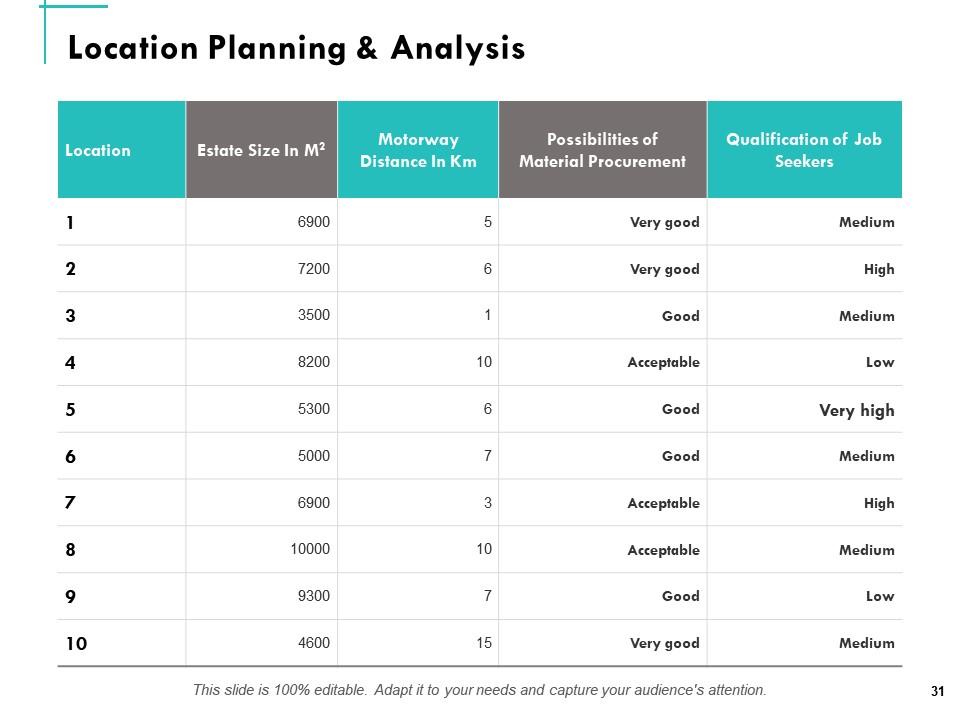
Slide 31: This slide displays Location Planning & Analysis.
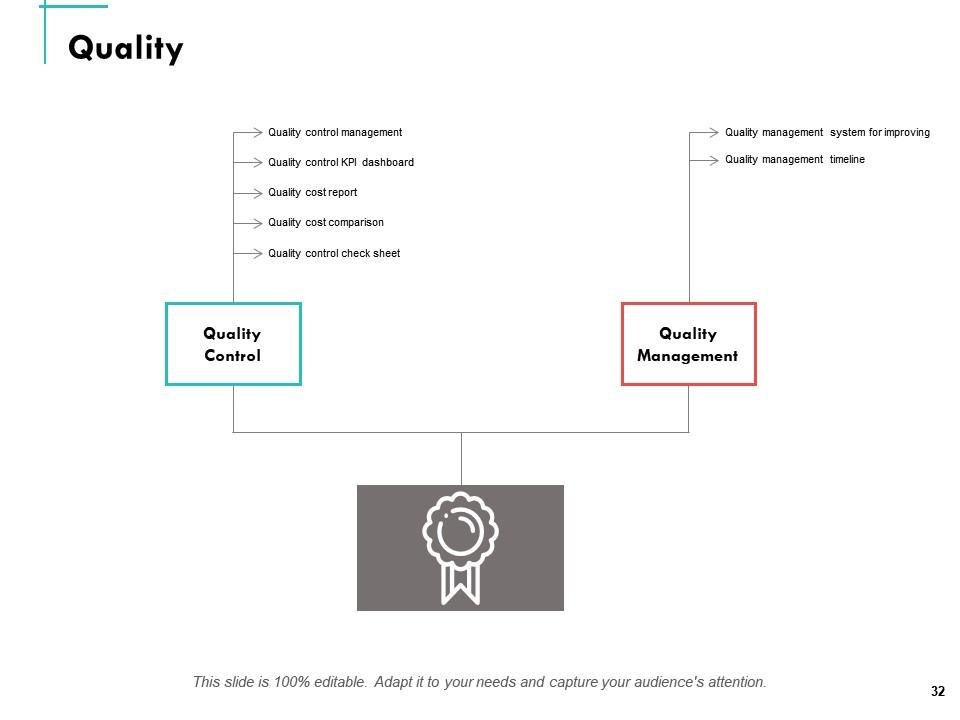
Slide 32: This slide displays Quality containing- Quality management timeline, Quality management system for improving, Quality control management, Quality control KPI dashboard, Quality cost report, Quality cost comparison, Quality control check sheet, Quality Control Quality Management.
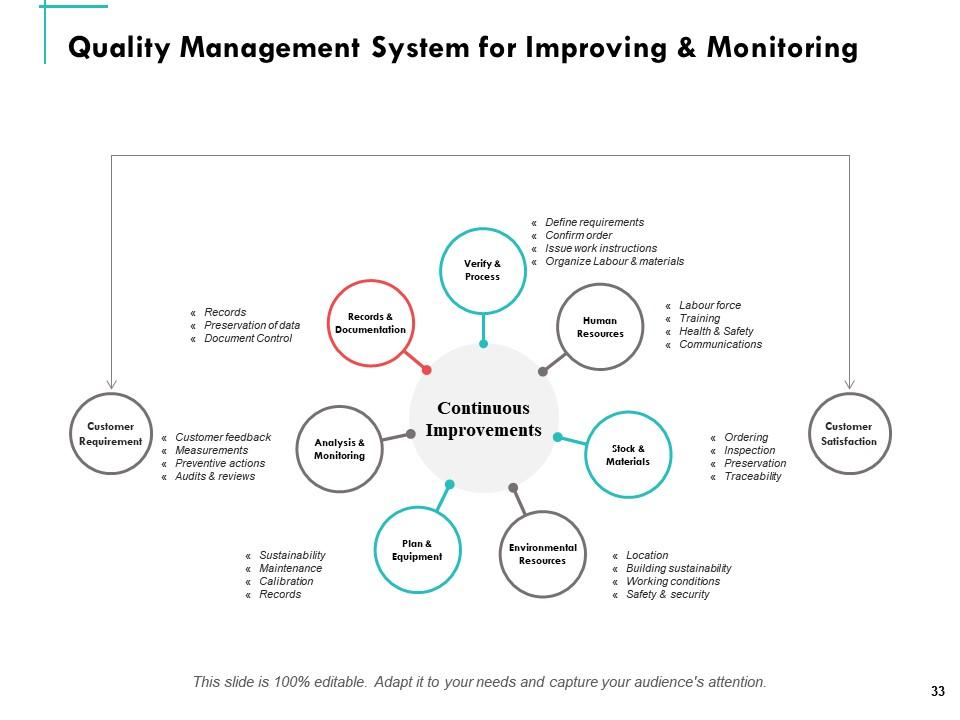
Slide 33: This slide showcases Quality Management System for Improving & Monitoring.
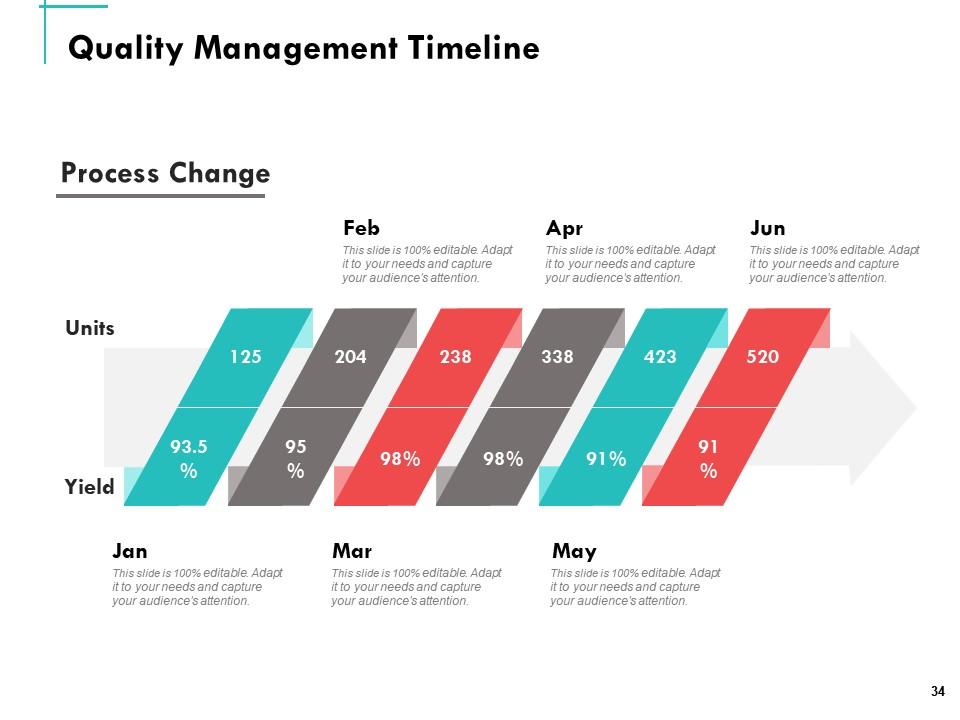
Slide 34: This slide displays the Quality Management Timeline.
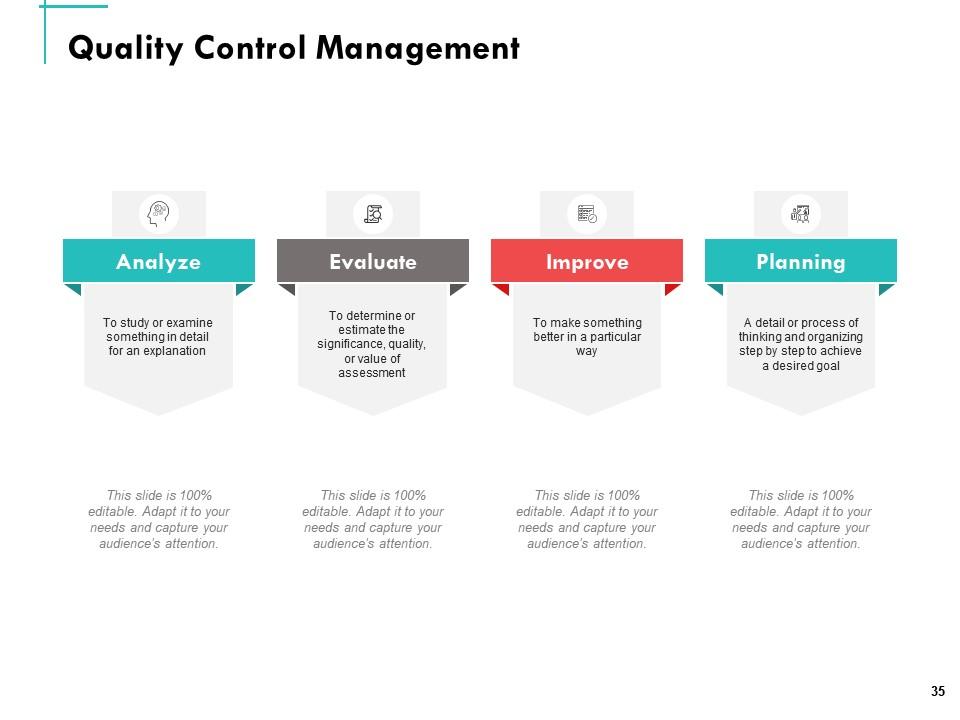
Slide 35: This slide describes Quality Control Management. Analyze, Evaluate, Improve, Planning.
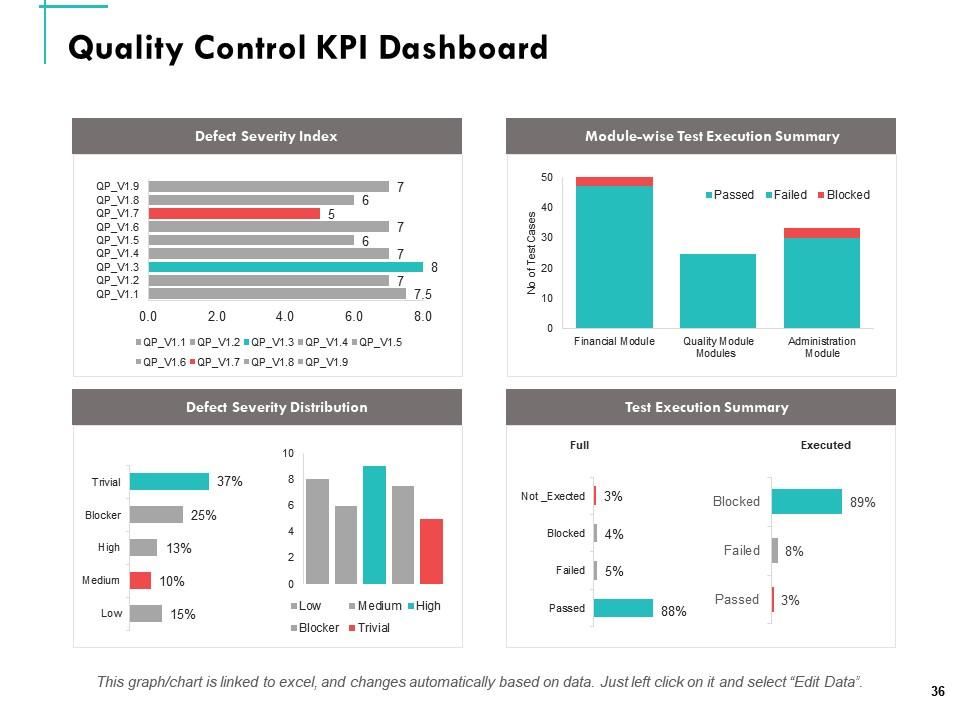
Slide 36: This slide depicts Quality Control KPI Dashboard.
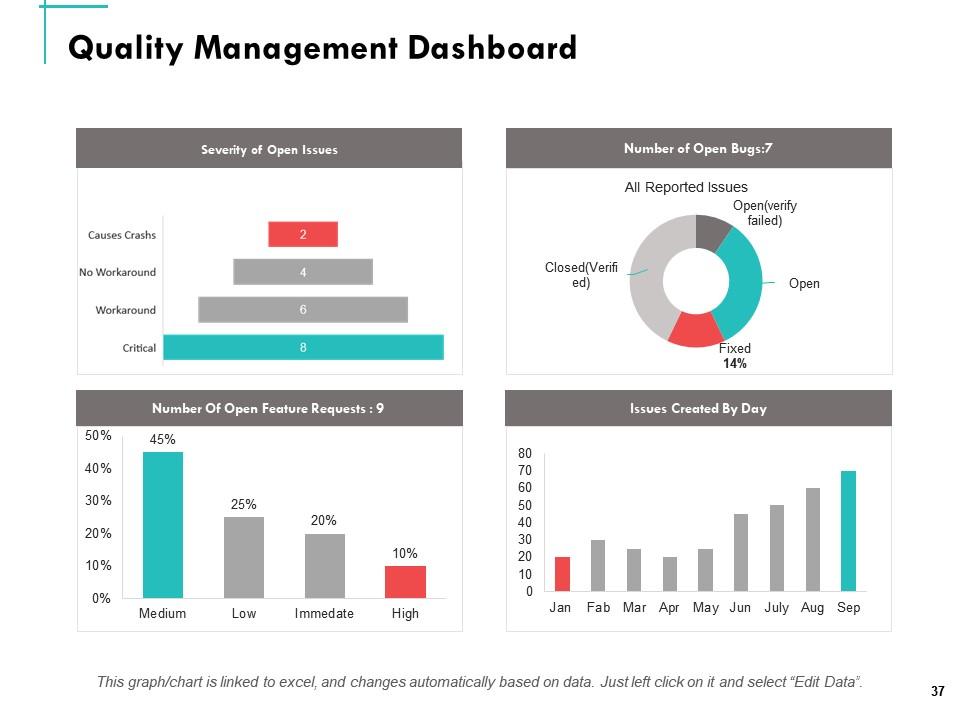
Slide 37: This slide showcases Quality Management Dashboard.
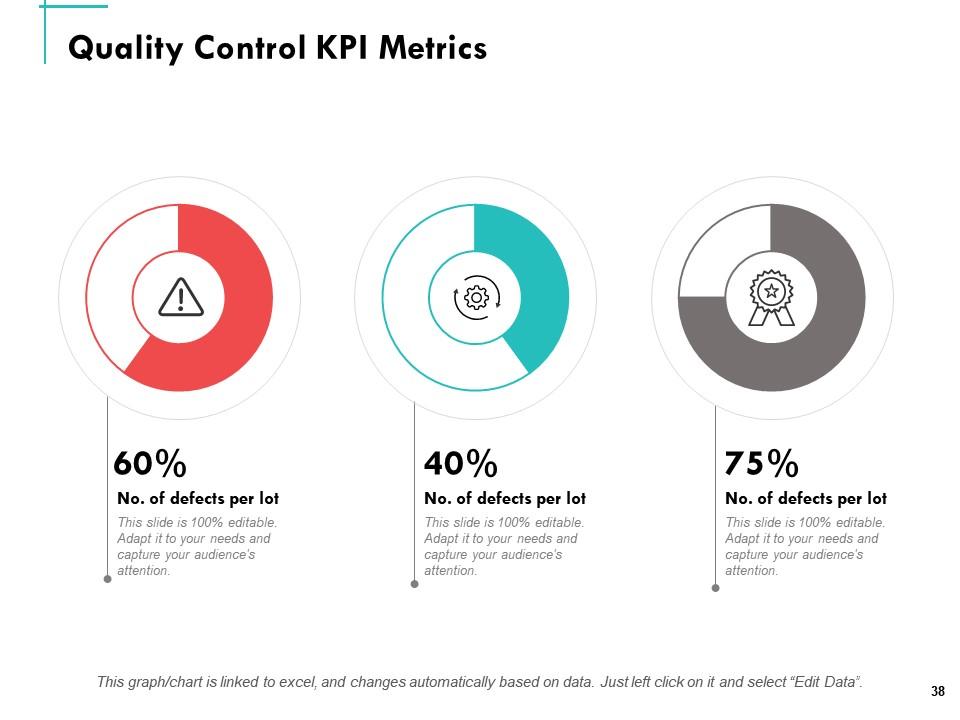
Slide 38: This slide showcases Quality Control KPI Metrics.
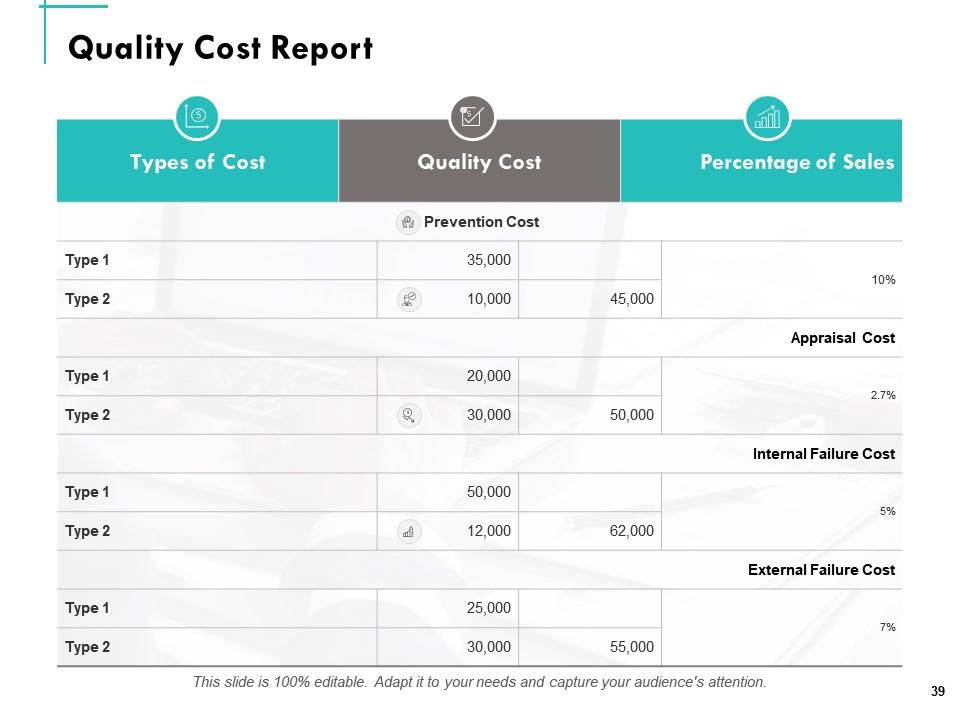
Slide 39: This slide displays the Quality Cost Report.
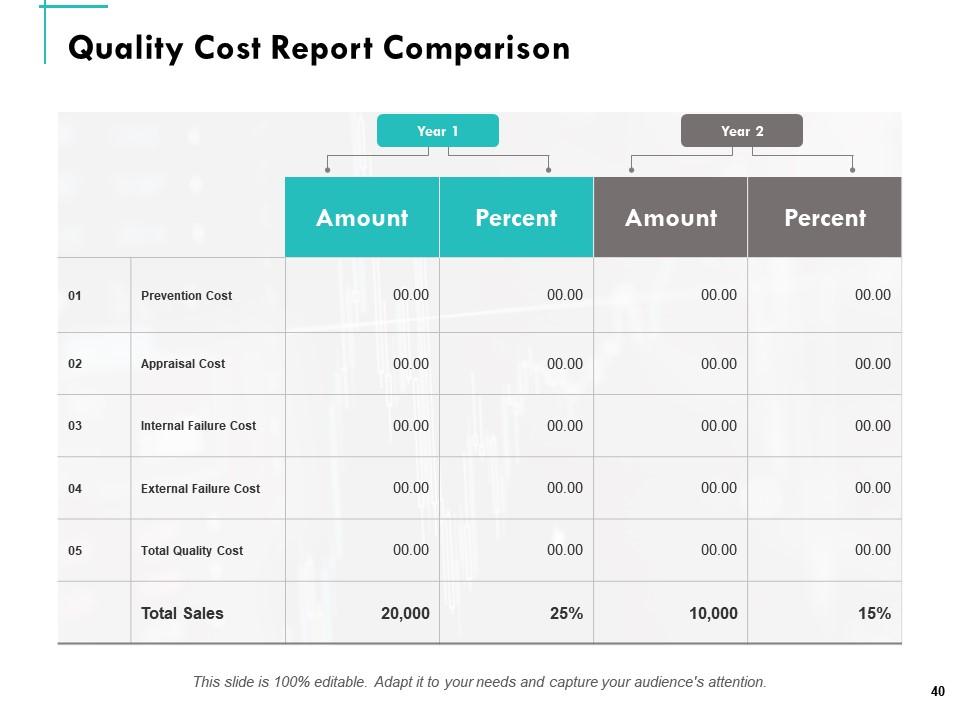
Slide 40: This slide depicts Quality Cost Report Comparison.
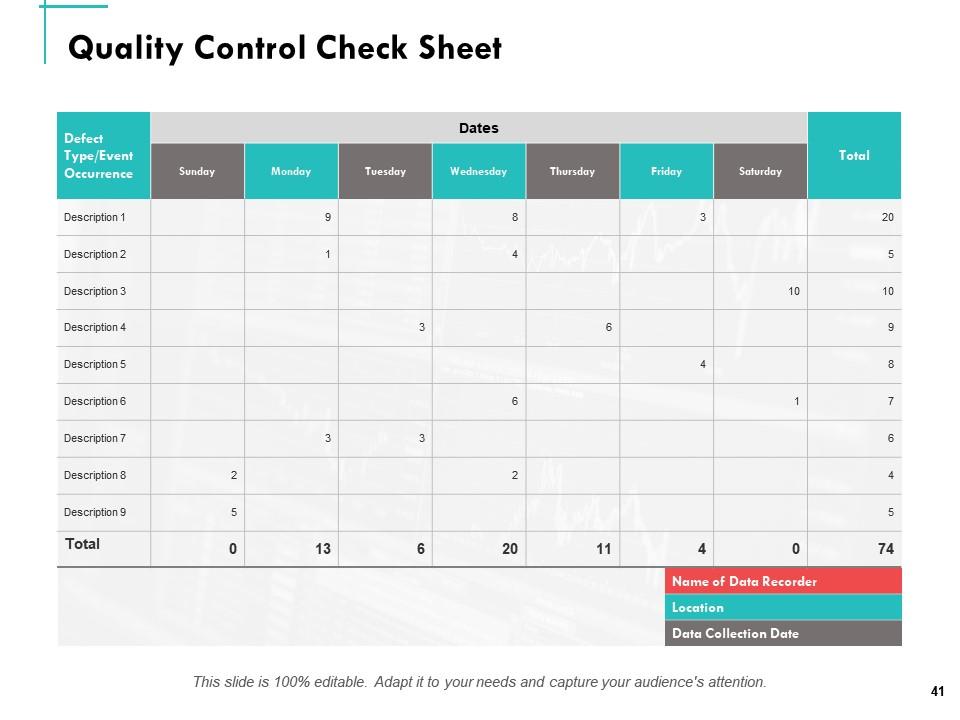
Slide 41: This slide represents Quality Control Check Sheet.
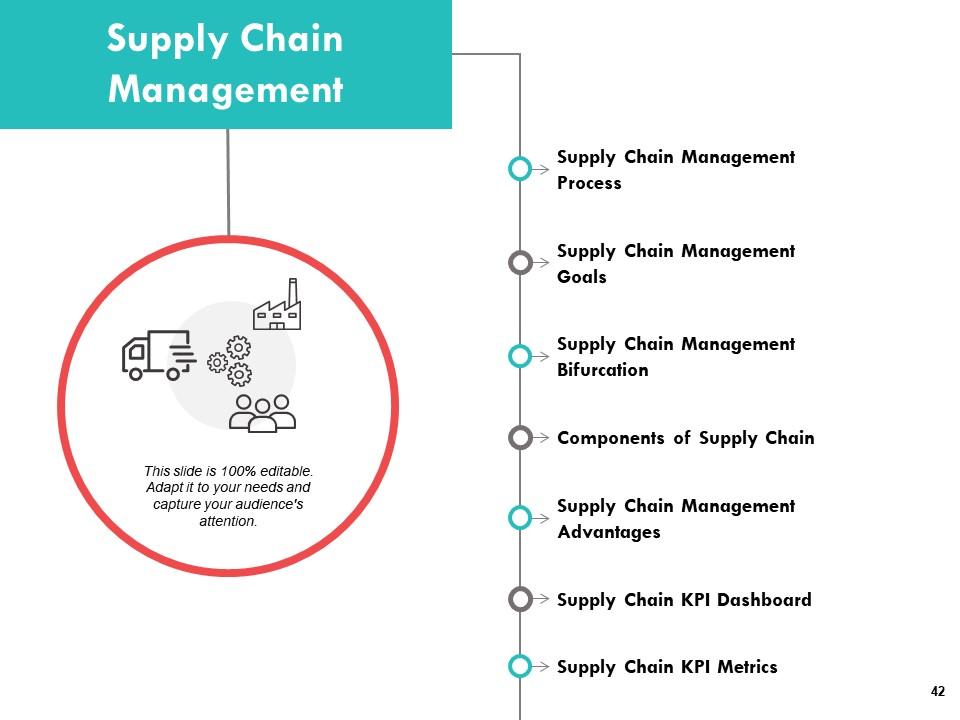
Slide 42: This slide showcases Supply Chain Management containing- Supply Chain Management Process, Supply Chain Management Goals, Supply Chain Management Bifurcation, Components of Supply Chain, Supply Chain Management Advantages, Supply Chain KPI Dashboard, Supply Chain KPI Metrics.
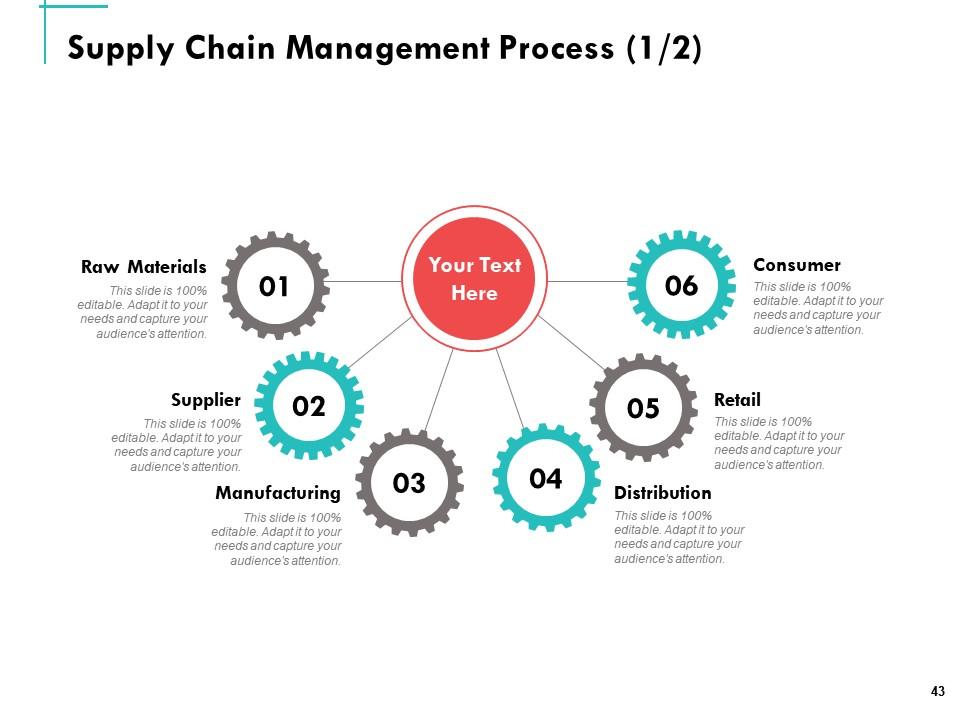
Slide 43: This slide showcases Supply Chain Management Process displaying- Raw Materials, Supplier, Manufacturing, Distribution, Retail.
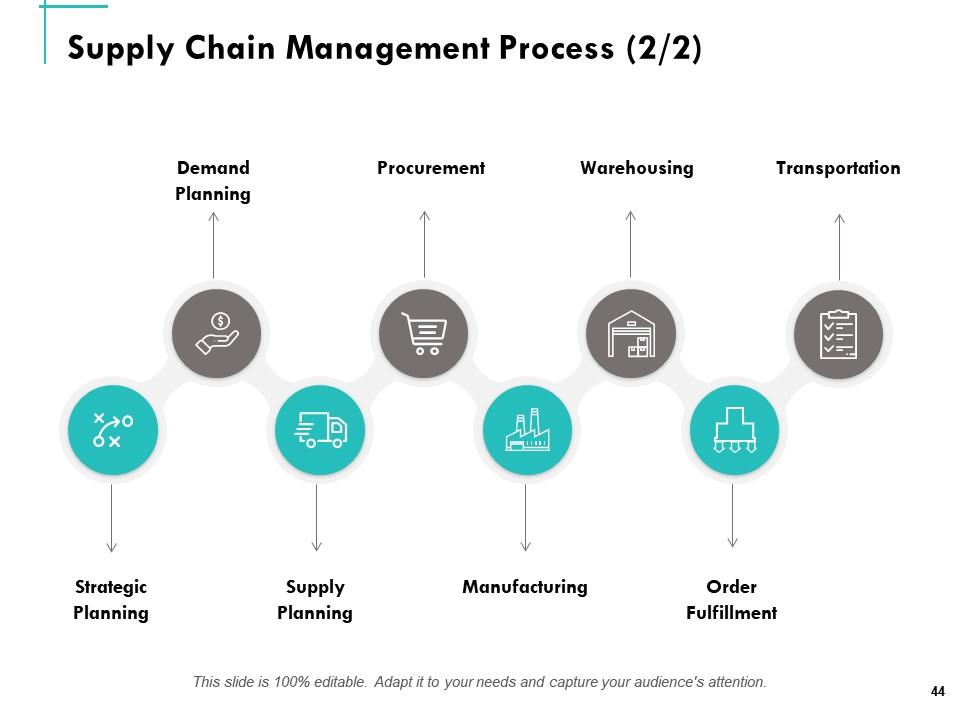
Slide 44: This slide showcases Supply Chain Management Process with- Strategic Planning, Demand Planning, Supply Planning, Procurement, Manufacturing, Warehousing, Order Fulfillment, Transportation.
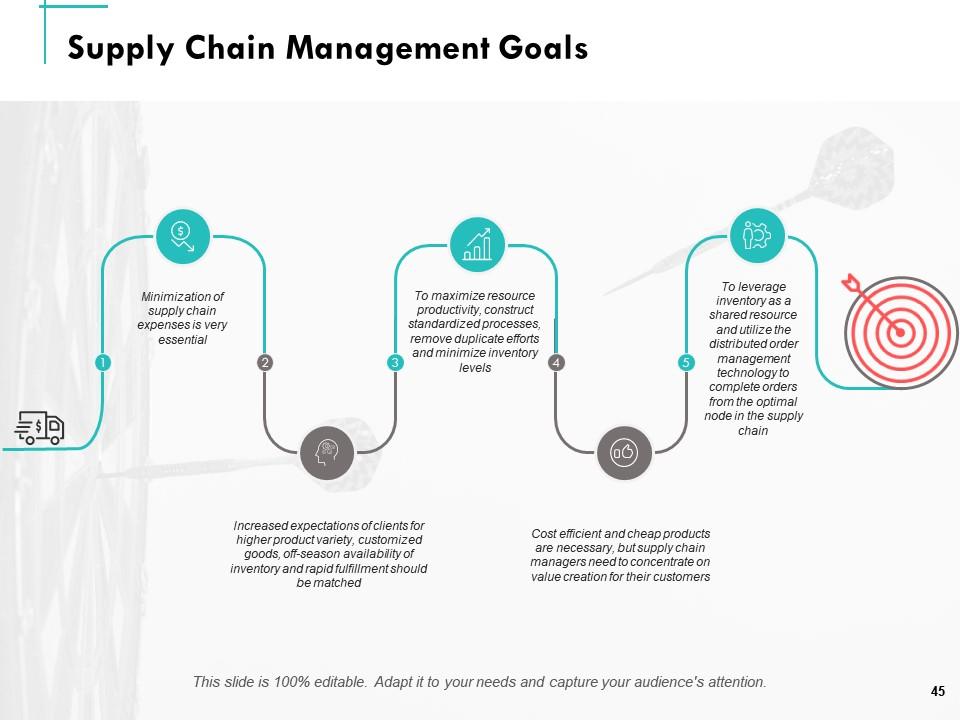
Slide 45: This slide showcases Supply Chain Management Goals.
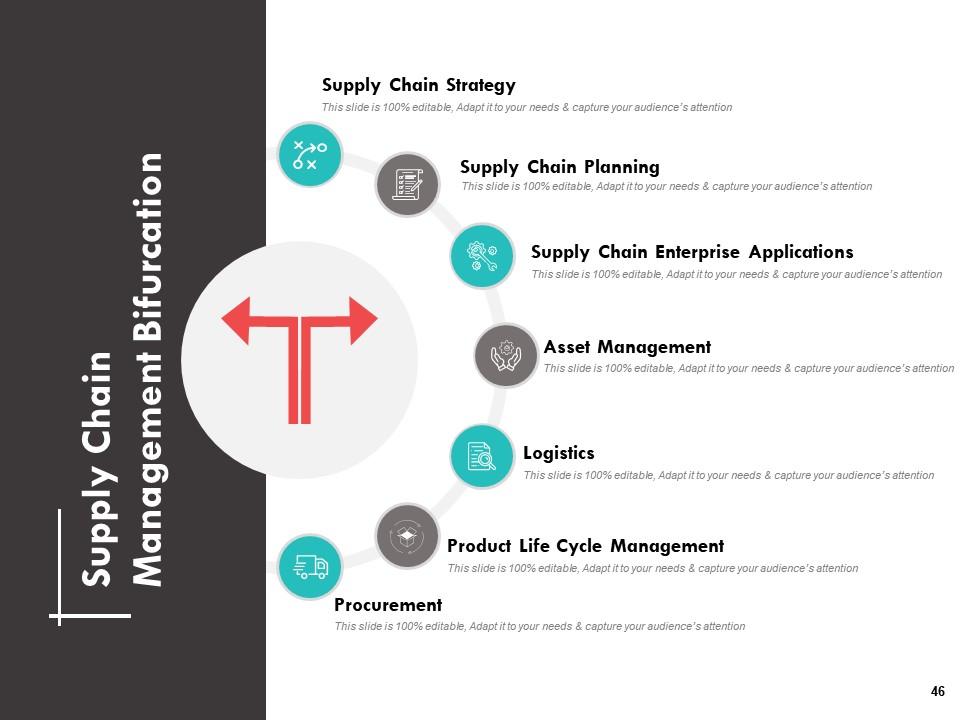
Slide 46: This slide depicts Supply Chain Management Bifurcation displaying- Supply Chain Strategy, Supply Chain Planning, Supply Chain Enterprise Applications, Asset Management, Logistics, Product Life Cycle Management, Procurement.
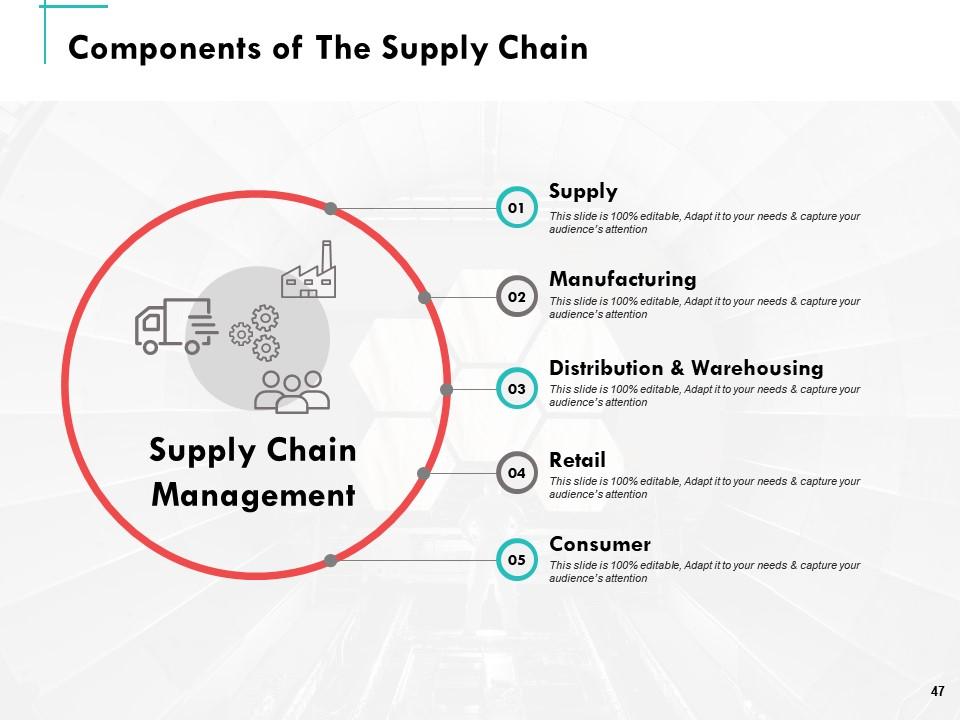
Slide 47: This slide showcases Components of The Supply Chain.
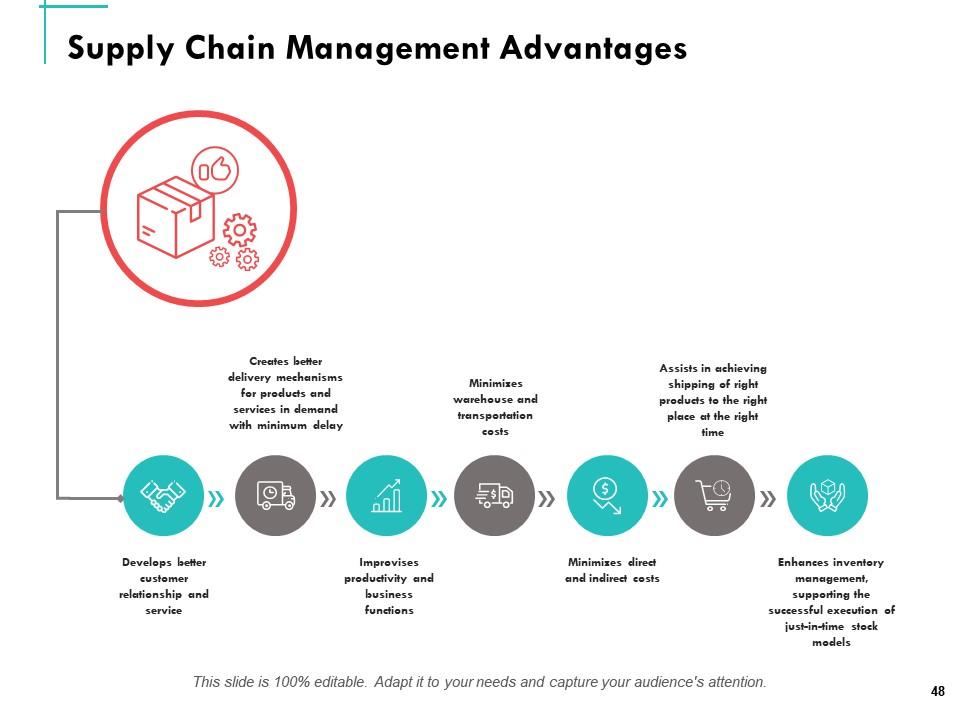
Slide 48: This slide depicts Supply Chain Management Advantages.
Slide 49: This slide reminds about Coffee Break.
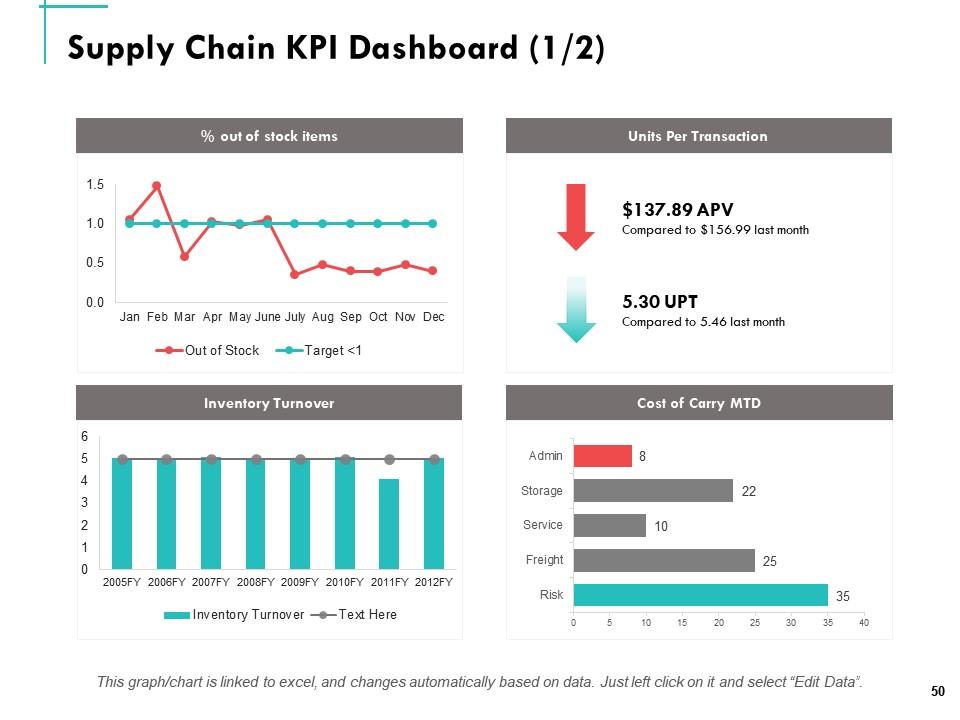
Slide 50: This slide displays Supply Chain KPI Dashboard.
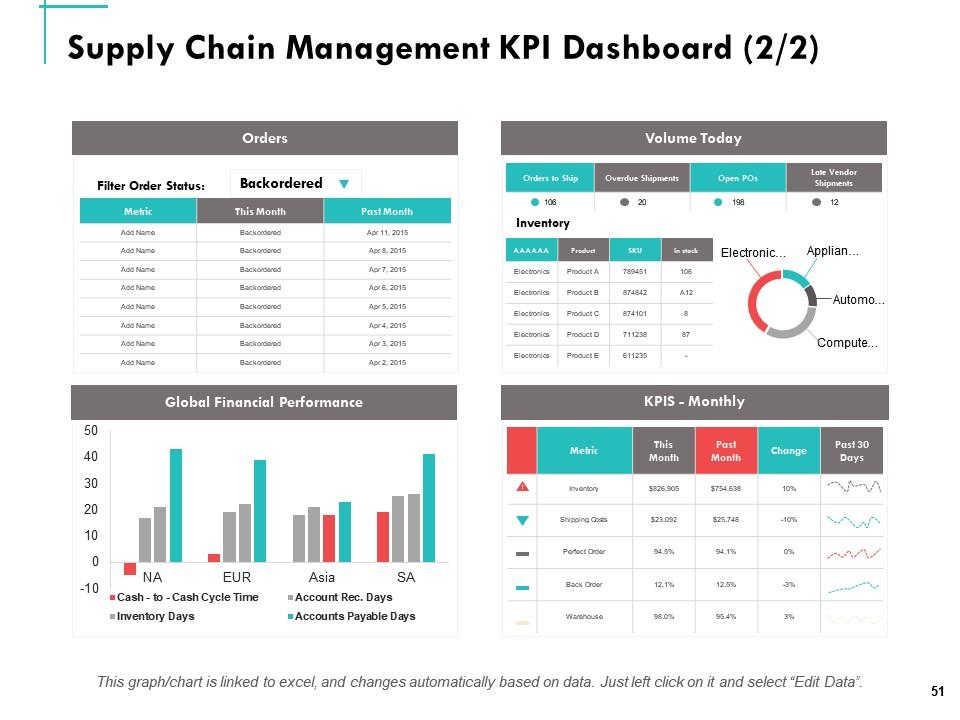
Slide 51: This slide depicts Supply Chain Management KPI Dashboard.
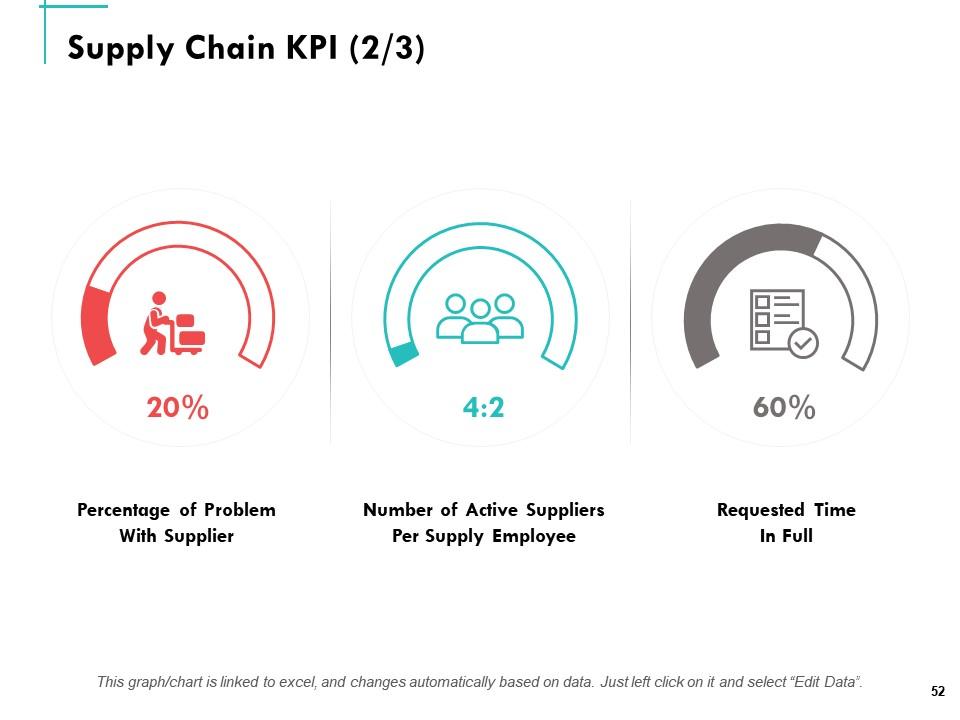
Slide 52: This slide showcases Supply Chain KPI.
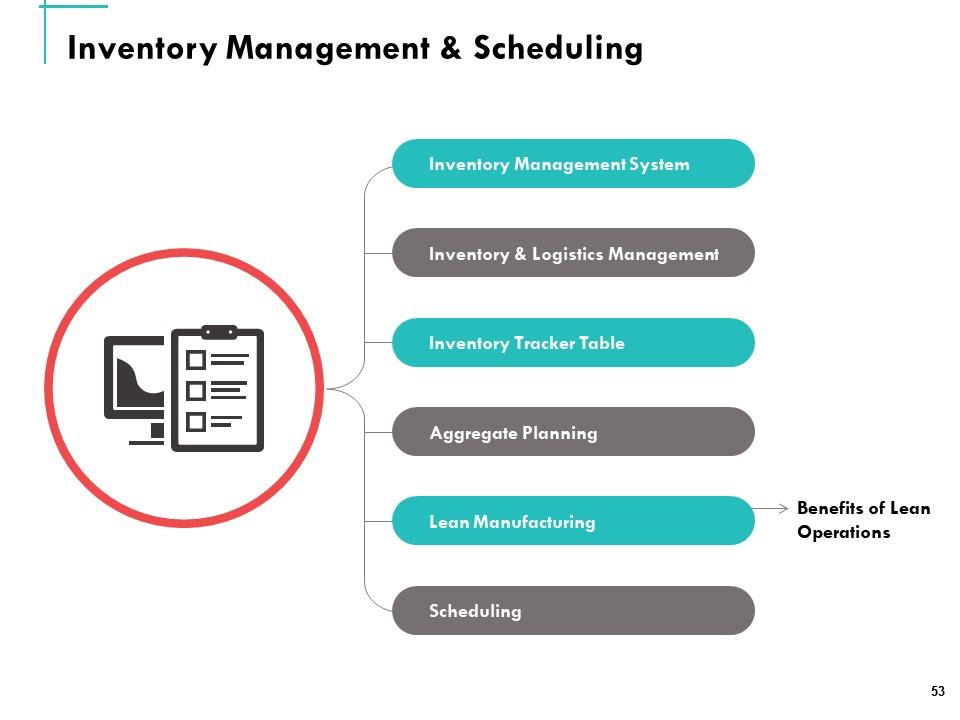
Slide 53: This slide represents Inventory Management & Scheduling.
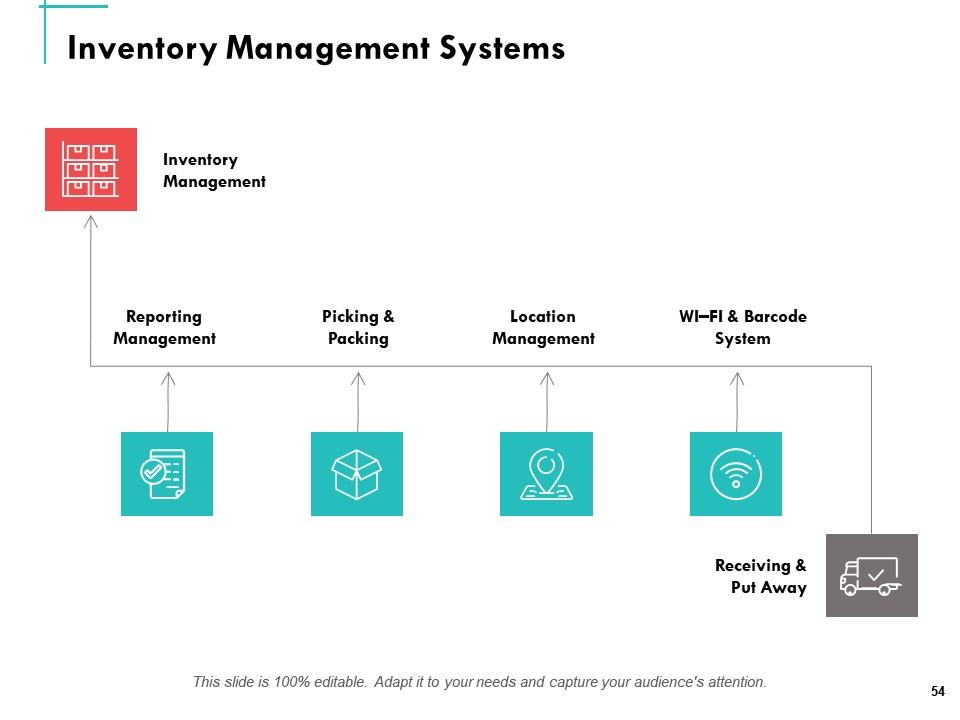
Slide 54: This slide represents Inventory Management Systems with- Receiving & Put Away, WI–FI & Barcode System, Location Management, Picking & Packing, Reporting Management, Inventory Management.
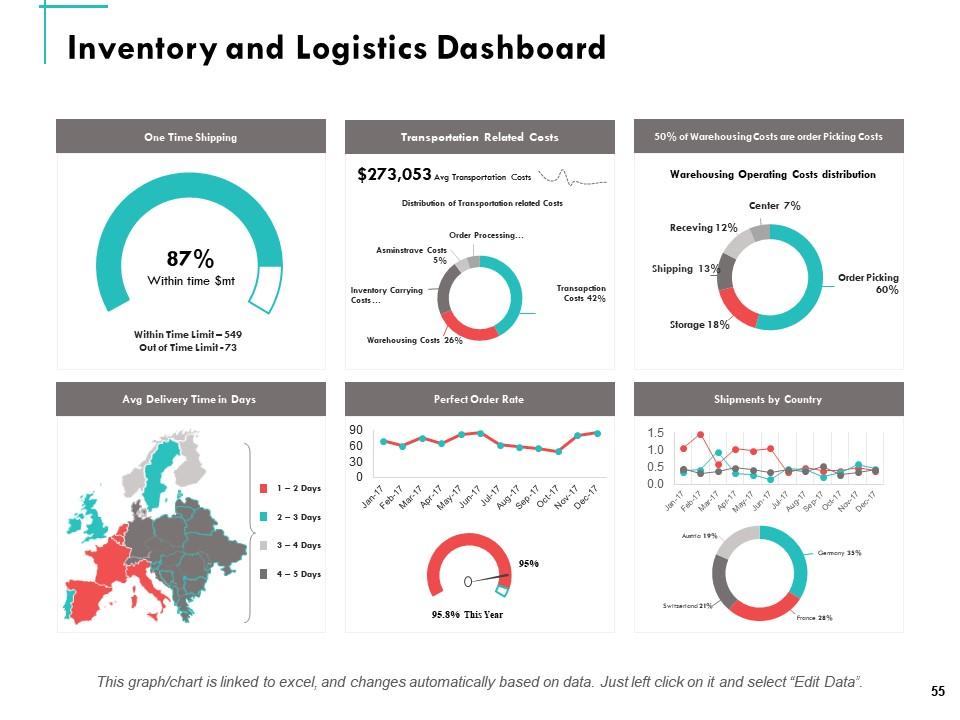
Slide 55: This slide showcases Inventory and Logistics Dashboard.
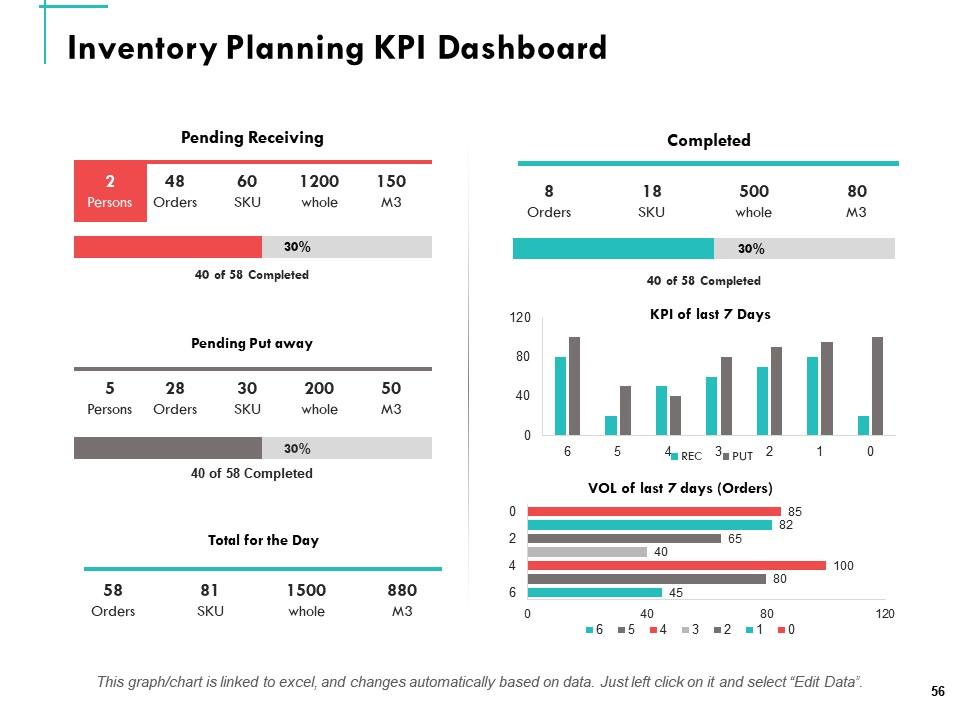
Slide 56: This slide displays the Inventory Planning KPI Dashboard.
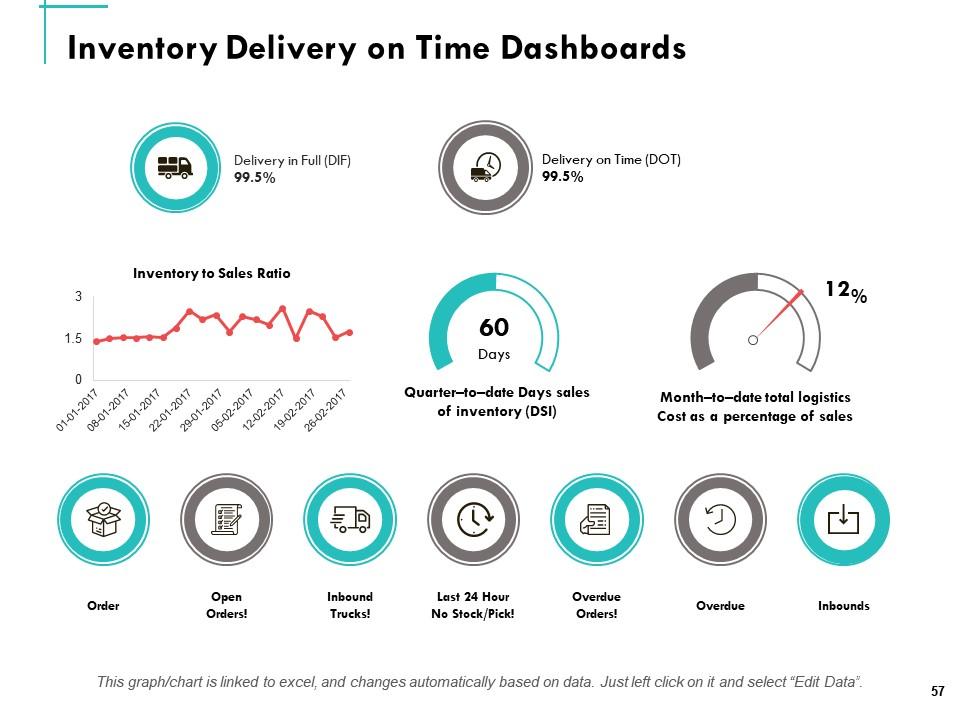
Slide 57: This slide depicts Inventory Delivery on Time Dashboards.
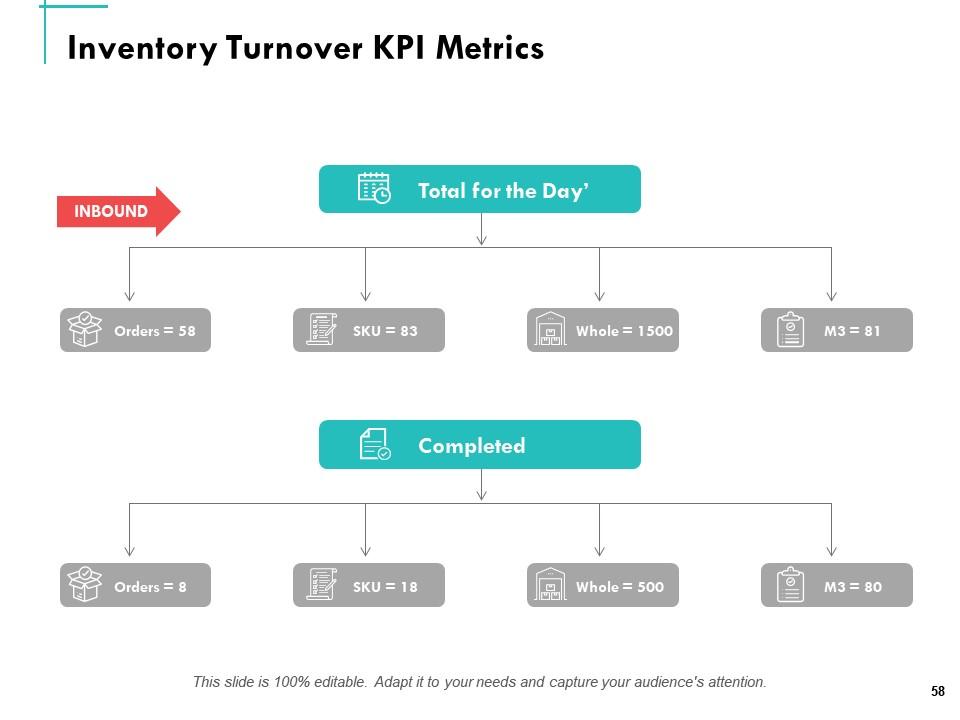
Slide 58: This slide showcases Inventory Turnover KPI Metrics.
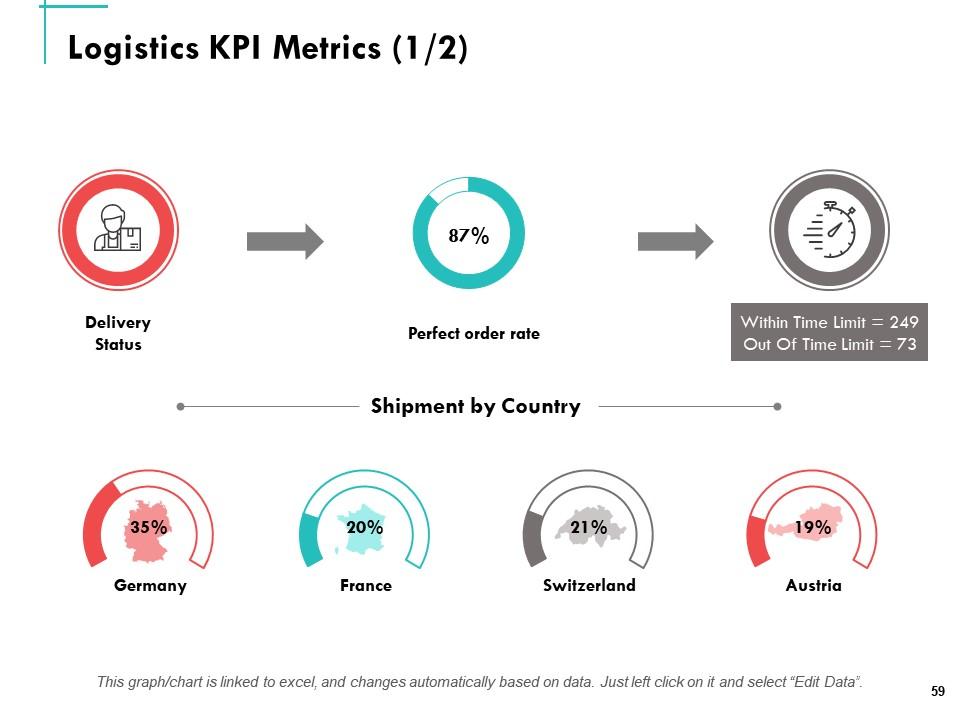
Slide 59: This slide represents Logistics KPI Metrics.
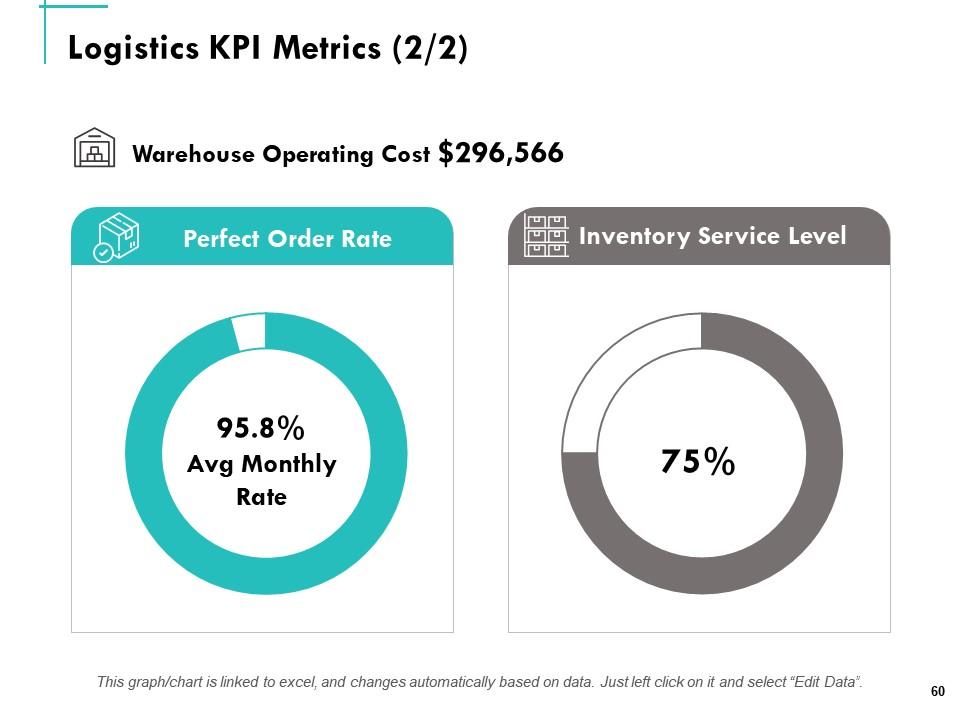
Slide 60: This slide presents Logistics KPI Metrics.
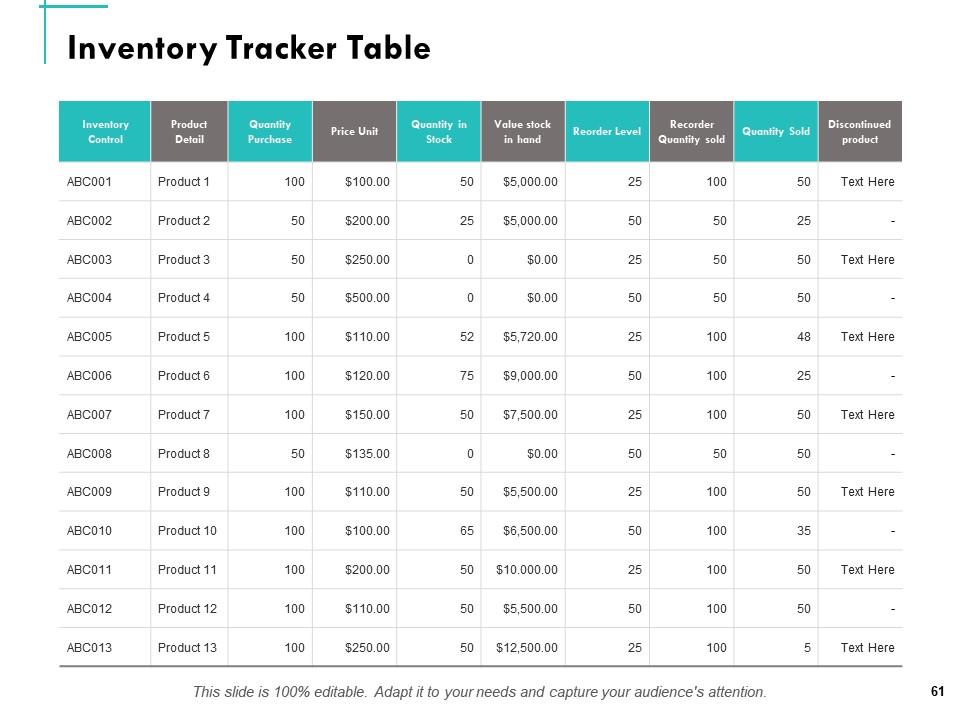
Slide 61: This slide showcases Inventory Tracker Table.
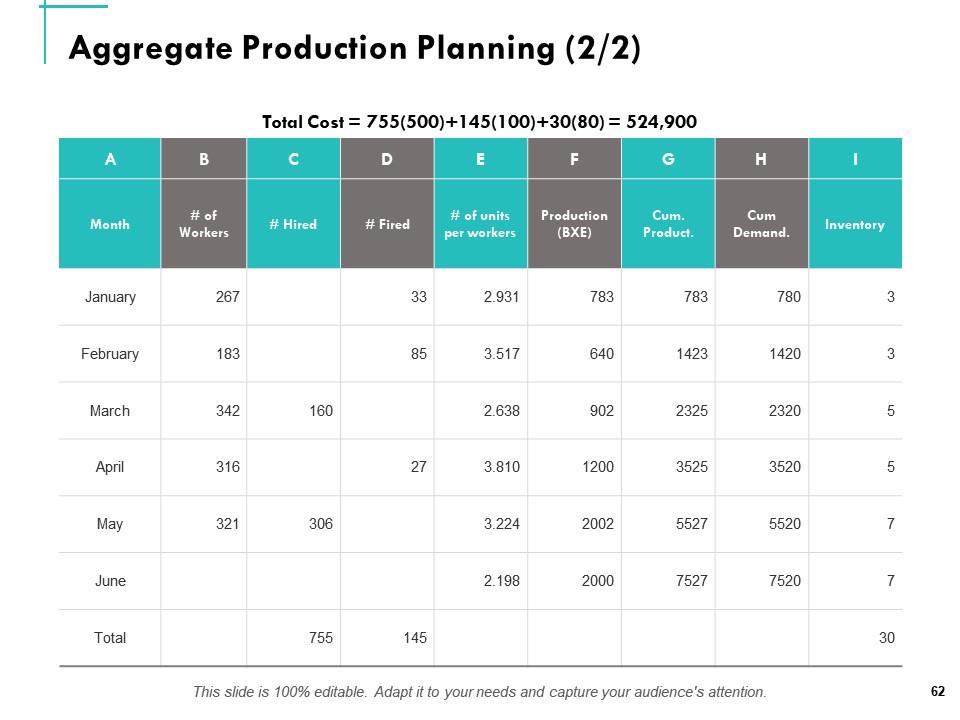
Slide 62: This slide depicts Aggregate Production Planning.
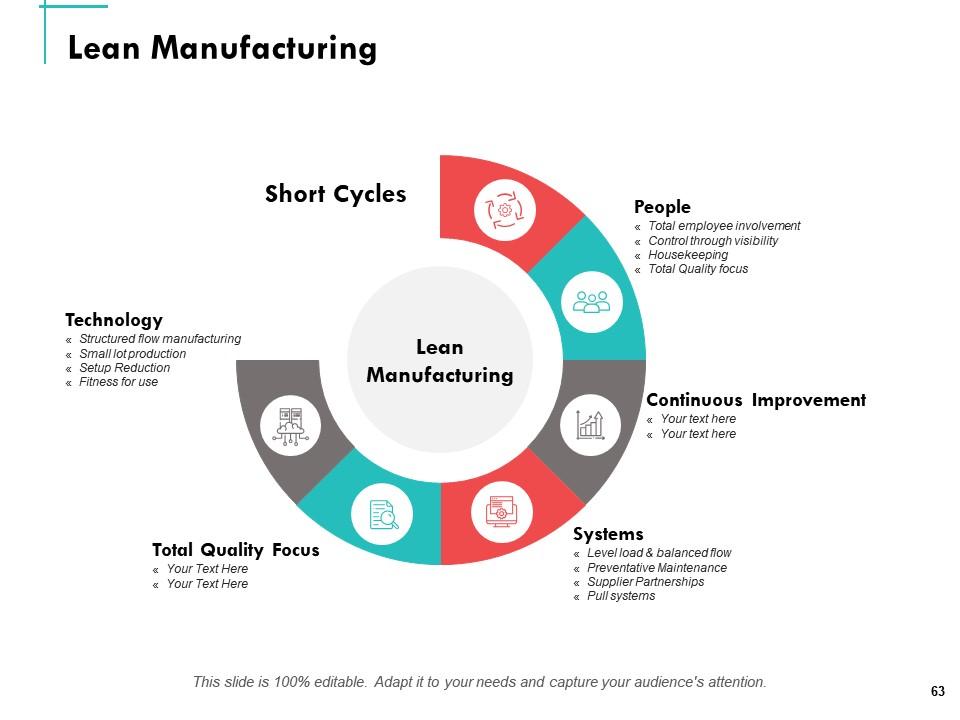
Slide 63: This slide displays Lean Manufacturing with- People, Total employee involvement, Control through visibility, Housekeeping, Total Quality focus, Systems, Level load & balanced flow, Preventative Maintenance, Supplier Partnerships, Pull systems, Total Quality Focus,etc.
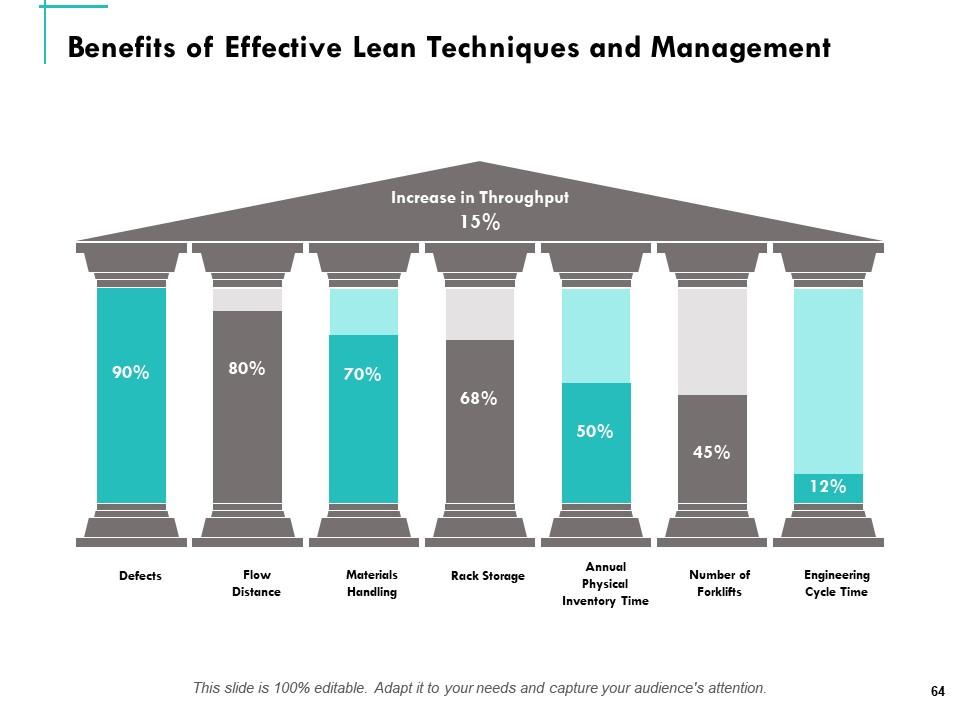
Slide 64: This slide showcases Benefits of Effective Lean Techniques and Management.
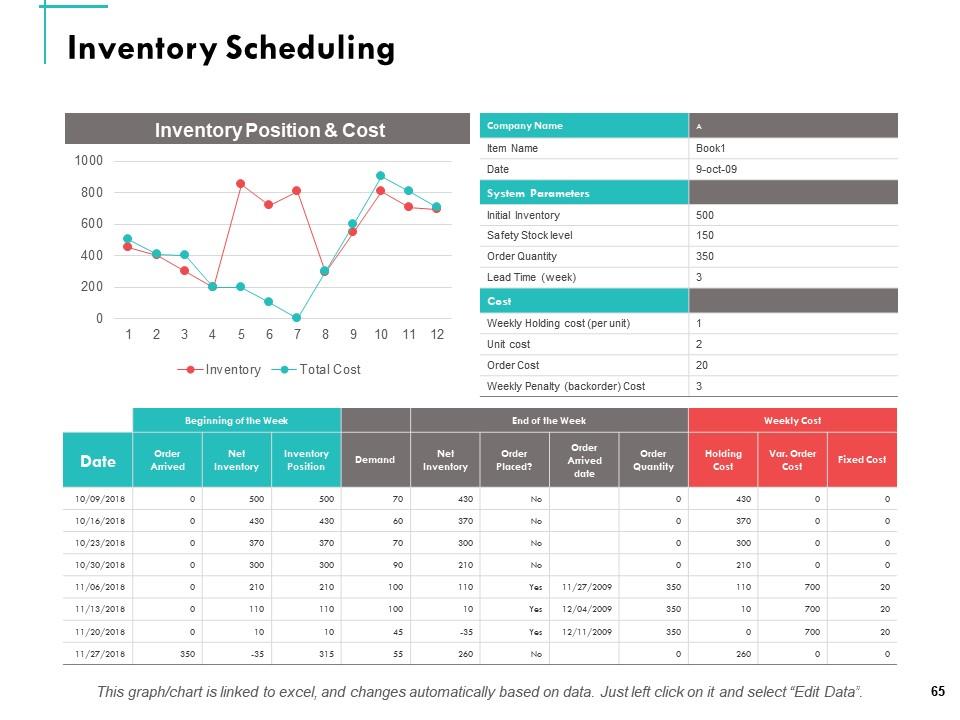
Slide 65: This slide represents Inventory Scheduling.
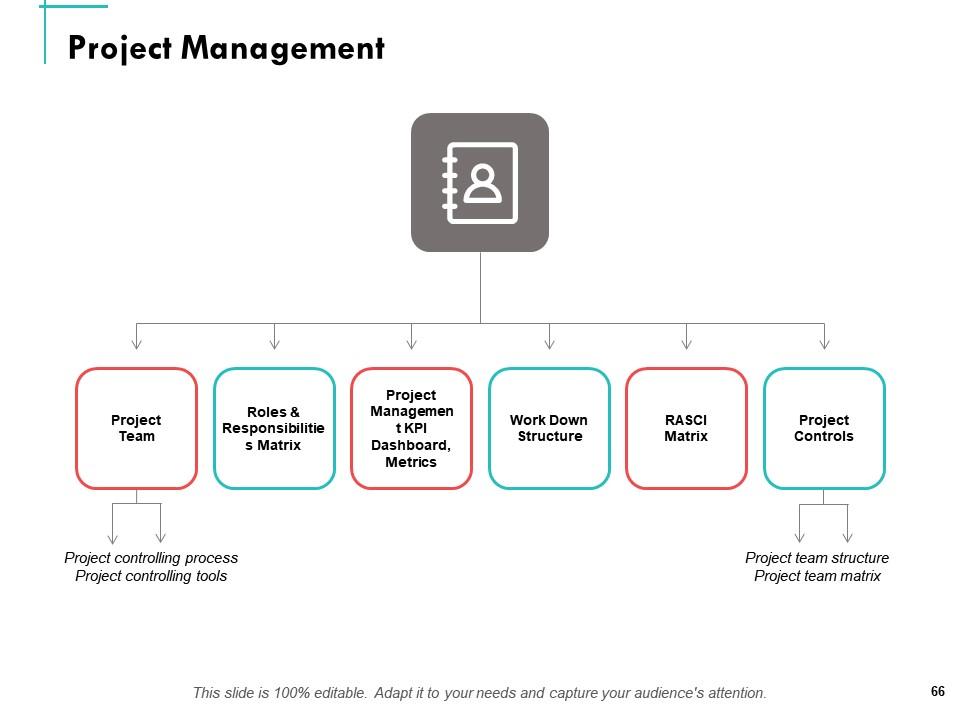
Slide 66: This slide represents Project Management with- Project controlling process, Project controlling tools, Project team structure, Project team matrix, Project Team, Roles & Responsibilities Matrix, Project Management KPI Dashboard, Metrics, Project Controls, RASCI Matrix, Work Down Structure.
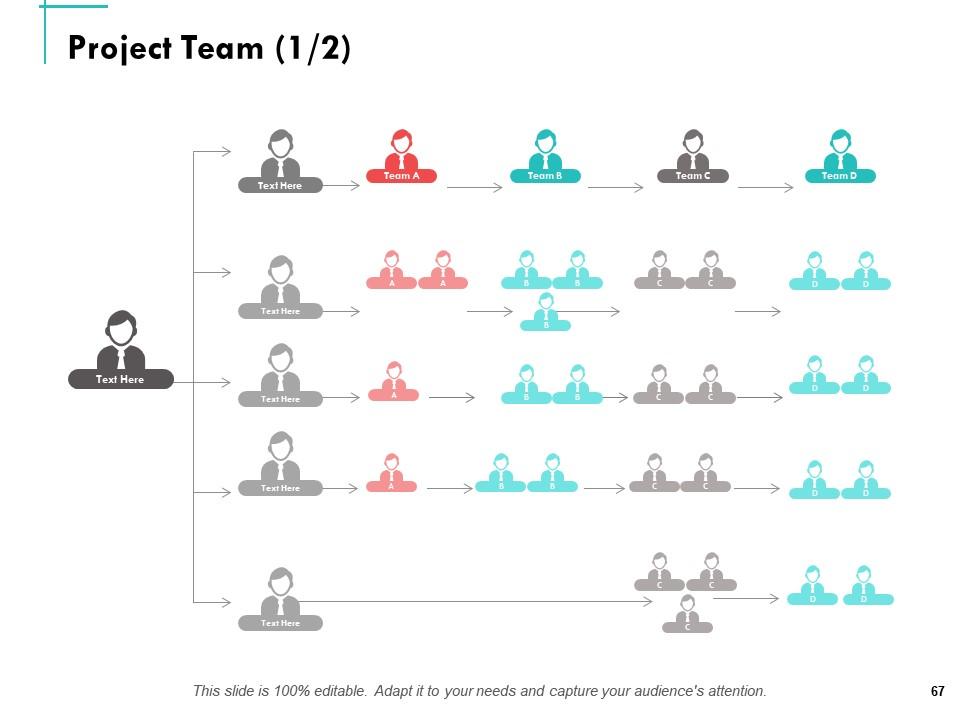
Slide 67: This slide showcases Project Team. This slide is 100% editable. Adapt it to your needs and capture your audience's attention.
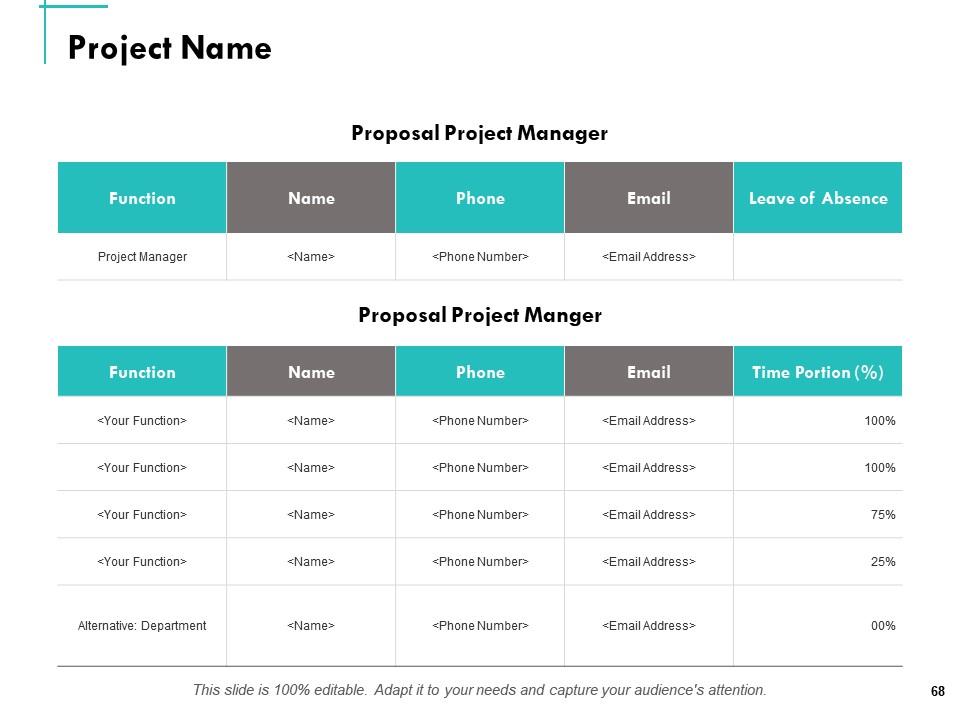
Slide 68: This slide showcases Project Name.
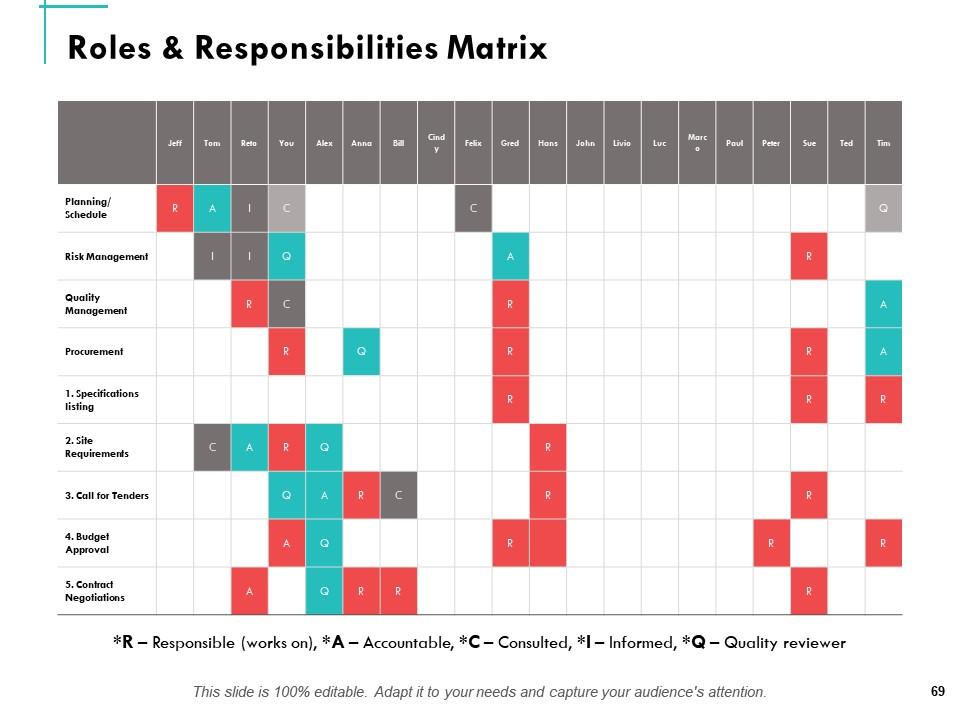
Slide 69: This slide showcases Roles & Responsibilities Matrix.
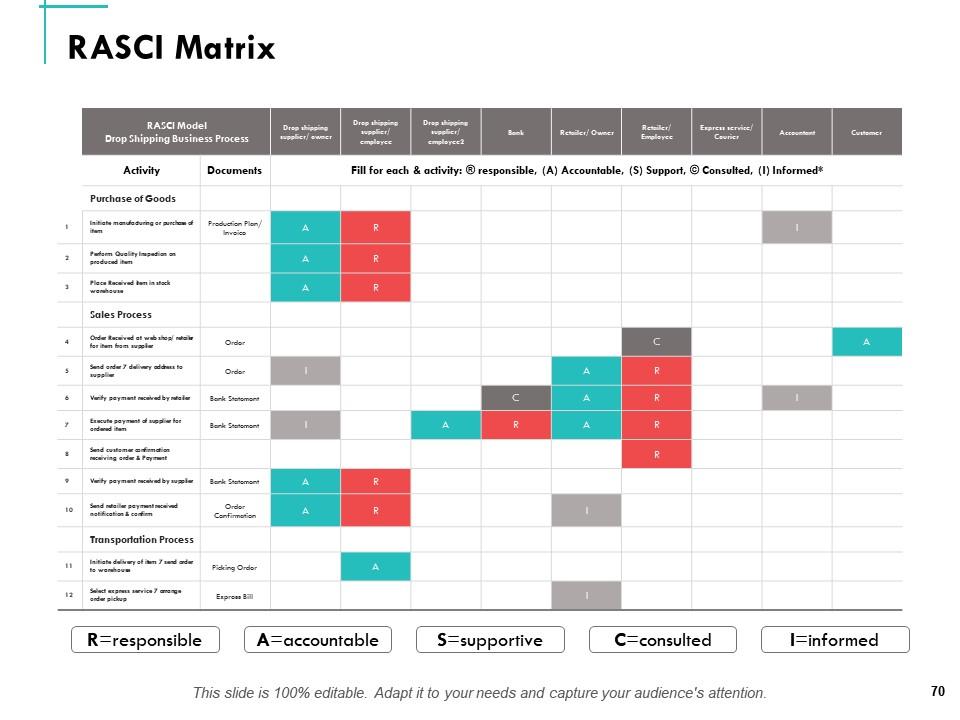
Slide 70: This slide showcases RASCI Matrix- R=responsible, A=accountable, C=consulted, I=informed, S=supportive.
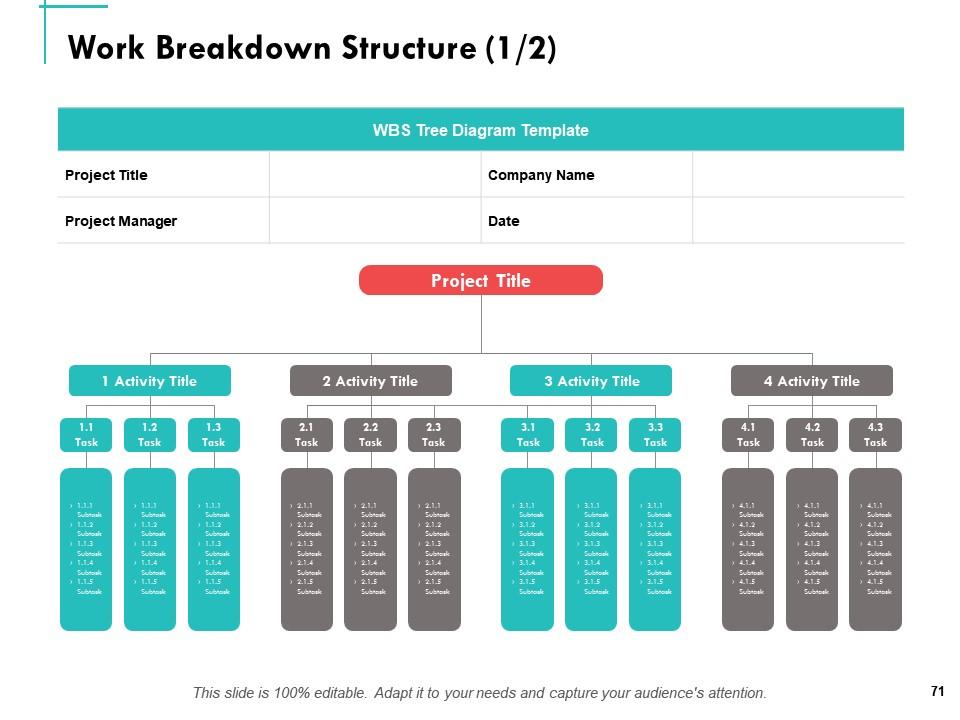
Slide 71: This slide depicts Work Breakdown Structure.
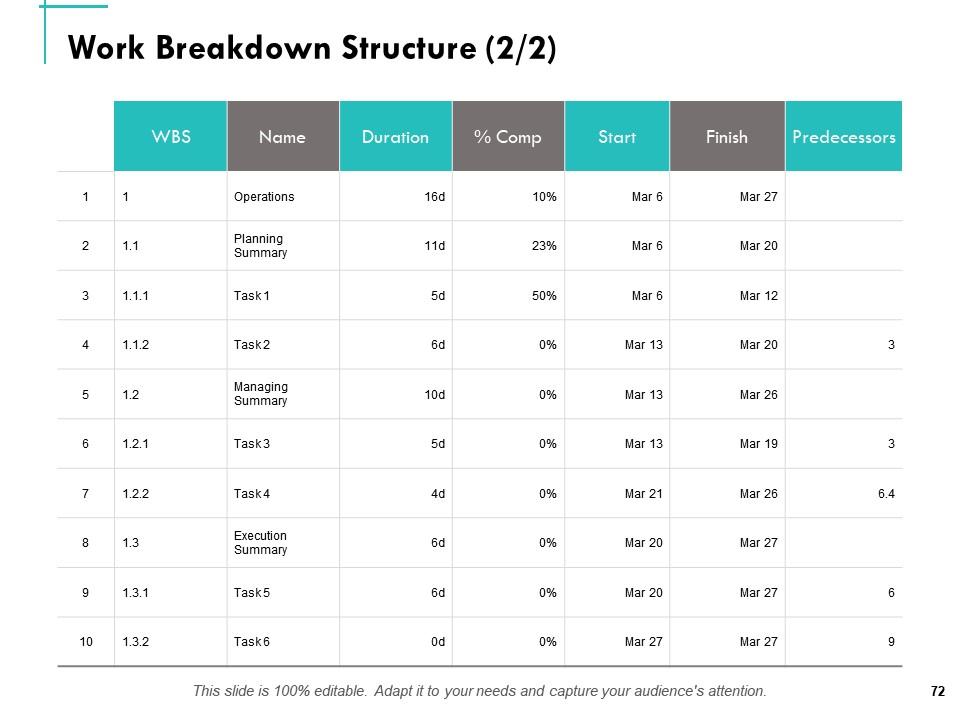
Slide 72: This slide showcases Work Breakdown Structure.
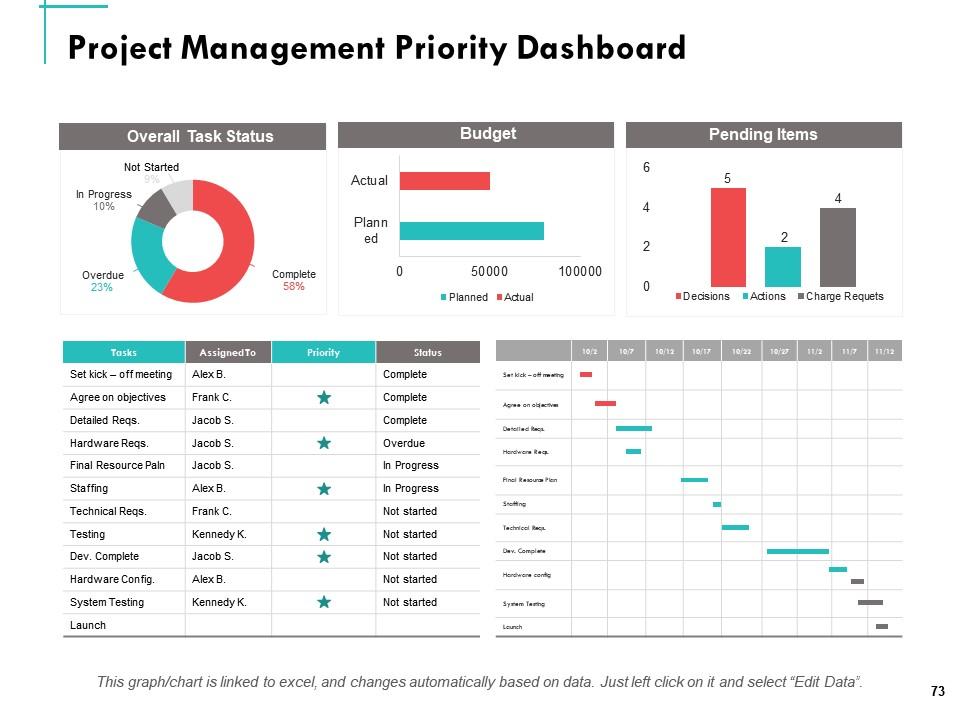
Slide 73: This slide showcases Project Management Priority Dashboard.
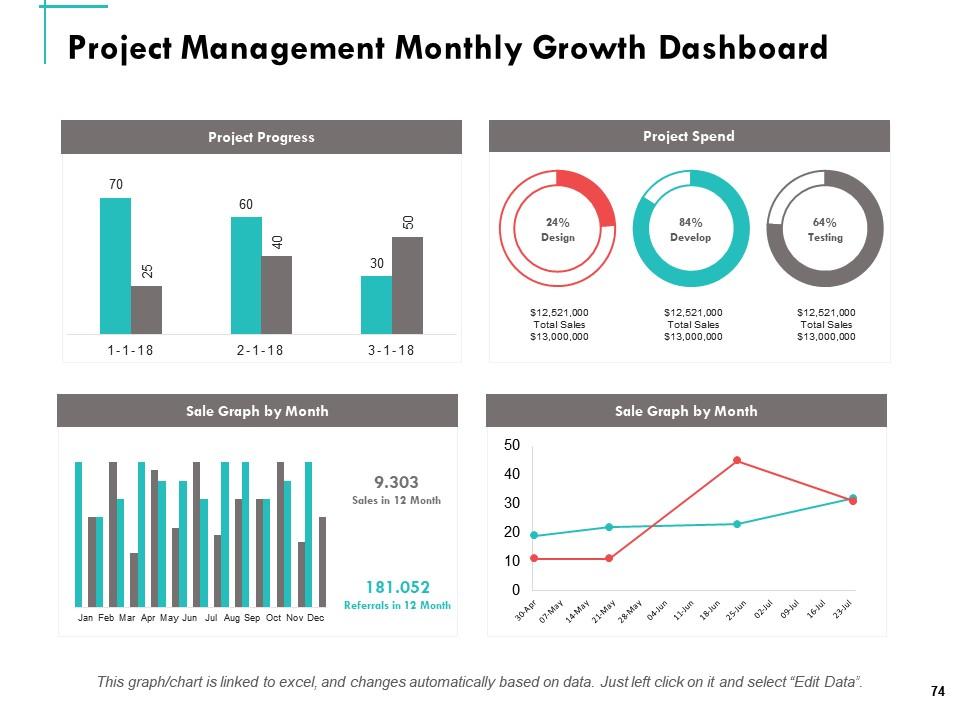
Slide 74: This slide depicts Project Management Monthly Growth Dashboard.
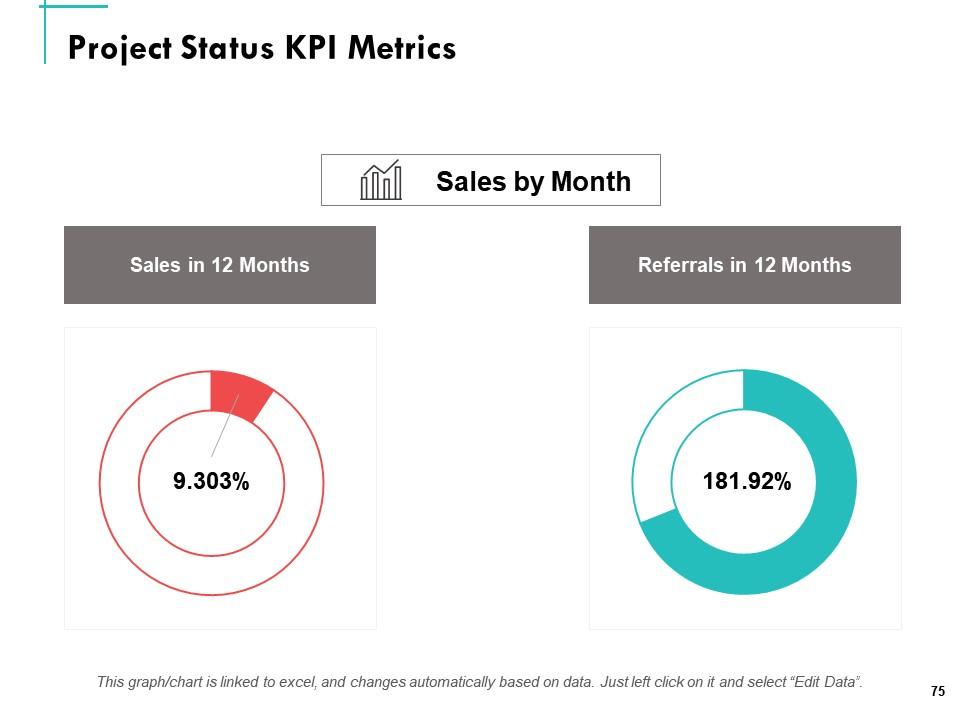
Slide 75: This slide showcases Project Status KPI Metrics
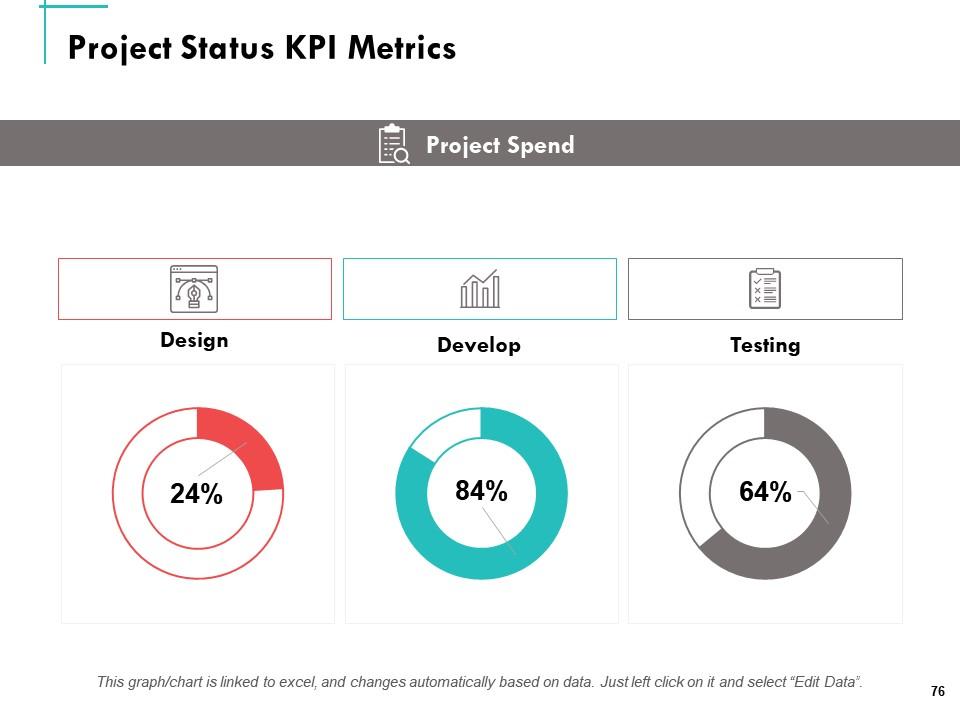
Slide 76: This slide depicts Project Status KPI Metrics.
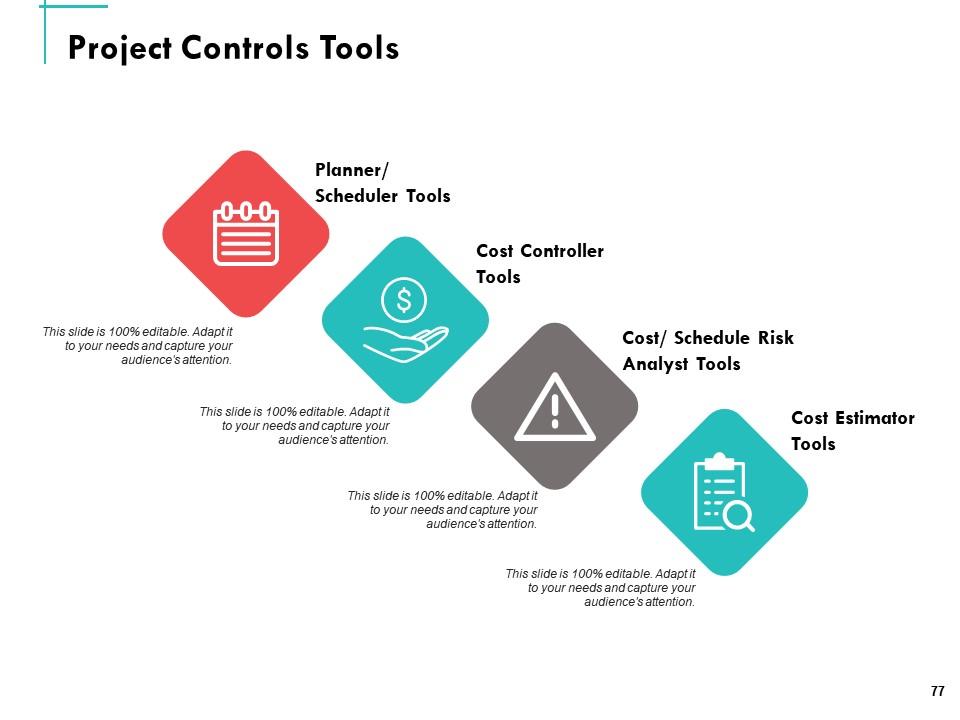
Slide 77: This slide showcases Project Controls Tools.
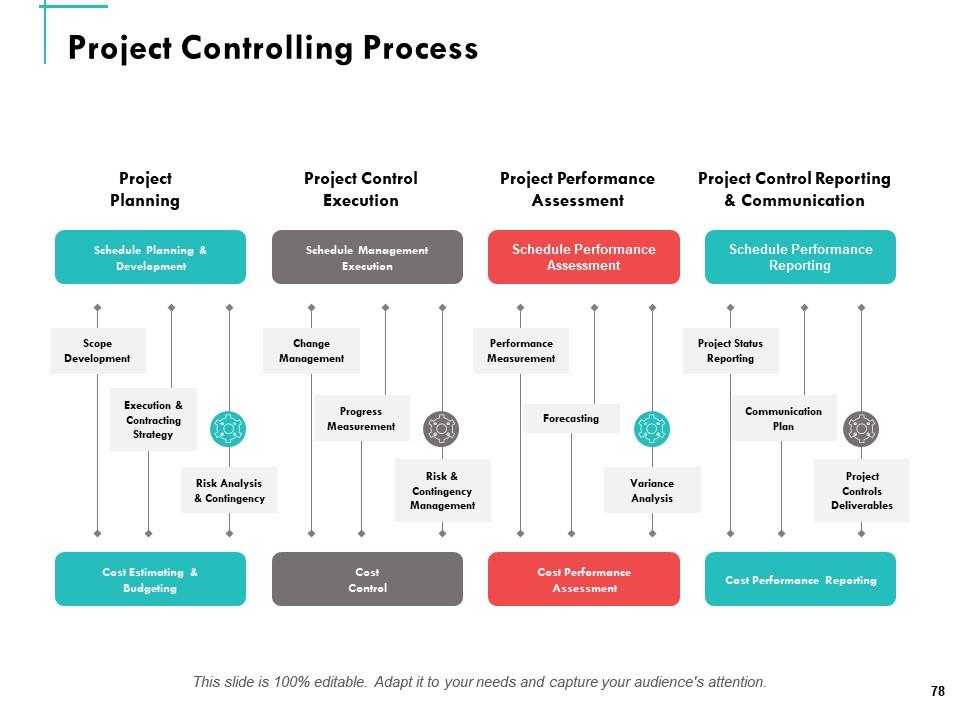
Slide 78: This slide displays Project Controlling Process with- Schedule Planning & Development, Schedule Management Execution, Schedule Performance Assessment, Schedule Performance Reporting, Project Planning, Project Control, Execution, Project Performance Assessment, Project Control Reporting & Communication, Cost Estimating & Budgeting, Cost Control, etc.
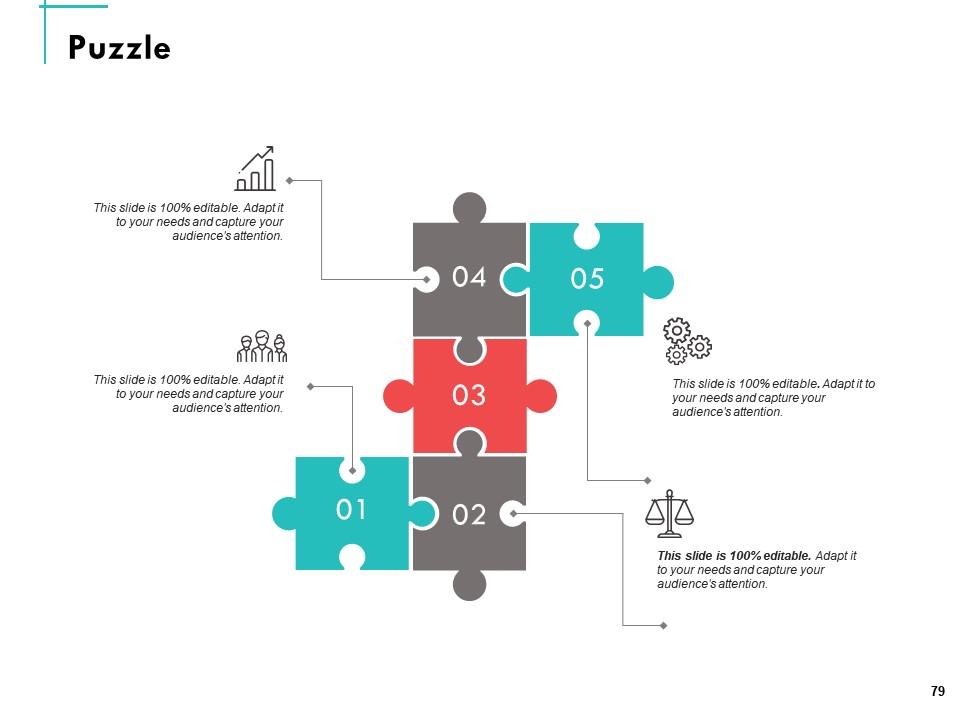
Slide 79: This is Puzzle slide with icons and text boxes.
Slide 80: This is Thank You slide with address, email address and contact number.
Company Operations Powerpoint Presentation Slides with all 80 slides:
Use our Company Operations Powerpoint Presentation Slides to effectively help you save your valuable time. They are readymade to fit into any presentation structure.
-
Nice and innovative design.
-
Really like the color and design of the presentation.
-
Unique research projects to present in meeting.
-
Easily Understandable slides.


