Dashboard PowerPoint Slides, KPi Dashboard PPT Templates
- Sub Categories
-
- 30 60 90 Day Plan
- About Us Company Details
- Action Plan
- Agenda
- Annual Report
- Audit Reports
- Balance Scorecard
- Brand Equity
- Business Case Study
- Business Communication Skills
- Business Plan Development
- Business Problem Solving
- Business Review
- Capital Budgeting
- Career Planning
- Change Management
- Color Palettes
- Communication Process
- Company Location
- Company Vision
- Compare
- Competitive Analysis
- Corporate Governance
- Cost Reduction Strategies
- Custom Business Slides
- Customer Service
- Dashboard
- Data Management
- Decision Making
- Digital Marketing Strategy
- Digital Transformation
- Disaster Management
- Diversity
- Equity Investment
- Financial Analysis
- Financial Services
- Financials
- Growth Hacking Strategy
- Human Resource Management
- Innovation Management
- Interview Process
- Knowledge Management
- Leadership
- Lean Manufacturing
- Legal Law Order
- Management
- Market Segmentation
- Marketing
- Media and Communication
- Meeting Planner
- Mergers and Acquisitions
- Metaverse
- Newspapers
- Operations and Logistics
- Organizational Structure
- Our Goals
- Performance Management
- Pitch Decks
- Pricing Strategies
- Process Management
- Product Development
- Product Launch Ideas
- Product Portfolio
- Project Management
- Purchasing Process
- Quality Assurance
- Quotes and Testimonials
- Real Estate
- Risk Management
- Sales Performance Plan
- Sales Review
- SEO
- Service Offering
- Six Sigma
- Social Media and Network
- Software Development
- Solution Architecture
- Stock Portfolio
- Strategic Management
- Strategic Planning
- Supply Chain Management
- Swimlanes
- System Architecture
- Team Introduction
- Testing and Validation
- Thanks-FAQ
- Time Management
- Timelines Roadmaps
- Value Chain Analysis
- Value Stream Mapping
- Workplace Ethic
-
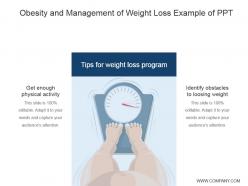 Obesity and management of weight loss example of ppt
Presenting obesity and management of weight loss example of ppt. This is a obesity and management of weight loss example of ppt. This is a two stage process. The stages in this process are get enough physical activity, identify obstacles to loosing weight, tips for weight loss program.
-
 Time based competition icon with gears
Introducing our premium set of slides with Time Based Competition Icon With Gears. Ellicudate the one stages and present information using this PPT slide. This is a completely adaptable PowerPoint template design that can be used to interpret topics like Time Based Competition Icon With Gears. So download instantly and tailor it with your information.
-
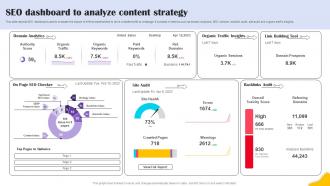 SEO Dashboard To Analyze Content Strategy Brands Content Strategy Blueprint MKT SS V
This slide depicts SEO dashboard used to evaluate the impact of efforts implemented to drive website traffic to webpage. It consists of metrics such as domain analytics, SEO checker, backlink audit, site audit and organic traffic insights. Deliver an outstanding presentation on the topic using this SEO Dashboard To Analyze Content Strategy Brands Content Strategy Blueprint MKT SS V. Dispense information and present a thorough explanation of Analyze, Content, Strategy using the slides given. This template can be altered and personalized to fit your needs. It is also available for immediate download. So grab it now.
-
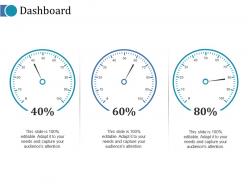 Dashboard Snapshot ppt infographics example
Presenting this set of slides with name - Dashboard Snapshot Ppt Infographics Example. This is a three stage process. The stages in this process are Low, Medium, High, Dashboard, Measurement.
-
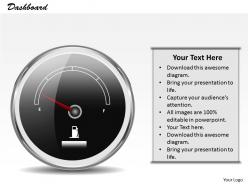 0314 dashboard design to communicate effectively 4
We are proud to present our 0314 dashboard design to communicate effectively 4. Our 0314 Dashboard Design To Communicate Effectively 4 will generate and maintain the level of interest you desire. They will create the impression you want to imprint on your audience. Our0314 Dashboard Design To Communicate Effectively 4 are effectively colour coded to priorities your plans. They automatically highlight the sequence of events you desire.
-
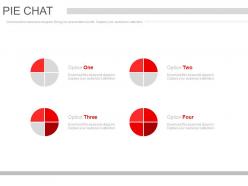 Four pie charts with different segments powerpoint slides
Presenting four pie charts with different segments powerpoint slides. This Power Point template slide has been crafted with graphic of four pie chart and percentage. This PPT slide contains the concept of financial data analysis. Use this PPT slide for business and finance related presentations.
-
 Five business peoples for skill assessment powerpoint slides
Presenting five business peoples for skill assessment powerpoint slides. This Power Point template slide has been crafted with graphic of five business peoples. This PPT slide contains the concept of skill assessment. Use this PPT slide for business and marketing related presentations.
-
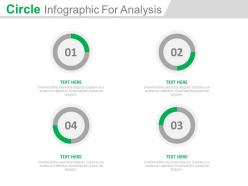 Four staged circle infographics for analysis powerpoint slides
Presenting four staged circle infographics for analysis powerpoint slides. This Power Point template slide has been crafted with graphic of four staged circle info graphics. This PPT slide contains the concept of business analysis. Use this PPT slide for business and marketing related presentations.
-
 Stop watch with male female ratio powerpoint slides
Presenting stop watch with male female ratio powerpoint slides. This Power Point template slide has been crafted with graphic of four stop watches and gender ratio. This PPT slide contains the concept of gender ratio analysis. Use this PPT slide for business and finance related presentations.
-
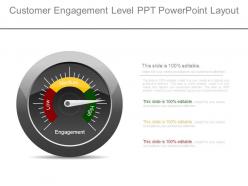 Customer engagement level ppt powerpoint layout
Presenting customer engagement level ppt powerpoint layout. This is a customer engagement level ppt powerpoint layout. This is a one stage process. The stages in this process are low, medium, high, engagement.
-
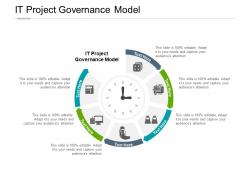 It project governance model ppt powerpoint presentation infographic cpb
Presenting this set of slides with name IT Project Governance Model Ppt Powerpoint Presentation Infographic Cpb. This is an editable Powerpoint six stages graphic that deals with topics like IT Project Governance Model to help convey your message better graphically. This product is a premium product available for immediate download and is 100 percent editable in Powerpoint. Download this now and use it in your presentations to impress your audience.
-
 Man and time hours icon
Presenting this set of slides with name Man And Time Hours Icon. This is a three stage process. The stages in this process are Man And Time Hours Icon. This is a completely editable PowerPoint presentation and is available for immediate download. Download now and impress your audience.
-
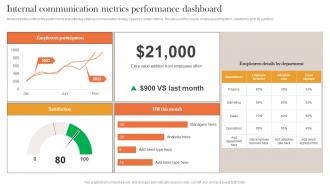 Internal Communication Metrics Internal And External Corporate Communication
Mentioned slide outlines the performance of an effective internal communication strategy based on certain metrics. The various KPIs include employee participation, satisfaction and HR activities Deliver an outstanding presentation on the topic using this Internal Communication Metrics Internal And External Corporate Communication. Dispense information and present a thorough explanation of Internal, Performance, Communication using the slides given. This template can be altered and personalized to fit your needs. It is also available for immediate download. So grab it now.
-
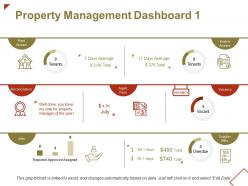 Property management dashboard reconciliation ppt powerpoint presentation file show
Presenting this set of slides with name - Property Management Dashboard Reconciliation Ppt Powerpoint Presentation File Show. This is a two stages process. The stages in this process are Finance, Marketing, Management, Investment, Analysis.
-
 Multicolour ticking clock hanging on wall
Presenting this set of slides with name Multicolour Ticking Clock Hanging On Wall. This is a five stage process. The stages in this process are Multicolour Ticking Clock Hanging On Wall. This is a completely editable PowerPoint presentation and is available for immediate download. Download now and impress your audience.
-
 0115 graphic of pound with loading symbol of profit powerpoint template
We are proud to present our 0115 graphic of pound with loading symbol of profit powerpoint template. Graphic of pound with loading symbol has been used to craft this power point template. This PPT contains the concept of profit in finance. This PPT is suitable for business and finance related presentations.
-
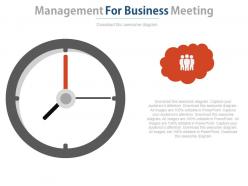 Time management for business meetings powerpoint slides
Presenting time management for business meetings powerpoint slides. This Power Point template slide has been crafted with graphic of time and meeting diagram. This PPT slide contains the concept of time management. Use this PPT slide for business and finance related presentations.
-
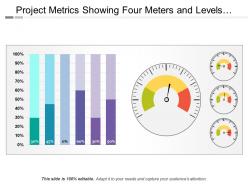 Project metrics showing four meters and levels of projects
Presenting this set of slides with name - Project Metrics Showing Four Meters And Levels Of Projects. This is a two stage process. The stages in this process are Project Kpis, Project Dashboard, Project Metrics.
-
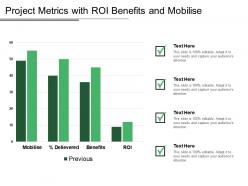 Project metrics with roi benefits and mobilise
Presenting this set of slides with name - Project Metrics With Roi Benefits And Mobilise. This is a four stage process. The stages in this process are Project Kpis, Project Dashboard, Project Metrics.
-
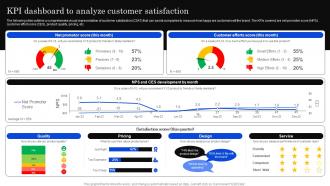 KPI Dashboard To Analyze Developing Positioning Strategies Based On Market Research
The following slide outlines a comprehensive visual representation of customer satisfaction CSAT that can assist companies to measure how happy are customers wit the brand. The KPIs covered are net promoter score NPS, customer effort score CES, product quality, pricing, etc. Deliver an outstanding presentation on the topic using this KPI Dashboard To Analyze Developing Positioning Strategies Based On Market Research. Dispense information and present a thorough explanation of Analyze, Satisfaction, Customer using the slides given. This template can be altered and personalized to fit your needs. It is also available for immediate download. So grab it now.
-
 0614 business consulting diagram design of volume button powerpoint slide template
We are proud to present our 0614 business consulting diagram design of volume button powerpoint slide template. Create visually stunning Microsoft office PPT Presentations with our above template. The color coding of our template is specifically designed to highlight you points. Organize your thoughts and illuminate your ideas accordingly. It outlines the depth of your thought process.
-
 Company Management With About Us Details Powerpoint Slides
Presenting company management with about us details powerpoint slides. This Power Point template diagram slide has been crafted with graphic of company. This PPT diagram contains the concept of company management and about us representation. Use this PPT diagram for business and finance related presentations.
-
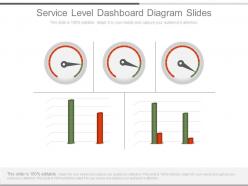 Service level dashboard diagram slides
Presenting service level dashboard diagram slides. This is a service level dashboard diagram slides. This is a three stage process. The stages in this process are business, marketing, success, finance, management.
-
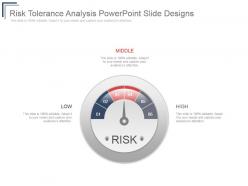 Risk tolerance analysis powerpoint slide designs
Presenting risk tolerance analysis powerpoint slide designs. This is a risk tolerance analysis powerpoint slide designs. This is a one stage process. The stages in this process are middle, low, high.
-
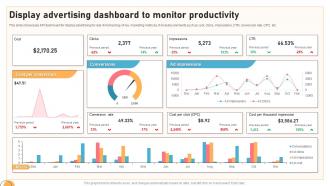 Display Advertising Dashboard To Monitor Productivity
This slide showcases KPI dashboard for display advertising for real- time tracking of key marketing metrices, It includes elements such as cost, clicks, impressions, CTR, conversion rate, CPC, etc. Introducing our Display Advertising Dashboard To Monitor Productivity set of slides. The topics discussed in these slides are This slide showcases KPI dashboard for display advertising for real time tracking of key marketing metrices, It includes elements such as cost, clicks, impressions, CTR, conversion rate, CPC, etc. . This is an immediately available PowerPoint presentation that can be conveniently customized. Download it and convince your audience.
-
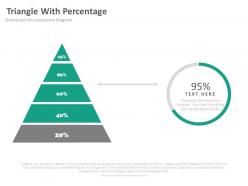 Five staged triangle with percentage analysis powerpoint slides
Presenting five staged triangle with percentage analysis powerpoint slides. This Power Point template slide has been crafted with graphic of five staged triangle and percentage diagram. This PPT diagram contains the concept of financial analysis. Use this PPT diagram slide for business and marketing related presentations.
-
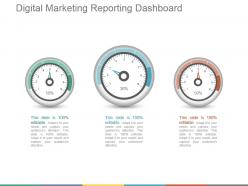 Digital marketing reporting dashboard snapshot presentation examples
Presenting digital marketing reporting dashboard presentation examples. This is a digital marketing reporting dashboard presentation examples. This is a three stage process. The stages in this process are business, dashboard, speed, meter, marketing.
-
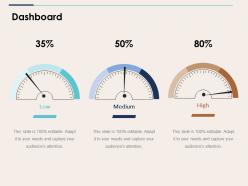 Dashboard snapshot ppt pictures
Presenting this set of slides with name - Dashboard Snapshot Ppt Pictures. This is a three stage process. The stages in this process are Business, Marketing, Percentage, Dashboard, Low.
-
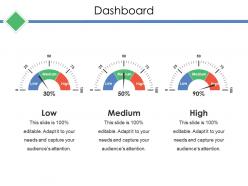 Dashboard snapshot ppt backgrounds
Presenting this set of slides with name - Dashboard Snapshot Ppt Backgrounds. This is a three stage process. The stages in this process are Low, Medium, High, Dashboard.
-
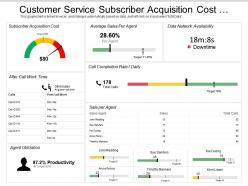 Customer service subscriber acquisition cost dashboard
Presenting this set of slides with name - Customer Service Subscriber Acquisition Cost Dashboard. This is a three stage process. The stages in this process are Customer Base, Recurring Customers, Customer Services.
-
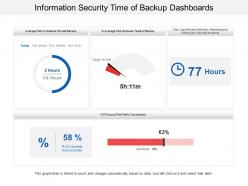 Information security time of backup dashboards
Presenting this set of slides with name - Information Security Time Of Backup Dashboards. This is a three stage process. The stages in this process are Information Security Strategy, Information Security Plan, Information Protection Strategy.
-
 Project Controls And Time Keeping Icon
Introducing our premium set of slides with Project Controls And Time Keeping Icon. Elucidate the three stages and present information using this PPT slide. This is a completely adaptable PowerPoint template design that can be used to interpret topics like Project Controls, Time Keeping Icon. So download instantly and tailor it with your information.
-
 Satisfaction Rate Icon For Customer Service KPI
Presenting our set of slides with name Satisfaction Rate Icon For Customer Service KPI. This exhibits information on four stages of the process. This is an easy-to-edit and innovatively designed PowerPoint template. So download immediately and highlight information on Satisfaction Rate Icon, Customer Service KPI.
-
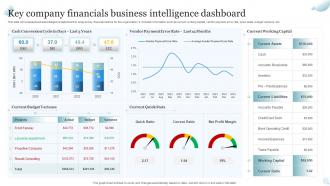 Key Company Financials Business Intelligence Dashboard
This slide showcases business intelligence dashboard to analyze key financial metrics for the organization. It includes information such as current working capital, vendor payment error rate, quick stats, budget variance, etc. Presenting our well structured Key Company Financials Business Intelligence Dashboard. The topics discussed in this slide are Cash Conversion Cycle, Budget Variance, Current Quick Stats. This is an instantly available PowerPoint presentation that can be edited conveniently. Download it right away and captivate your audience.
-
 Dashboard For Tracking Business And IT Alignment Ppt Layouts Example File
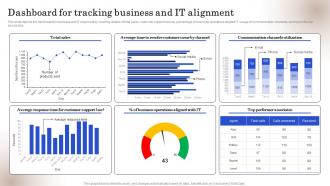
This slide depicts the dashboard for business and IT alignment by covering details of total sales, customer support service, percentage of business operations aligned IT, usage of communication channels, and top performer associates. Deliver an outstanding presentation on the topic using this Dashboard For Tracking Business And IT Alignment Ppt Layouts Example File. Dispense information and present a thorough explanation of Performer Associates, Channels Utilization, Total Sales using the slides given. This template can be altered and personalized to fit your needs. It is also available for immediate download. So grab it now.
-
 Dashboard Monitoring The Performance Of Developing Shareholder Trust With Efficient Strategy SS V
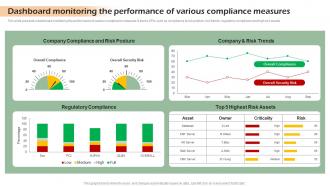
This slide presents a dashboard monitoring the performance of various compliance measures. It tracks KPIs such as compliance and risk posture, risk trends, regulatory compliance and high risk assets. Present the topic in a bit more detail with this Dashboard Monitoring The Performance Of Developing Shareholder Trust With Efficient Strategy SS V. Use it as a tool for discussion and navigation on Monitoring, Performance, Compliance. This template is free to edit as deemed fit for your organization. Therefore download it now.
-
 0314 design of red large building
We are proud to present our 0314 design of red large building. Hit the ground running with our 0314 Design Of Red Large Building Powerpoint Templates. Go the full distance with ease and elan. Leave a lasting impression with our 0314 Design Of Red Large Building Powerpoint Templates. They possess an inherent longstanding recall factor.
-
 Jx two staged performance optimization diagram powerpoint template
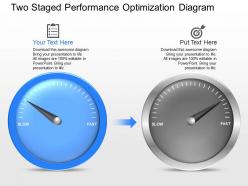
Presenting jx two staged performance optimization diagram powerpoint template. Two staged text box diagram has been used to design this Power Point template diagram. This PPT diagram contains the concept of performance optimization in any field. Use this PPT diagram for business and marketing related presentations.
-
 Brand performance dashboard powerpoint slide backgrounds
Presenting brand performance dashboard powerpoint slide backgrounds. This is a brand performance dashboard powerpoint slide backgrounds. This is a five stage process. The stages in this process are dashboard, strategy, business, marketing.
-
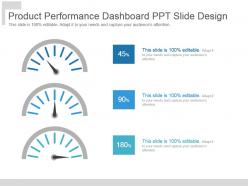 Product performance dashboard ppt slide design
Presenting product performance dashboard ppt slide design. This is a product performance dashboard ppt slide design. This is a three stage process. The stages in this process are business, marketing, strategy, analysis, management.
-
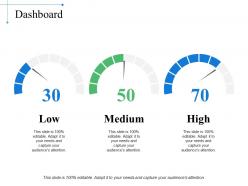 Dashboard snapshot ppt sample file
Presenting this set of slides with name - Dashboard Snapshot Ppt Sample File. This is a three stage process. The stages in this process are Low, Medium, High.
-
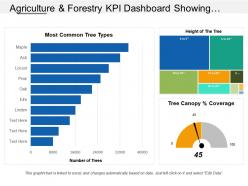 Agriculture and forestry kpi dashboard showing most common tree types height of the tree
Highlighting agriculture and forestry KPI dashboard showing most common tree types height of the tree PPT template. An easy access to make the desired changes or edit it anyways. Wide screen view of the slides. Easy conversion into Jpeg or Pdf format. The PPT images offer compatibility with Google slides. Valuable for business professionals, sales representatives, marketing professionals, students and selling investigators. High quality charts and visuals used in the designing process. They enhance the performance of the presentation.
-
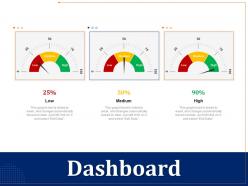 Dashboard r137 ppt powerpoint presentation gallery icons
Presenting this set of slides with name Dashboard R137 Ppt Powerpoint Presentation Gallery Icons. This is a three stage process. The stages in this process are Low, Medium, High. This is a completely editable PowerPoint presentation and is available for immediate download. Download now and impress your audience.
-
 Kpis and operations dashboard snapshot presentation powerpoint example
Presenting kpis and operations dashboard snapshot presentation powerpoint example. This is a kpis and operations dashboard presentation powerpoint example. This is a three stage process. The stages in this process are operations, revenue, manufacturing.
-
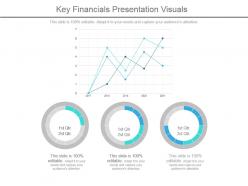 Key financials presentation visuals
Presenting key financials presentation visuals. This is a key financials presentation visuals. This is a three stage process. The stages in this process are business, marketing, measure, success, graph.
-
 Recruitment process template 2 powerpoint slide presentation examples
Presenting this set of slides with name - Recruitment Process Template 2 Powerpoint Slide Presentation Examples. This is a four stage process. The stages in this process are Submit Application, Written Test, Interview, Sign Offer.
-
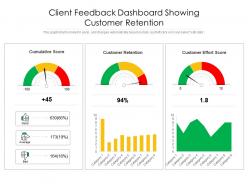 Client feedback dashboard showing customer retention
Introducing our Client Feedback Dashboard Showing Customer Retention set of slides. The topics discussed in these slides are Cumulative Score, Customer Retention, Customer Effort Score. This is an immediately available PowerPoint presentation that can be conveniently customized. Download it and convince your audience.
-
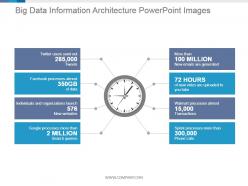 Big data information architecture powerpoint images
Presenting big data information architecture powerpoint images. This is a big data information architecture powerpoint images. This is a eight stage process. The stages in this process are twitter users send out tweets, facebook processes almost of data, individuals and organizations launch new websites, google processes more than search queries, more than new emails are generated, of new video are uploaded to you tube, walmart processes almost transactions, sprint processes more than phone calls.
-
 Evaluating advertising agency on parameters dashboard ppt templates
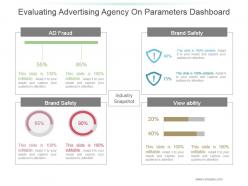
Presenting evaluating advertising agency on parameters dashboard ppt templates. This is a evaluating advertising agency on parameters dashboard ppt templates. This is a four stage process. The stages in this process are ad fraud, industry snapshot, view ability, brand safety.
-
 Dashboard snapshot presentation outline
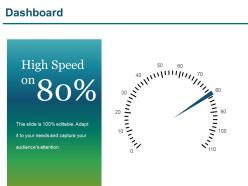
Presenting dashboard presentation outline. This is a dashboard snapshot presentation outline . This is a one stage process. The stages in this process are high speed, low, medium, dashboard, strategy.
-
 Digital Marketing Dashboard With Customer Digital Marketing Strategies For Startups Strategy SS V
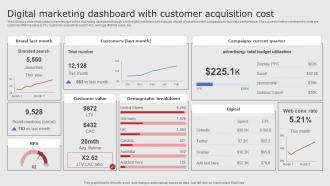
The following slide showcases comprehensive online marketing dashboard through which digital marketers can evaluate impact of advertisement campaigns on business performance. The success metrics mentioned in slide are customer lifetime value LTV, customer acquisition cost CAC, average lifetime value, etc. Deliver an outstanding presentation on the topic using this Digital Marketing Dashboard With Customer Digital Marketing Strategies For Startups Strategy SS V. Dispense information and present a thorough explanation of Marketing, Customer, Cost using the slides given. This template can be altered and personalized to fit your needs. It is also available for immediate download. So grab it now.
-
 Digital Marketing Dashboard With Customer Acquisition Marketing Your Startup Best Strategy SS V
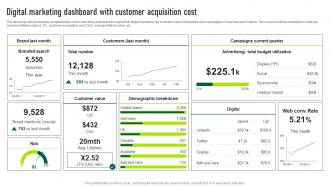
The following slide showcases comprehensive online marketing dashboard through which digital marketers can evaluate impact of advertisement campaigns on business performance. The success metrics mentioned in slide are customer lifetime value LTV, customer acquisition cost CAC, average lifetime value, etc. Deliver an outstanding presentation on the topic using this Digital Marketing Dashboard With Customer Acquisition Marketing Your Startup Best Strategy SS V. Dispense information and present a thorough explanation of Digital, Marketing, Customer using the slides given. This template can be altered and personalized to fit your needs. It is also available for immediate download. So grab it now.
-
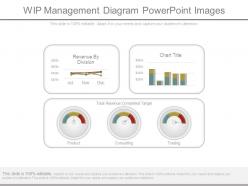 Wip management diagram powerpoint images
Presenting wip management diagram powerpoint images. This is a wip management diagram powerpoint images. This is a three stage process. The stages in this process are product, consulting, trading, total revenue completed target, revenue by division, chart title.
-
 Workplace ethics results slide powerpoint slide show
Presenting Workplace Ethics Results Slide PowerPoint Slide Show.. A presenter can easily edit all kind of feature or even text of this business ethics slide as per his requirement. You can modify the font size, font color & font style of this slide. This template is completely compatible with Google Slides. You can make changes in the graphical illustrations, aspect ratio, color of the workplace ethics template because the template is 100% customizable. Download this slide in JPG and PDF format .
-
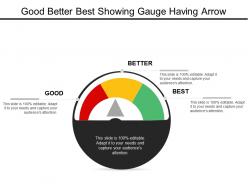 Good better best showing gauge having arrow
Presenting this set of slides with name - Good Better Best Showing Gauge Having Arrow. This is a three stage process. The stages in this process are Good Better Best, Good Great Superb, Good Great Excellent.
-
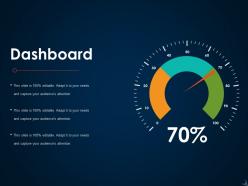 Dashboard Snapshot ppt icon good
Presenting this set of slides with name - Dashboard Snapshot Ppt Icon Good. This is a three stage process. The stages in this process are Business, Marketing, Dashboard, Percentage, Process.
-
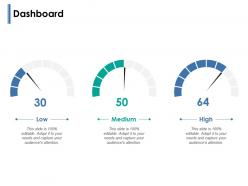 Dashboard low medium meters ppt powerpoint presentation pictures files
Presenting this set of slides with name Dashboard Low Medium Meters Ppt Powerpoint Presentation Pictures Files. This is a three stage process. The stages in this process are Dashboard, Marketing, Management, Investment, Analysis. This is a completely editable PowerPoint presentation and is available for immediate download. Download now and impress your audience.
-
 Time approval icon for business meeting
Presenting this set of slides with name Time Approval Icon For Business Meeting. This is a three stage process. The stages in this process are Time Approval Icon For Business Meeting. This is a completely editable PowerPoint presentation and is available for immediate download. Download now and impress your audience.
-
 Net promoter scorecard example marketing research scorecard example
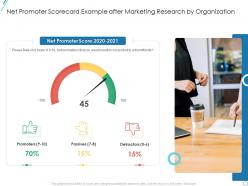
Deliver an outstanding presentation on the topic using this Net Promoter Scorecard Example Marketing Research Scorecard Example. Dispense information and present a thorough explanation of Promoters, Passives, Detractors using the slides given. This template can be altered and personalized to fit your needs. It is also available for immediate download. So grab it now.
-
 Customer Related Quality Metrics Dashboard For Project Management
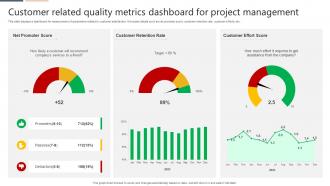
This slide displays a dashboard for measurement of parameters related to customer satisfaction. It includes details such as net promoter score, customer retention rate, customer efforts, etc. Introducing our Customer Related Quality Metrics Dashboard For Project Management set of slides. The topics discussed in these slides are Customer Retention Rate, Customer Effort Score. This is an immediately available PowerPoint presentation that can be conveniently customized. Download it and convince your audience.


